In this series: Texas 2025-26 Enrollment.
Four Texas school districts reported 100% Hispanic enrollment in 2025-26. Not 99%. Not rounding up. Every student. La Villa ISD, a 459-student district in the Rio Grande Valley, is one of them. So is Ramirez CSD, which enrolls 24 students in Duval County. They sit at the extreme end of a spectrum that stretches across 94 districts, from the Rio Grande Valley to the south side of San Antonio, collectively enrolling more than 543,000 students in communities where the question is not whether the student body reflects the surrounding population, but what happens when that population shrinks.
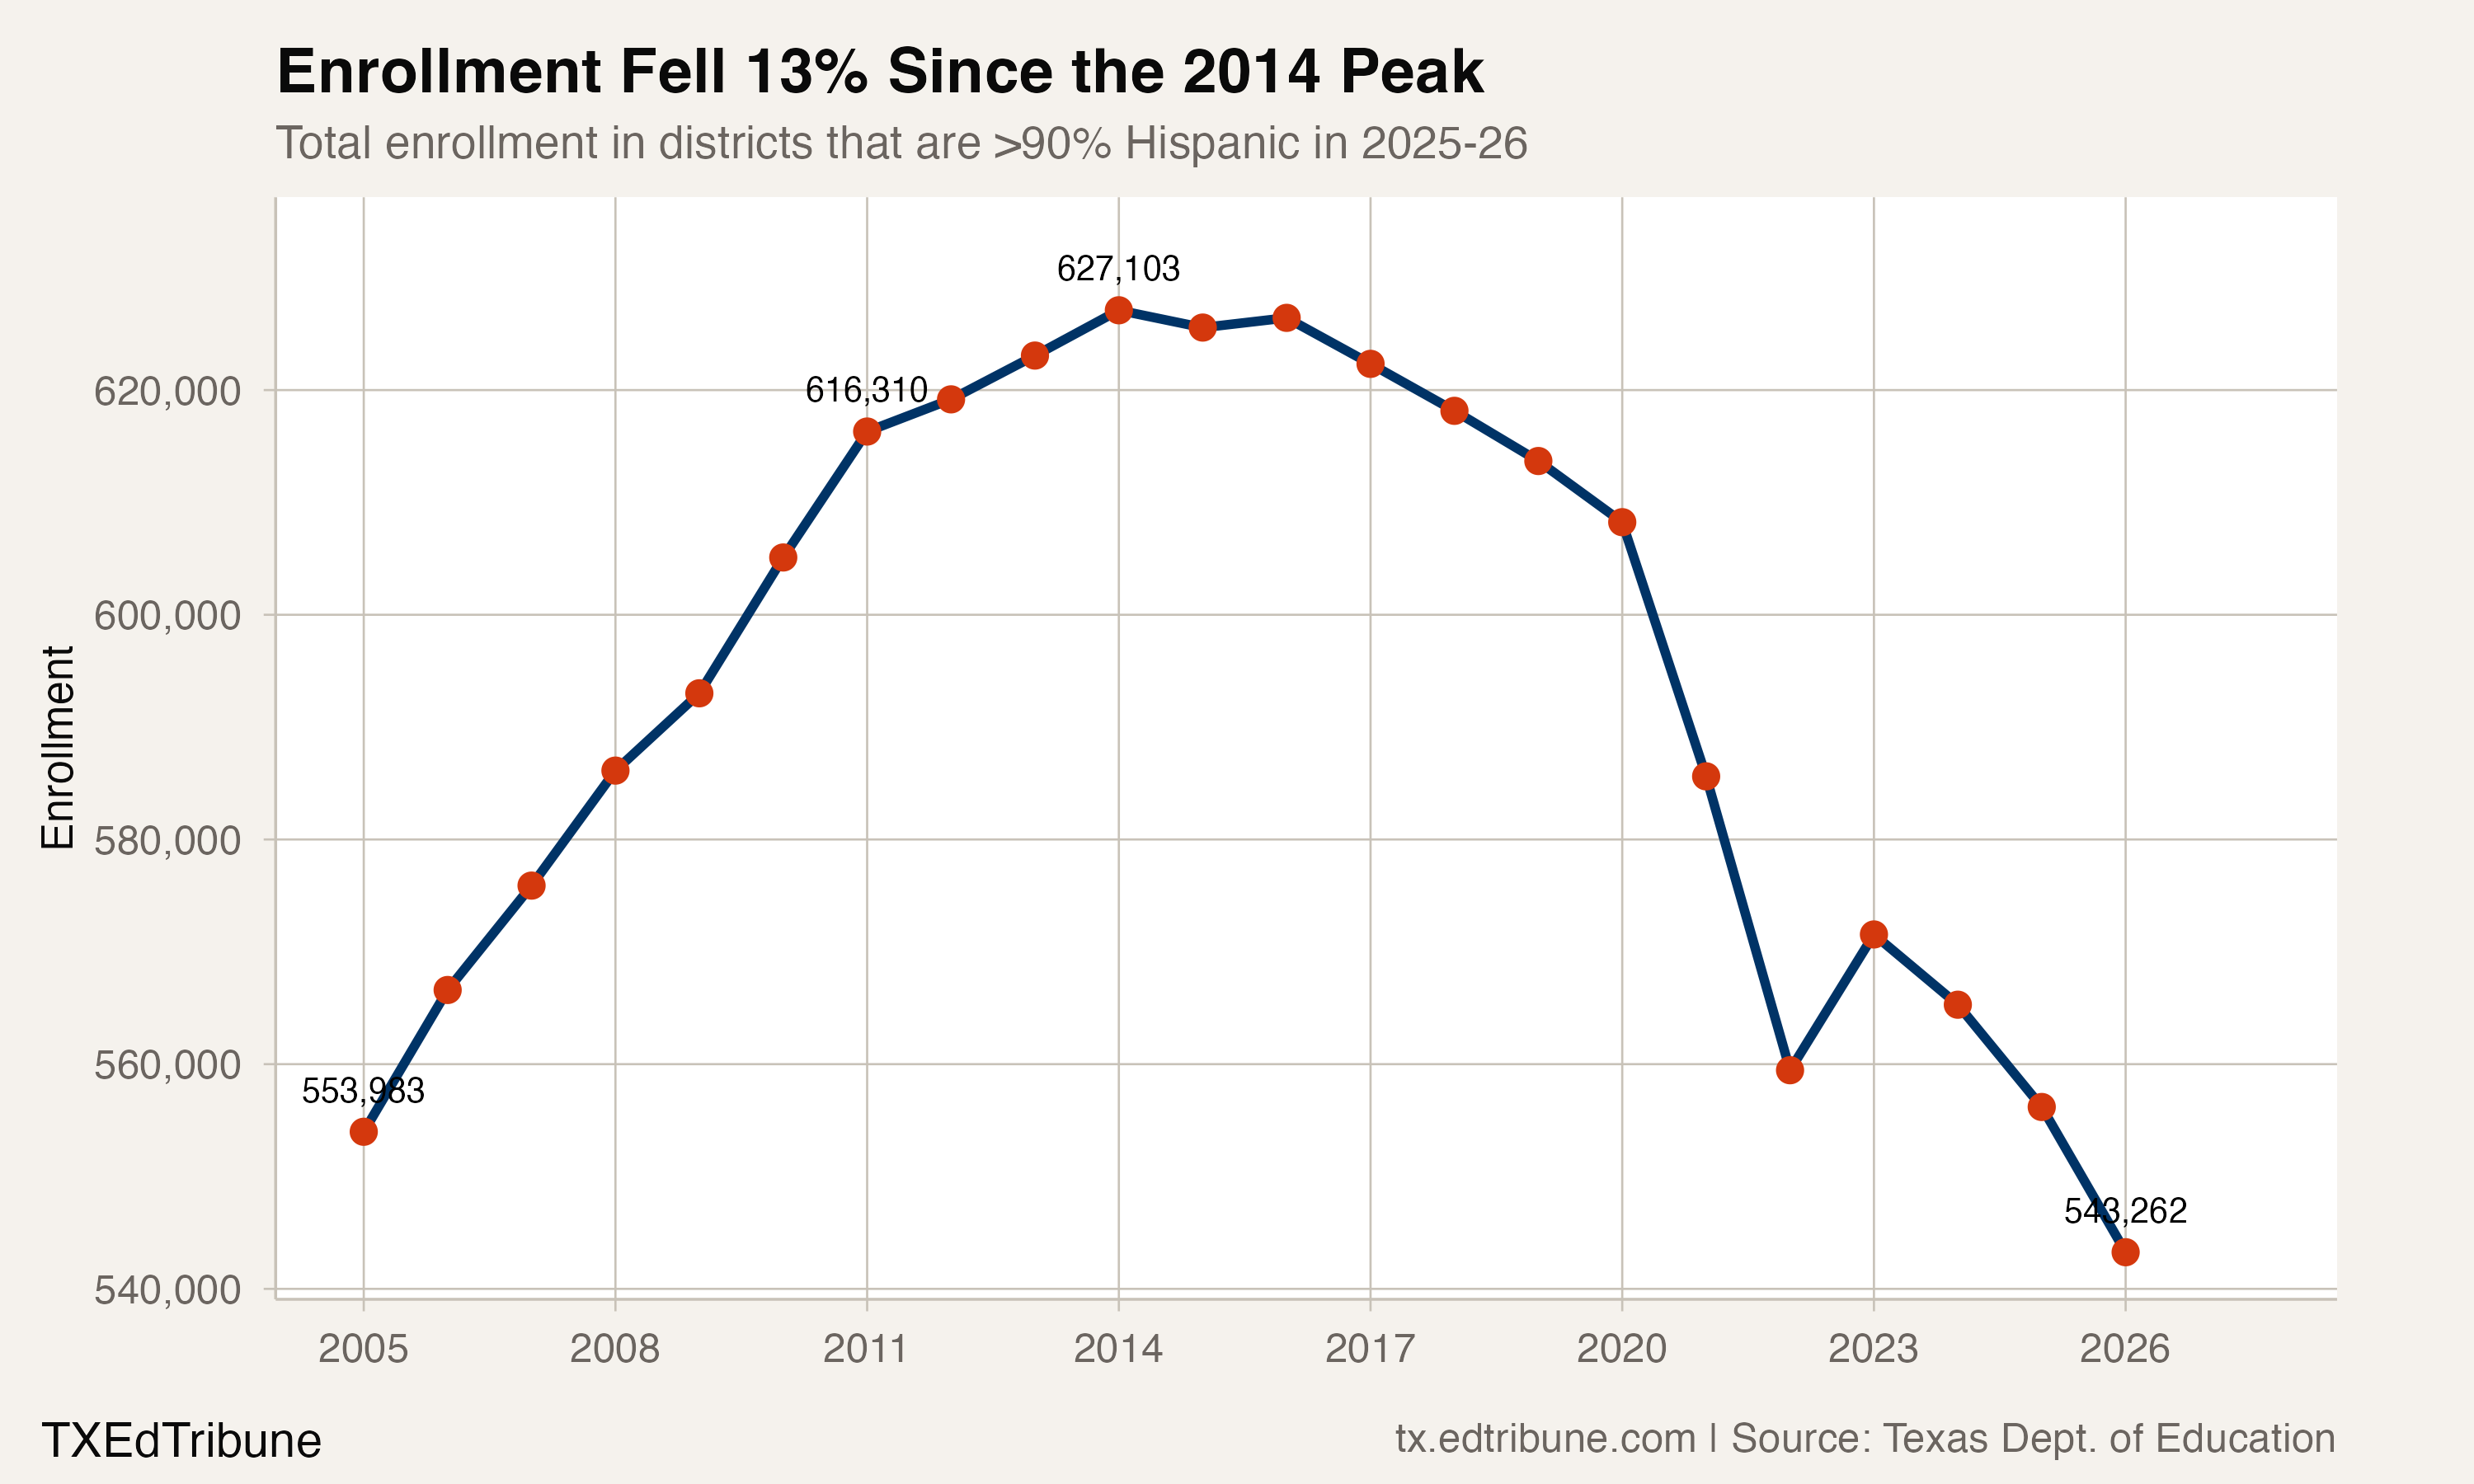
These 94 districts have lost 83,841 students since their collective peak in 2014, a 13.4% decline. The rest of Texas grew by 9.6% over the same period.
The 90% line
Ninety-four Texas districts enrolled student bodies that were more than 90% Hispanic in the 2025-26 school year. Fifty-five exceeded 95%. Twenty-two exceeded 98%. The concentration is not a recent development. Texas has maintained roughly 100 districts above the 90% threshold since 2011, when 95 qualified. The number peaked at 106 in 2015, held steady through the late 2010s, then dropped to 94 in 2026, the lowest count since 2008.
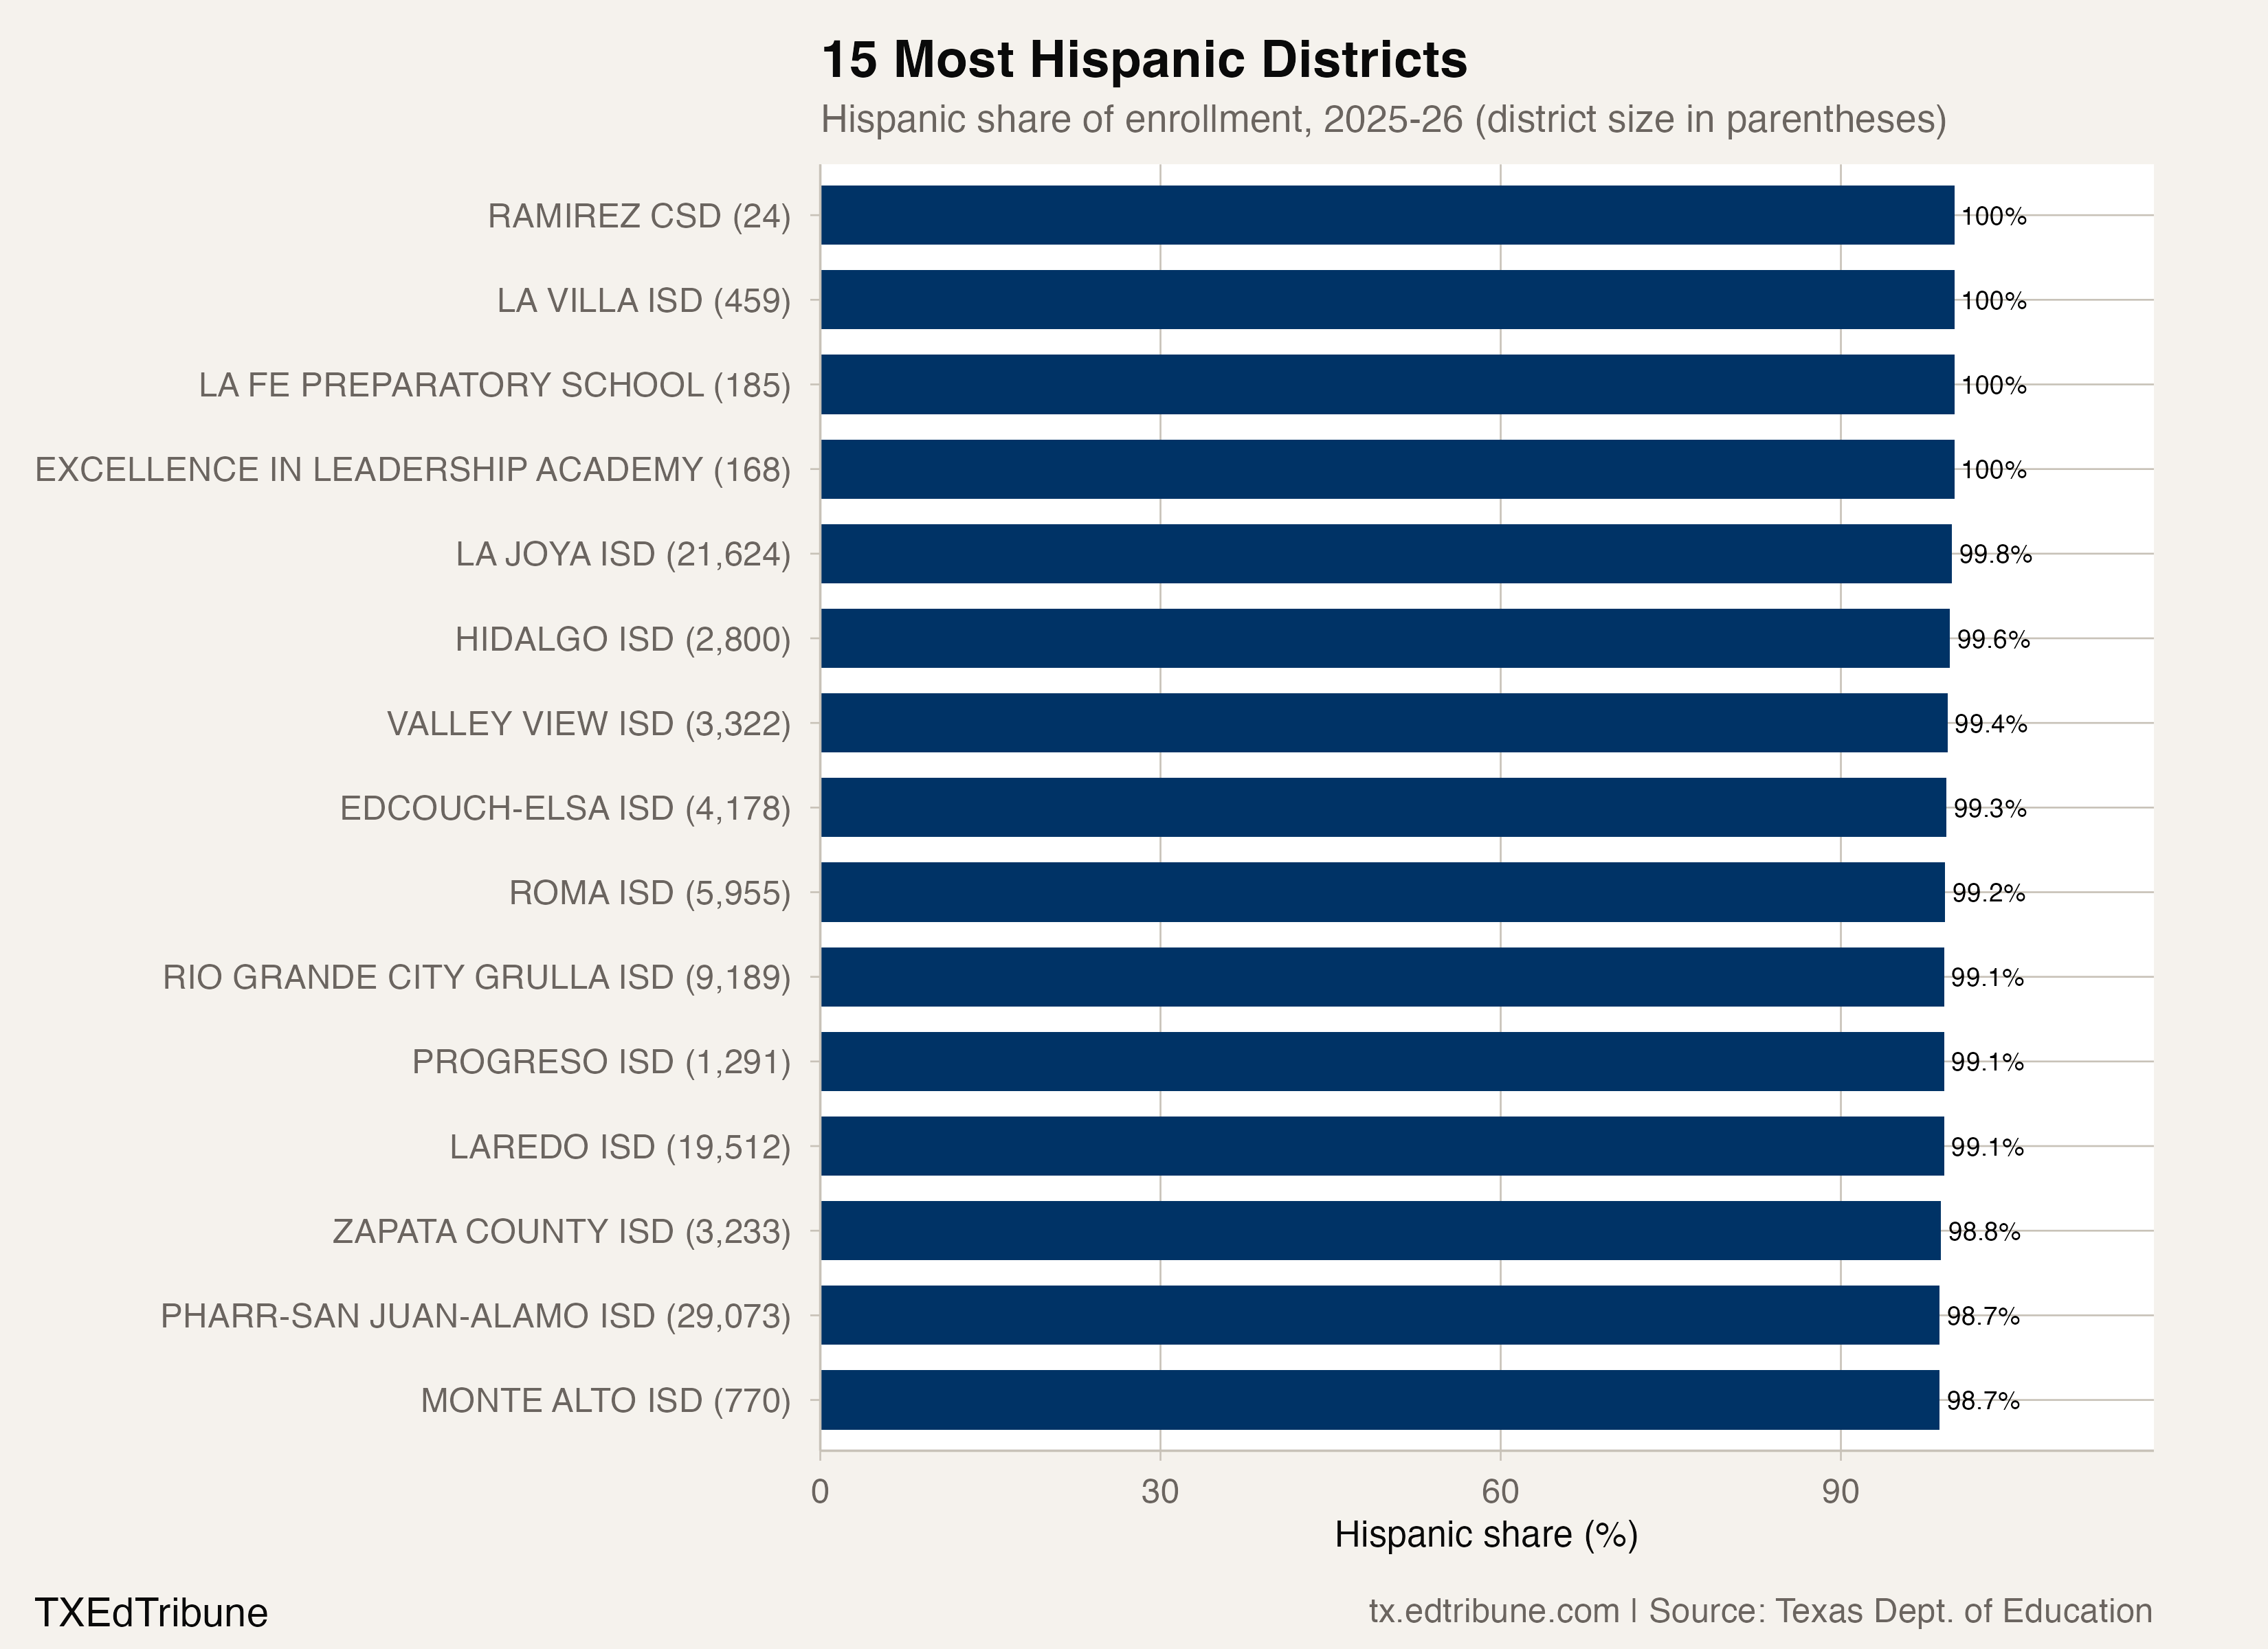
The largest of these districts are not small rural outposts. Socorro ISD↗ET in El Paso County enrolls 45,906 students at 90.2% Hispanic. United ISD↗ET in Laredo serves 39,844 at 98.0%. Brownsville ISD↗ET, the Rio Grande Valley's largest traditional district, enrolls 34,344 at 98.1%. Pharr-San Juan-Alamo ISD↗ET serves 29,073 at 98.7%. These are midsized urban systems, not one-building schoolhouses.
Fifty-four of the 94 districts sit in border counties, from El Paso to Cameron. They account for 462,217 students. The remaining 40 districts, serving 81,045 students, are scattered across interior Texas: the south side of San Antonio (where Harlandale ISD↗ET is 97.1% Hispanic and Edgewood ISD↗ET is 96.1%), the meatpacking corridor around Hereford (91.8%), and the oil patch near Pecos (90.4%).
Emptying out
The enrollment story in these districts is unambiguous: a long decline with only two interruptions.
The 94 districts collectively peaked at 627,103 students in 2014. They have declined every year since except for a brief bump in 2016 and a partial rebound in 2023. By 2026, enrollment stood at 543,262, a loss of 83,841 students, or 13.4%. Over the same 12 years, the rest of Texas added 431,265 students.
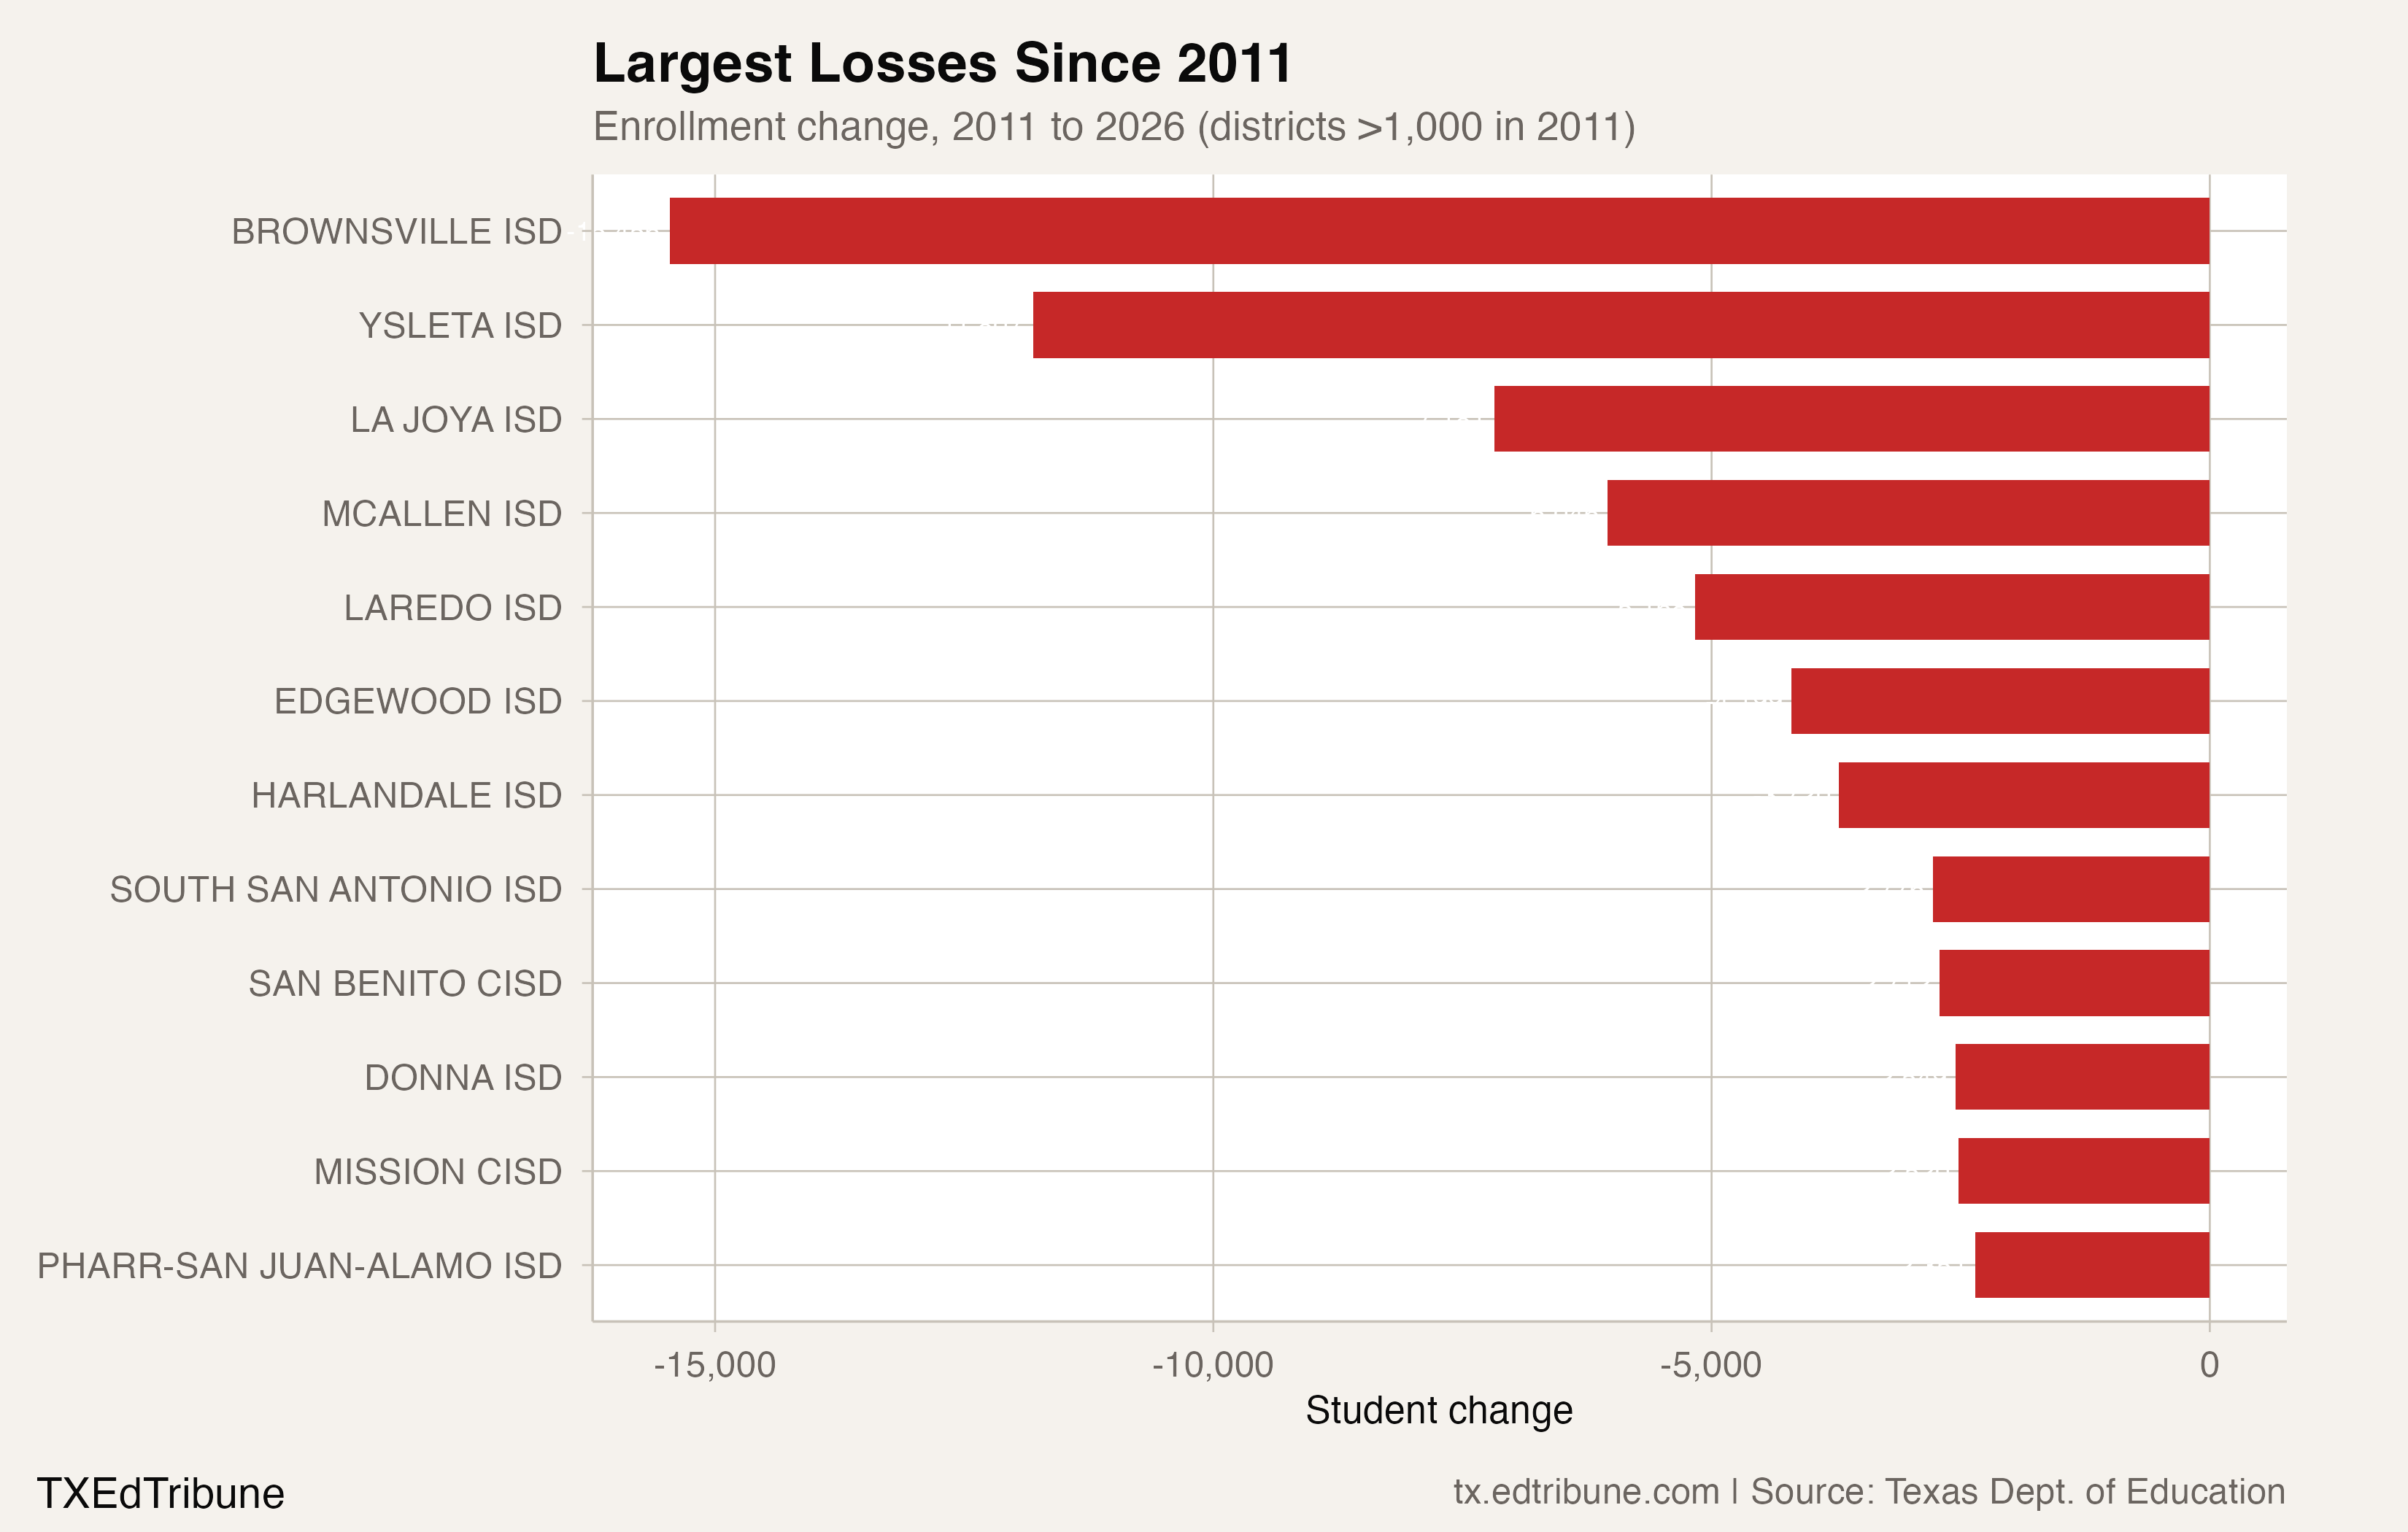
Brownsville ISD↗ET has lost 15,456 students since 2011, a 31.0% decline, the largest absolute loss among the 94 districts. Ysleta ISD↗ET in El Paso lost 11,807 (26.6%). La Joya ISD↗ET lost 7,181 (24.9%). McAllen ISD↗ET lost 6,046 (23.7%). Laredo ISD↗ET lost 5,168 (20.9%).
Of the 92 districts with at least 10 years of enrollment history, 37 are at their all-time low in 2026, a 40.2% rate. Several small districts have contracted by nearly half: Tornillo ISD in El Paso County has shrunk 47.6% from its 2012 peak, and Webb CISD near Laredo has lost 47.8% from its 2006 peak.
Birth rates and outmigration
Suggestive context points first to demographics: fewer children are being born in major border communities, and some families are leaving.
El Paso County recorded 10,792 births in 2024, the second consecutive year below 11,000. That level had not been seen since the 1970s, when the county had half its current population. Births have fallen 20% since 2014, and El Paso Matters projected that children born in 2024 would translate into more than 8,600 fewer students in grades 1-5 by 2030.
El Paso County also lost more than 12,000 residents to net domestic outmigration between 2020 and 2023. El Paso Matters reported that private sector wages in the region run 40% below state and national averages, another piece of suggestive context for why young families may leave the region.
The Rio Grande Valley faces similar pressures. As KRGV reported, Brownsville's assistant superintendent Alma Cardenas-Rubio noted that "a lot of the students are leaving with their parents to higher paying jobs up in the Valley, such as the San Antonio area." Birth rates are dropping statewide. Texas's birth rate decline has outpaced the national average, and the state demographer estimates a loss of more than 40,000 four-year-olds between 2020 and 2025.
The IDEA factor
Birth rates and outmigration do not account for all of the loss. A competing explanation is charter competition, concentrated in a single network that overlaps with the same communities.
IDEA Public Schools↗ET, a charter network that says it began in 2000, enrolled 6,855 students in 2011. By 2026, it served 79,608, an increase of 1,061%. IDEA was 85.2% Hispanic in 2026. Its growth overlaps with the same border corridor families whose traditional districts are contracting.
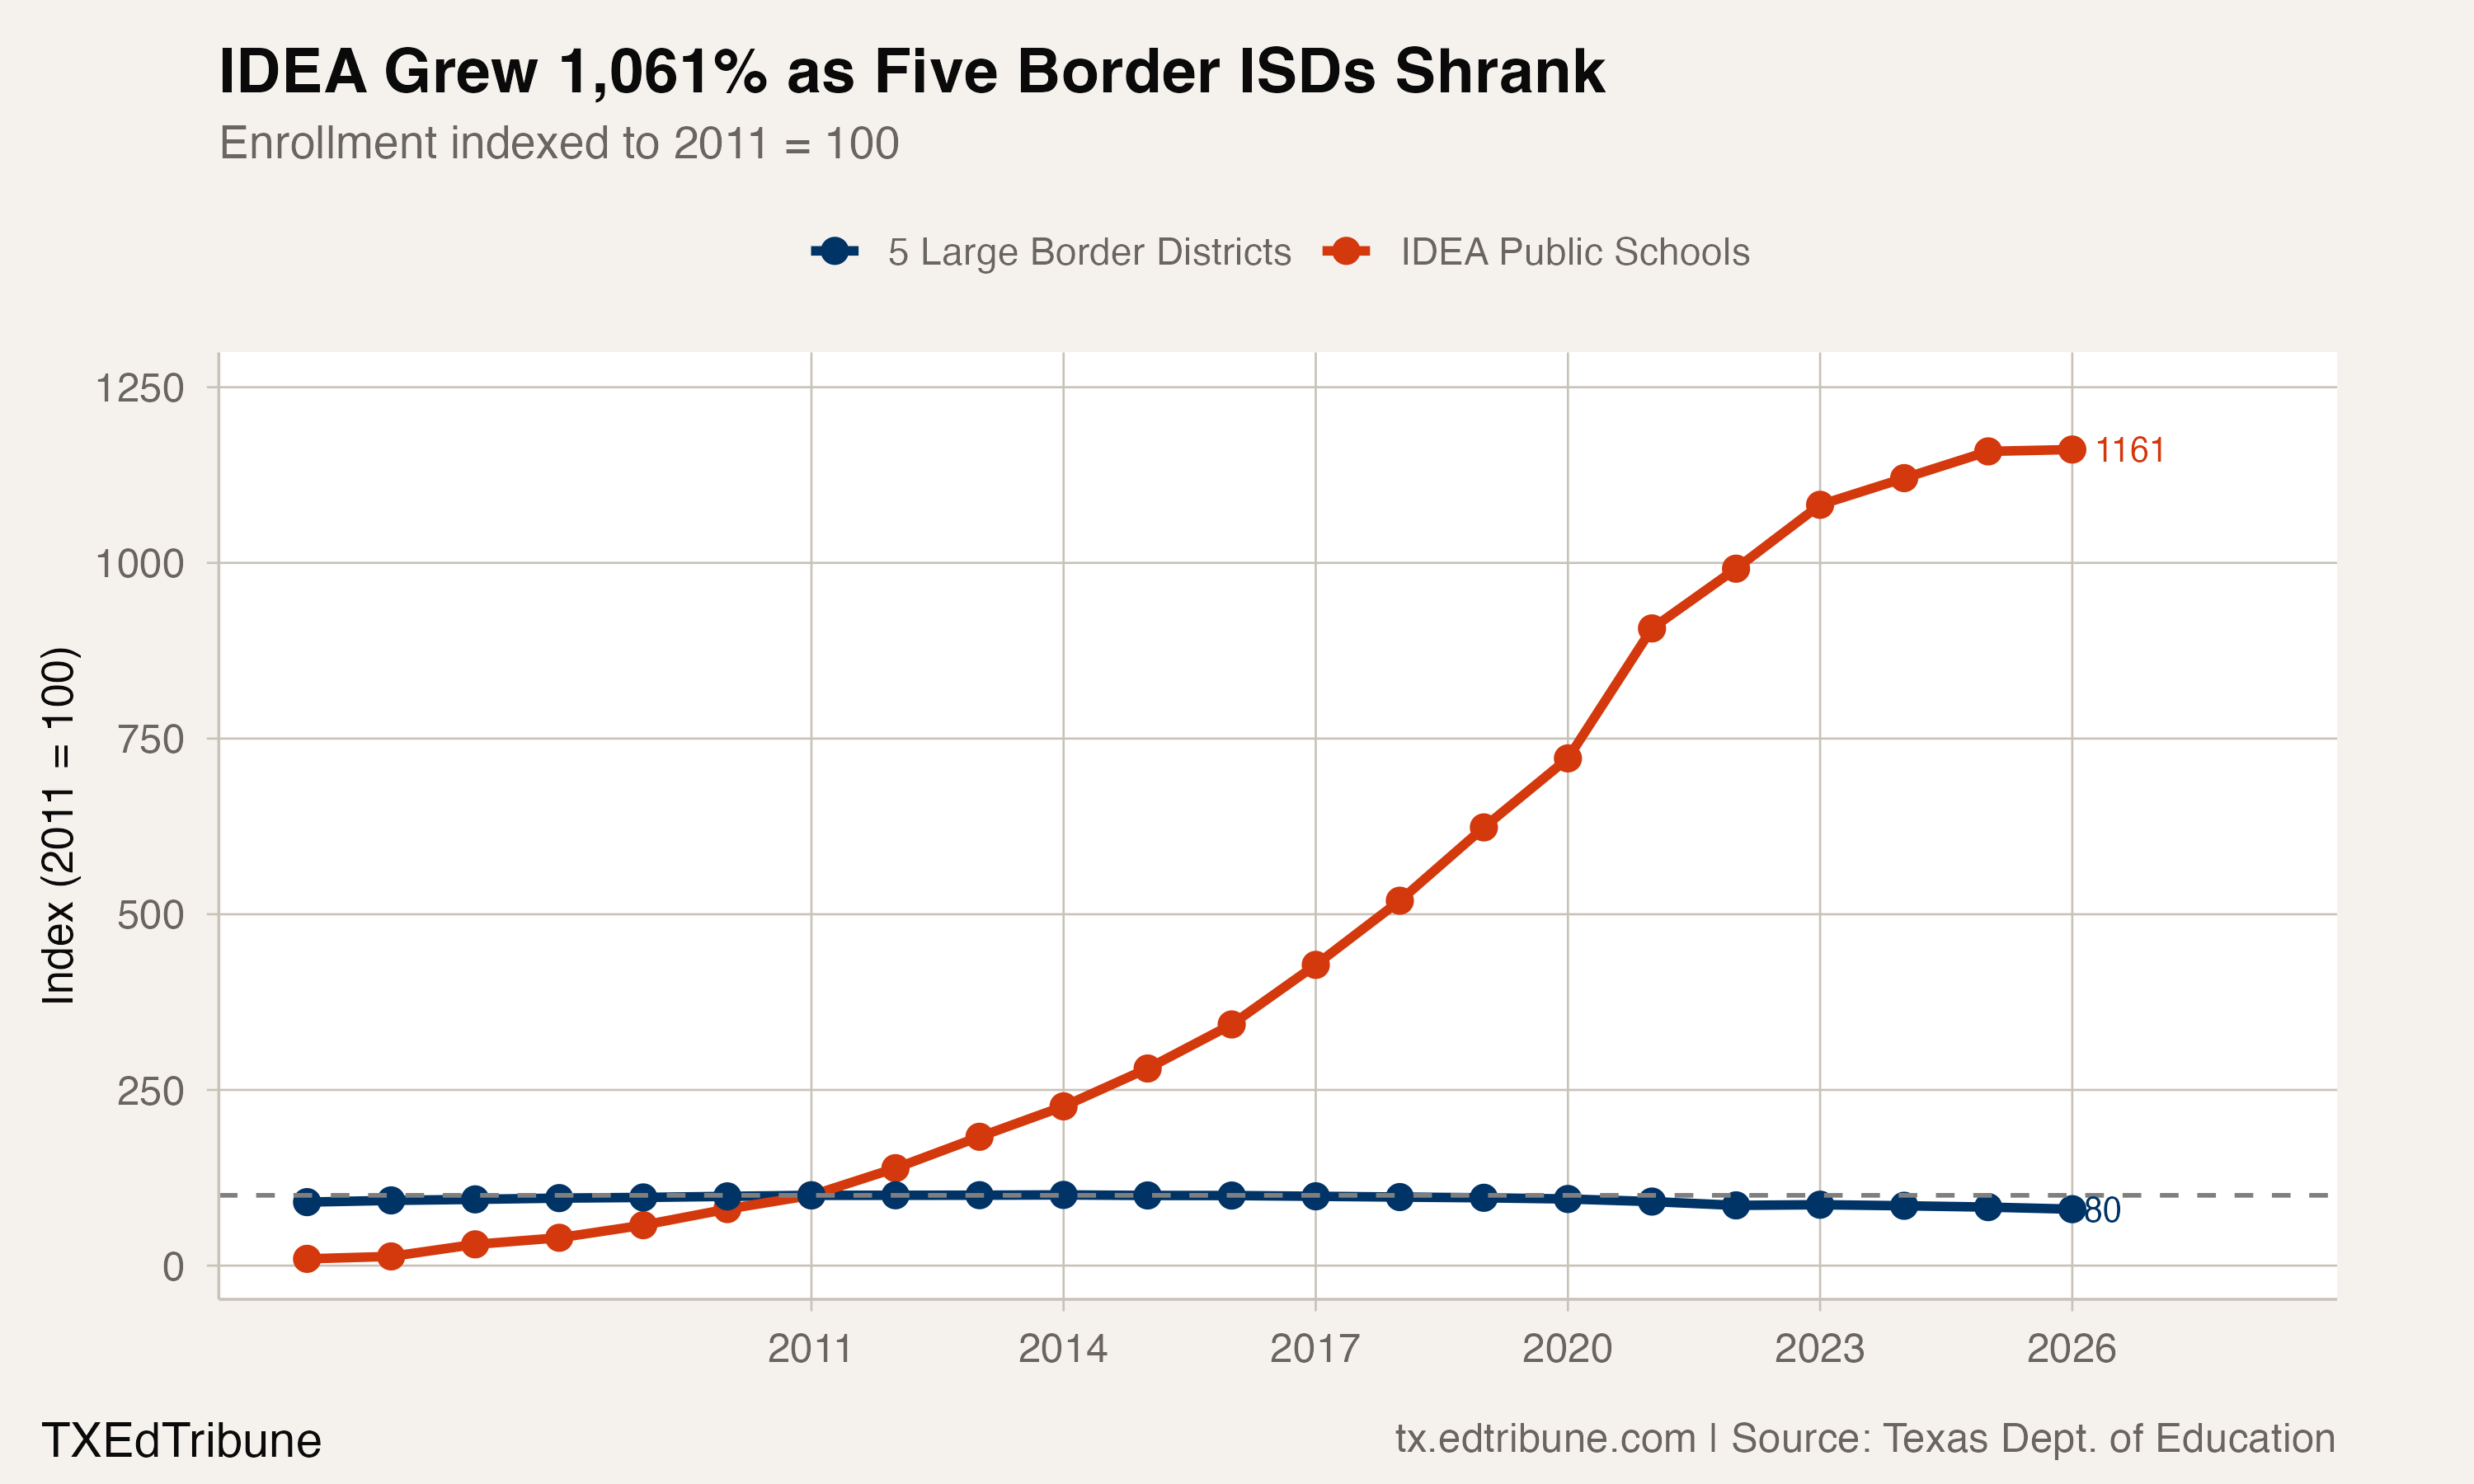
Five large traditional border districts in the dataset, Brownsville, Ysleta, La Joya, United, and PSJA, enrolled a combined 196,205 students in 2011. By 2026, that figure had fallen to 157,546, a loss of 38,659 students, or 19.7%. Over the same period, IDEA added 72,753 students. The traditional districts' losses do not fully explain IDEA's growth because IDEA's districtwide total includes campuses beyond the Rio Grande Valley. But in the Valley, KRGV reported direct overlap with nearby charter schools.
"For five of those school districts, the majority of the students are not leaving the Valley. Instead, thousands are showing up on the rosters of nearby charter schools, IDEA Public Schools." — KRGV, Sept. 2018
Santa Rosa ISD's superintendent, Heriberto Villarreal, told KRGV that each lost student costs the district roughly $70,000 in funding over the course of a K-12 career, enough to represent a staffing position. Donna ISD faced roughly $6 million in lost state revenue from enrollment decline and implemented 15% cuts to non-discretionary spending.
The linguistic dimension
Direct evidence from the state package shows an operational consequence of the demographic concentration: high rates of English learner enrollment.
In 2025, the most recent year with non-missing LEP data available, 35 of the 93 districts with reported rates had English learner rates above 40%. The median rate was 31.8%. Roma ISD in Starr County reported 81.6% of its students classified as English learners. Rio Grande City Grulla ISD was at 72.8%. La Fe Preparatory School in El Paso registered 89.7%.
These rates shape everything from staffing models to instructional materials to state accountability outcomes. A district where four in five students are learning English as a second language requires a fundamentally different teaching workforce than a district with few English learners. The Texas Education Agency lists Bilingual/English as a Second Language as a critical teacher shortage area, which is suggestive context for the staffing pressure in high-LEP districts.
Fewer districts at the threshold
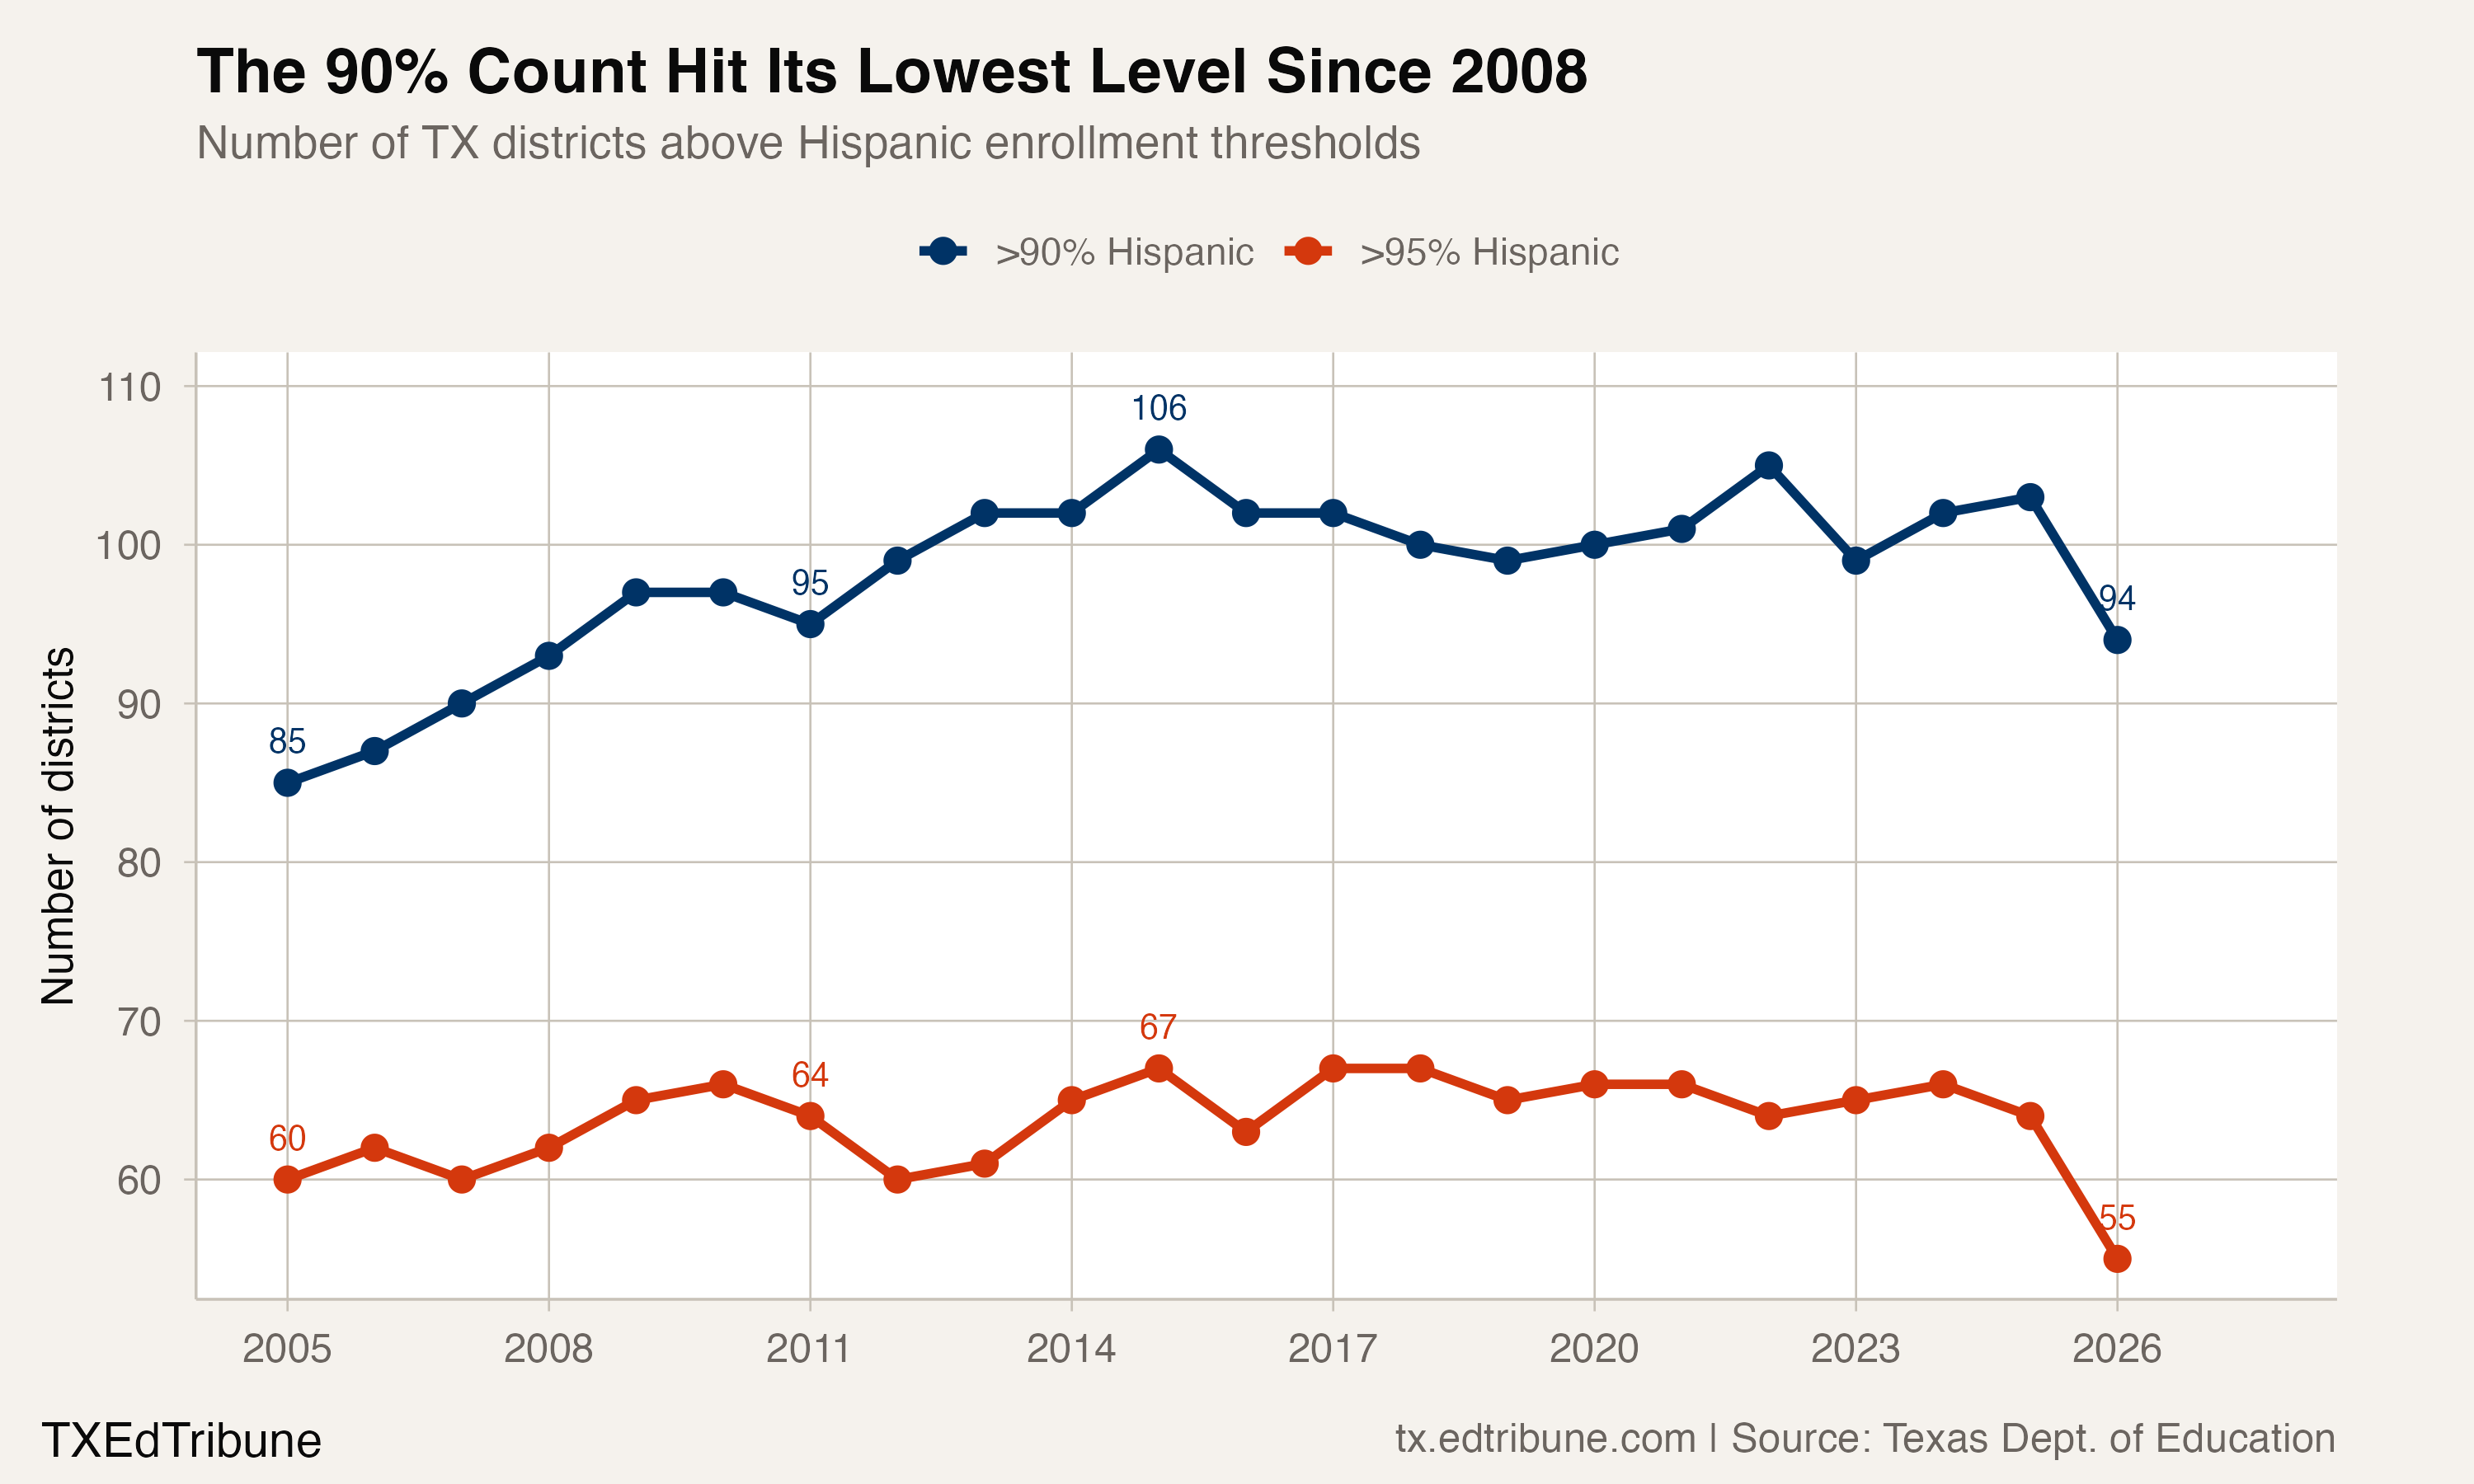
The drop from 106 districts above 90% Hispanic in 2015 to 94 in 2026 is not evidence of a statewide Hispanic-enrollment decline. Statewide, Hispanic students make up 53.0% of Texas enrollment, up from 52.0% in 2015. The threshold count is falling even as the statewide Hispanic share is rising.
The deeper concentration, districts above 95%, tells the same story: 67 in 2015, 55 in 2026. The core of the border corridor remains highly concentrated, even as fewer districts cross the 90% and 95% thresholds.
What the corridor faces next
The 94 districts that are more than 90% Hispanic in 2026 collectively enroll 9.9% of Texas students, down from 12.0% in 2015. Their share of the state's enrollment is shrinking not because Hispanic enrollment is declining statewide, but because this district cohort is losing enrollment while the rest of Texas grows. El Paso Matters' birth projections estimate the region could need 22 fewer elementary schools by 2030, and the pipeline pressure is only beginning to reach middle and high schools.
The question facing these communities is whether declining enrollment is a temporary artifact of the post-pandemic period or the front edge of a structural contraction. The birth data is suggestive context for the latter. Eagle Pass ISD↗ET in Maverick County, 13,450 students and 97.3% Hispanic, has declined 8.7% since 2011. Smaller districts such as Tornillo ISD and Webb CISD have already lost nearly half their students from their package-history peaks.
Detailed code that reproduces the analysis and figures in this article is available exclusively to EdTribune subscribers.
Discussion
Sign in to join the discussion.
Loading comments...