Correction: This article was updated to correct its statewide interpretation, reconcile its figures with the current Texas data panel, and remove mechanisms the published record could not support.
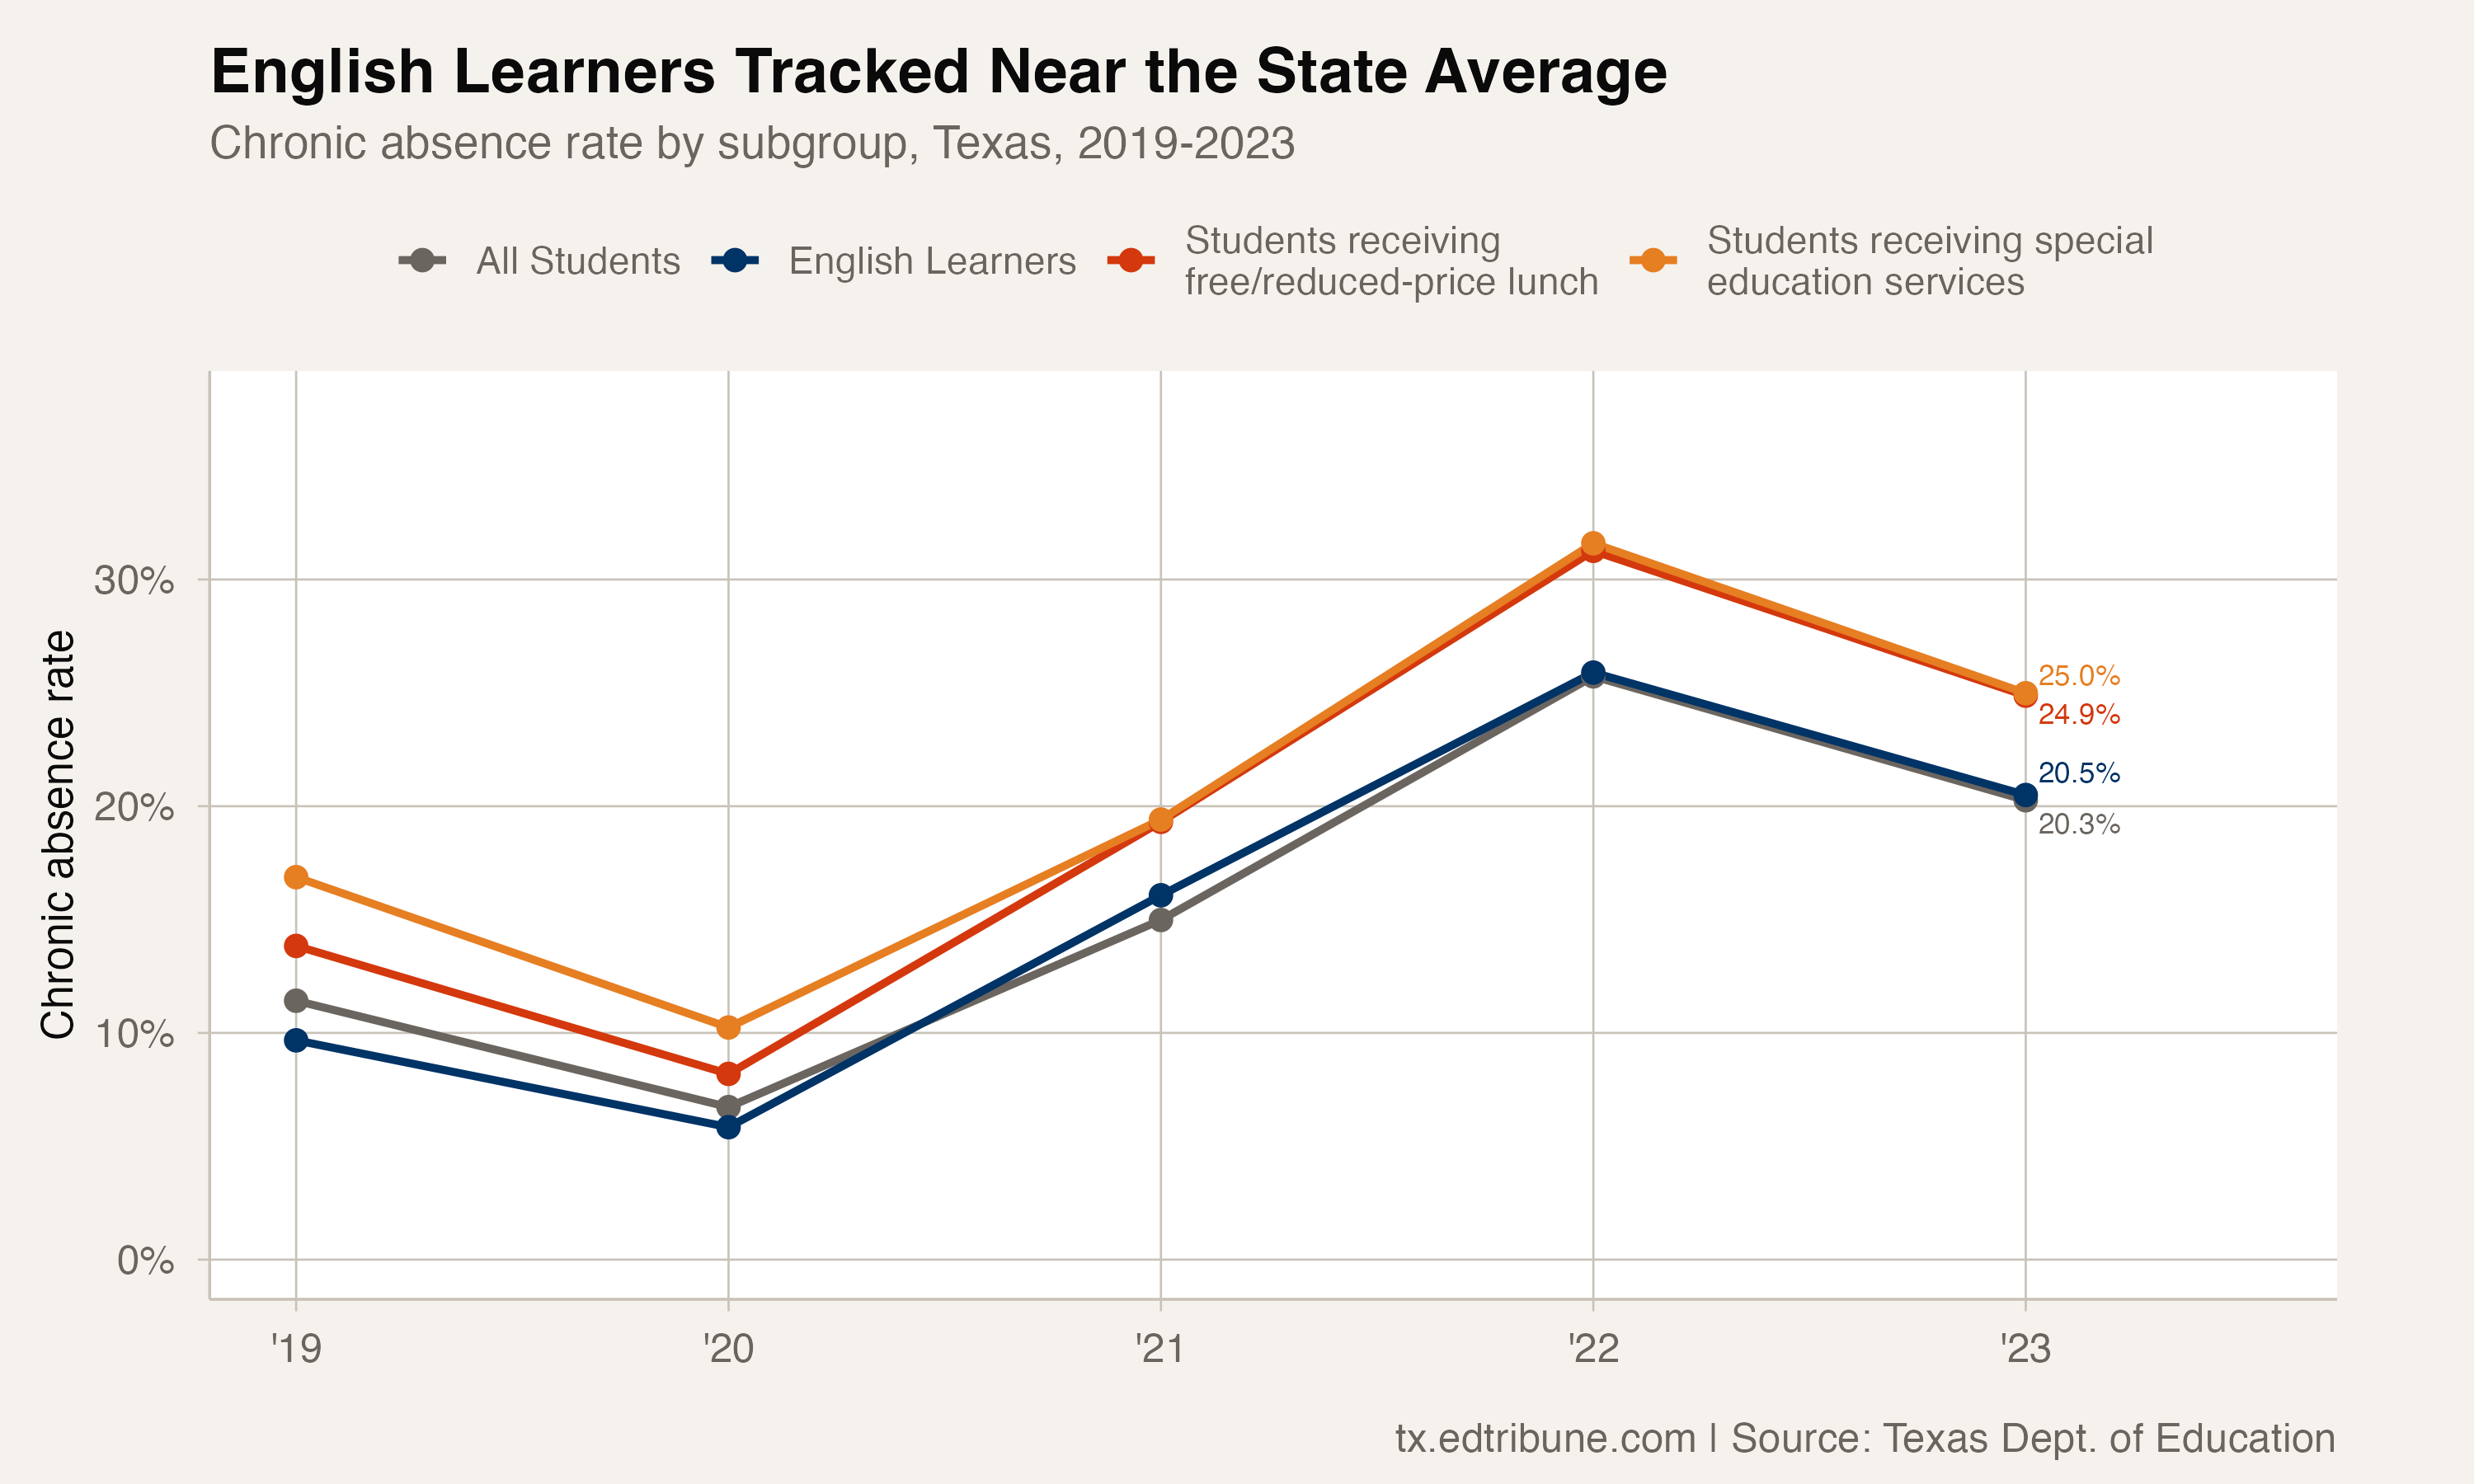
Texas English learners were not below the statewide chronic-absence rate in every recent release. In 2023, the English learner rate was 20.5%, just above the 20.3% rate for all students.
The five-release comparison shows a split pattern: English learners were below the statewide rate in 2019 and 2020, then slightly above it in 2021, 2022 and 2023. The data describes the difference; it does not establish why the gap changed.
The gap changed direction
| Release year | English learners | All students | EL minus all |
|---|---|---|---|
| 2018-19 | 9.7% | 11.4% | -1.7 pp |
| 2019-20 | 5.8% | 6.7% | -0.9 pp |
| 2020-21 | 16.1% | 15.0% | +1.1 pp |
| 2021-22 | 25.9% | 25.7% | +0.2 pp |
| 2022-23 | 20.5% | 20.3% | +0.2 pp |
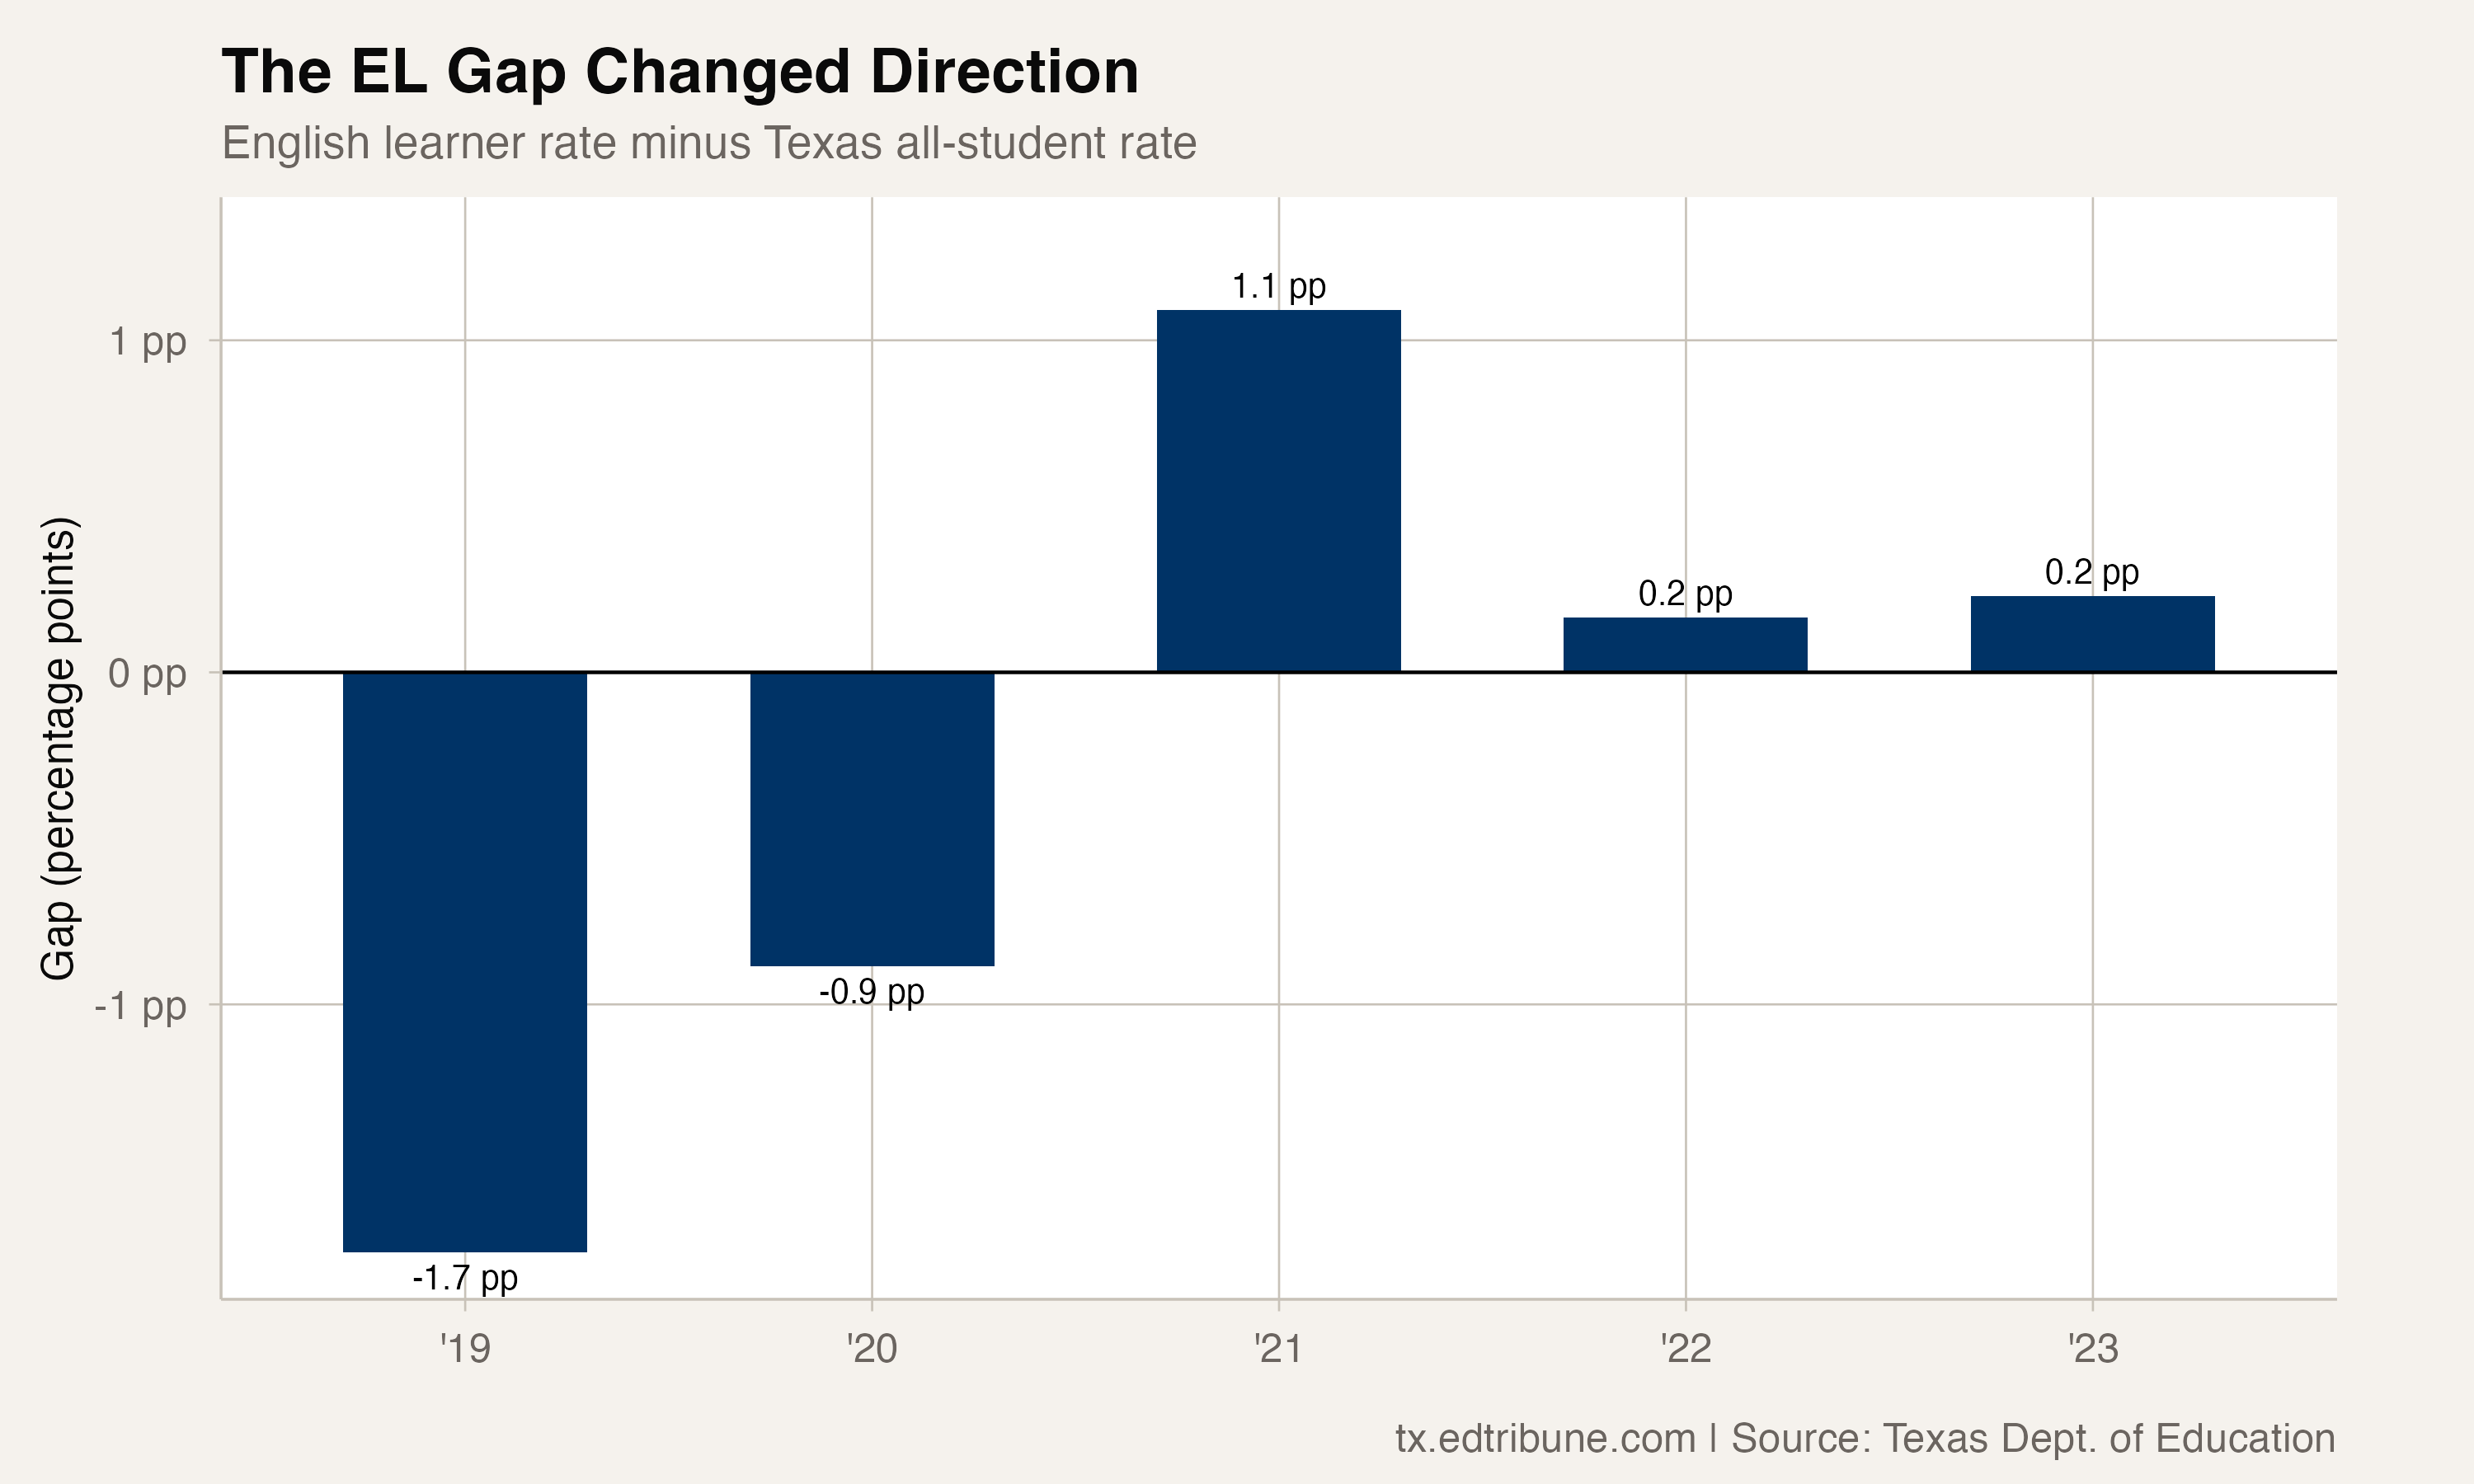
The statewide all-student rate reached 25.7% in 2022, the highest point in the 2019-to-2023 panel. English learners were at 25.9% that year. By 2023, both rates had fallen, with the English learner rate remaining 0.2 points higher.
Most districts had a lower EL rate in 2023
The statewide comparison and the district comparison point in different directions. Among 1,048 Texas districts with both published rates in 2023, 757 — 72.2% — had an English learner chronic-absence rate below their own all-student rate.
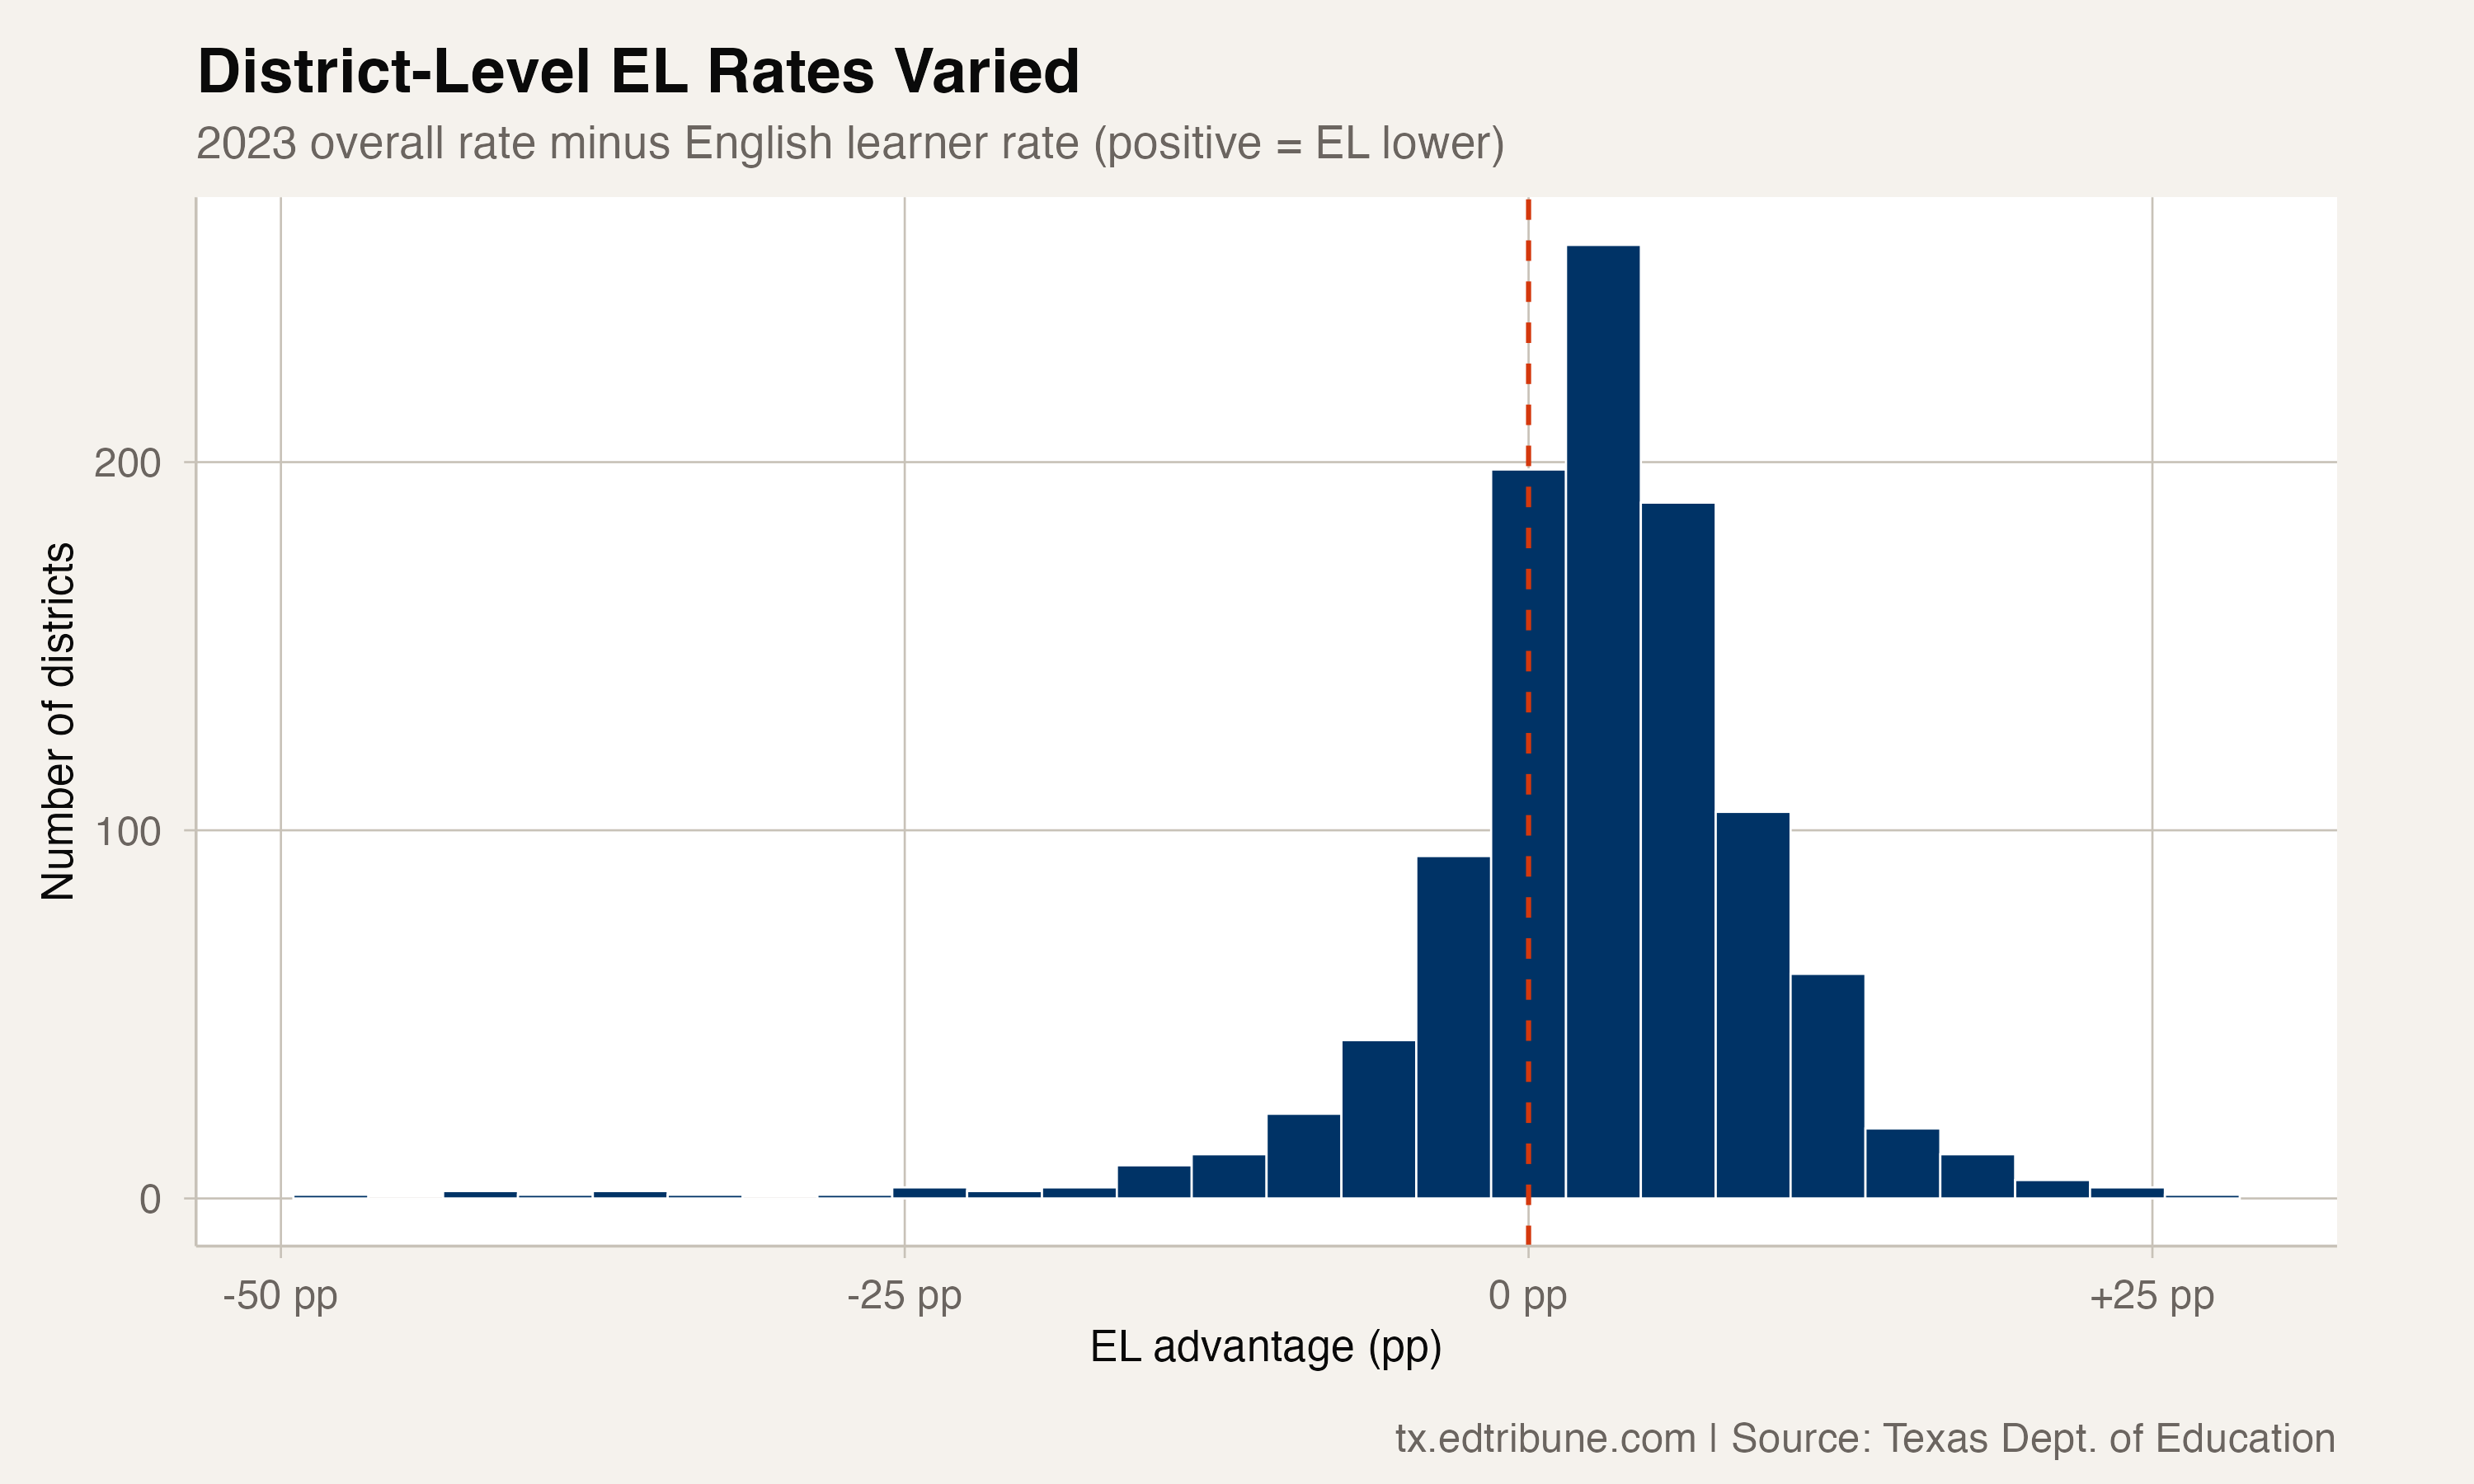
This district calculation uses only rows with both rates published. It does not treat missing subgroup values as zero or use the surviving rows to estimate a statewide share.
The 2023 subgroup comparison
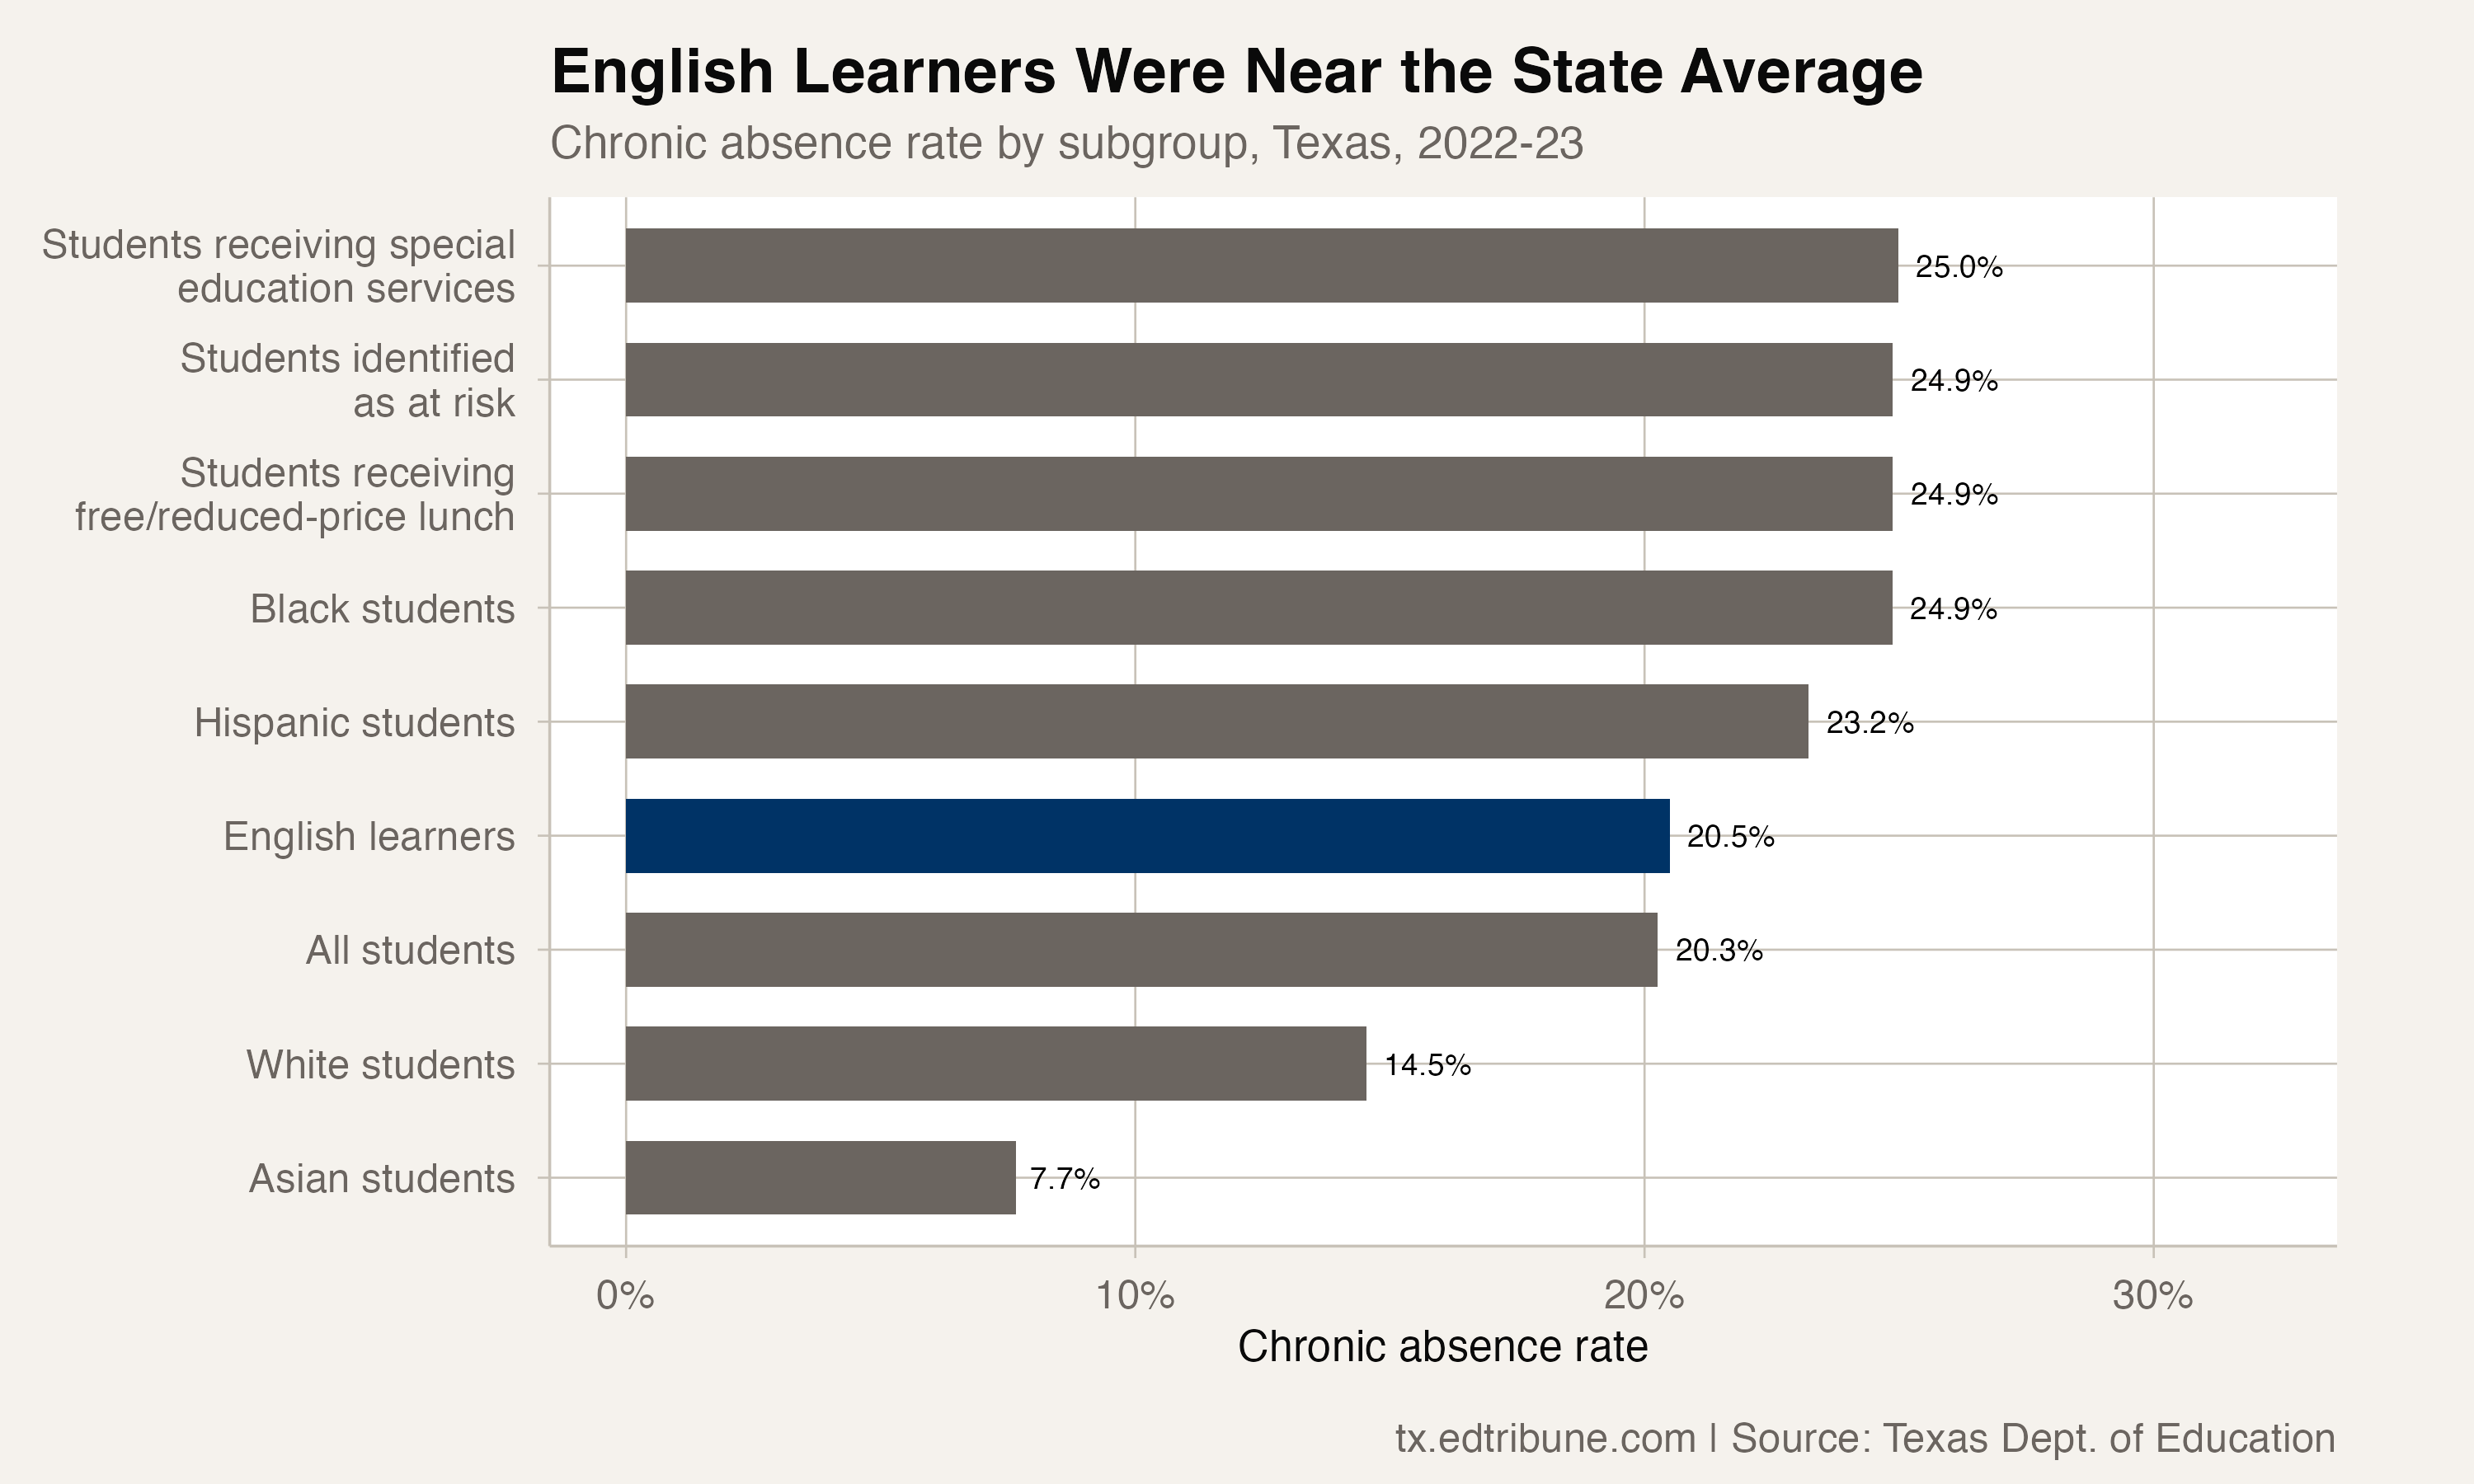
In the 2023 statewide subgroup rows, the English learner rate was 20.5%. The rates were 25.0% for students receiving special education services, 23.2% for Hispanic students, 14.5% for White students and 7.7% for Asian students. These comparisons describe rates, not causes or student-level explanations.
The statewide average and the district pattern therefore diverged: English learners were slightly above all students statewide, while most districts with both published rates showed the opposite ordering.
The rates in this article come from the Texas Education Agency attendance panel. The Texas Education Agency publishes its accountability and student-data reports.
Detailed code that reproduces the analysis and figures in this article is available exclusively to EdTribune subscribers.
Discussion
Sign in to join the discussion.
Loading comments...