The arithmetic mean of published chronic-absence rates among Texas charter districts was 24.4% in 2023. The corresponding mean among traditional districts was 16.0%. The charter mean was 52.4% higher, a difference of 8.4 percentage points.
Direct evidence: These are means of published district rates, not student-weighted sector rates. The installed package's shipped, checksum-bound TEA TAPR absence snapshots cover the 2019-2023 selectors and are read through fetch_absence_multi(use_cache=TRUE) from official Texas Education Agency rows.
The sector gap was 4.5 points in 2019, narrowed slightly to 4.2 points in 2020, then widened to 7.0 points in 2022 and 8.4 points in 2023. Both sector means peaked in 2022 before falling in 2023.
Two sectors, different levels
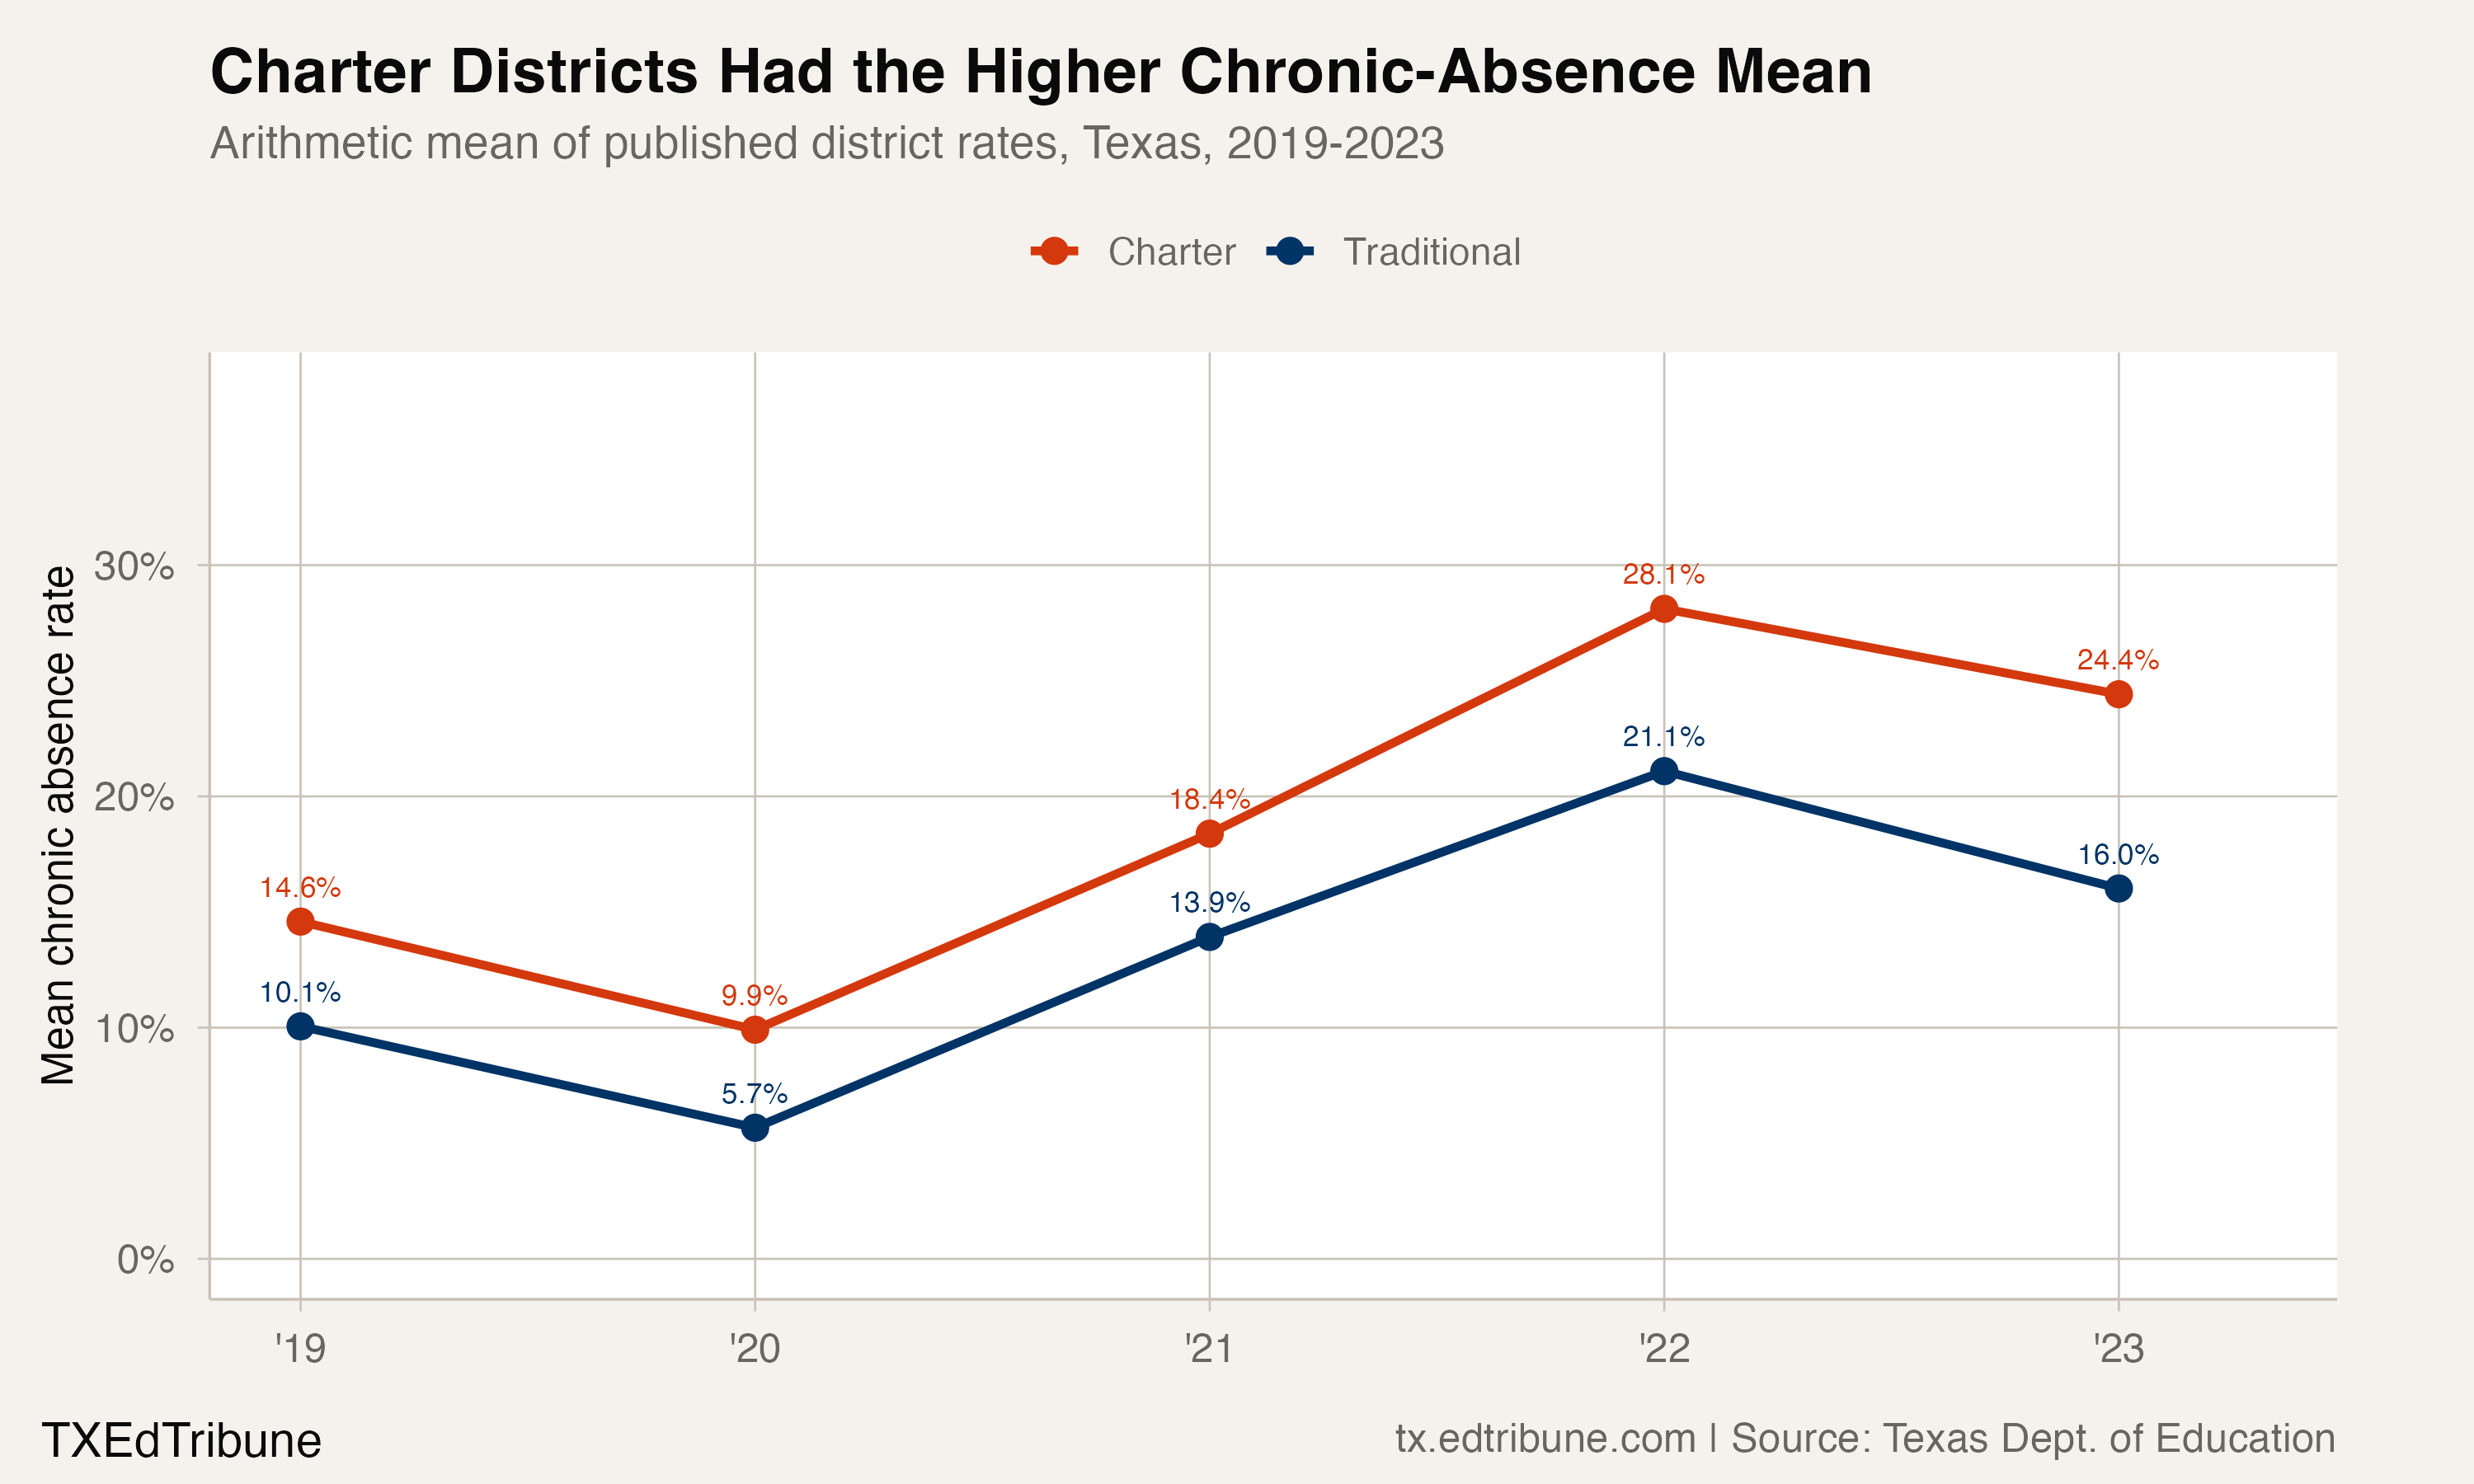
The charter mean rose from 14.6% in 2019 to 28.1% in 2022, then fell 3.7 points to 24.4% in 2023. The traditional-district mean rose from 10.1% to 21.1% over the same period, then fell 5.1 points to 16.0%.
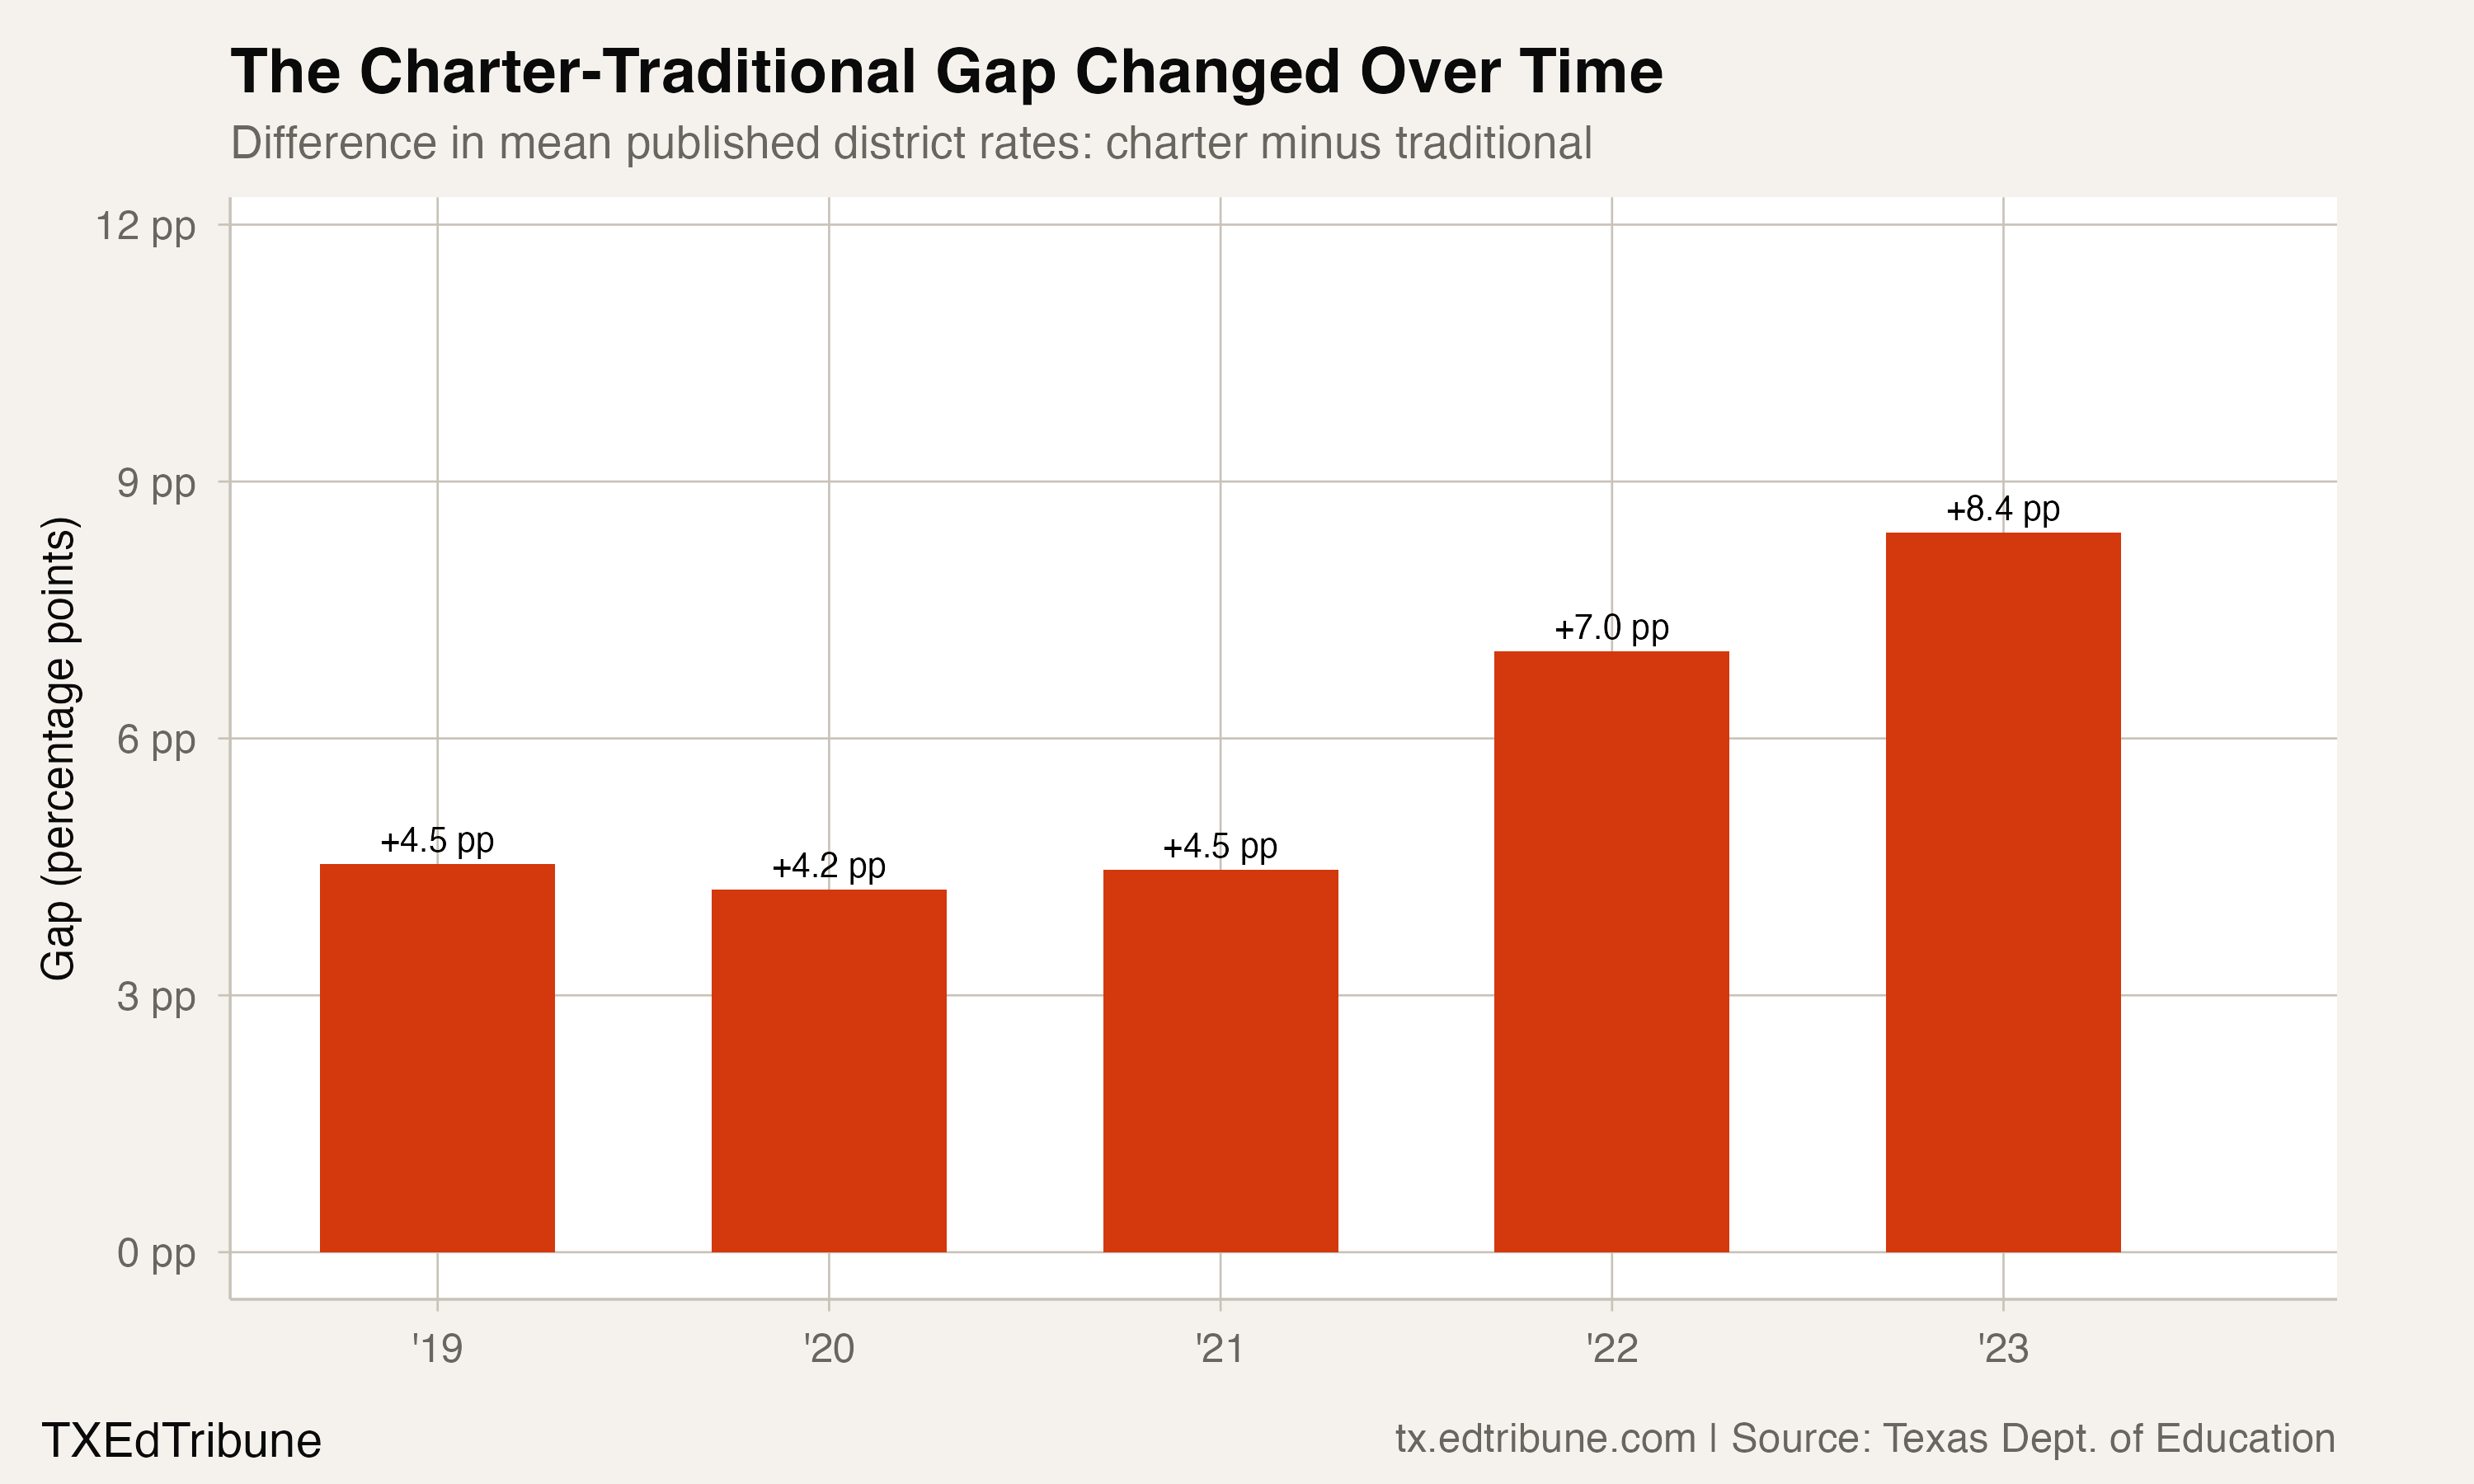
The 2023 gap was larger than the 2019 gap. That comparison describes the published district-rate means; it does not identify why the rates differ.
A wide charter distribution
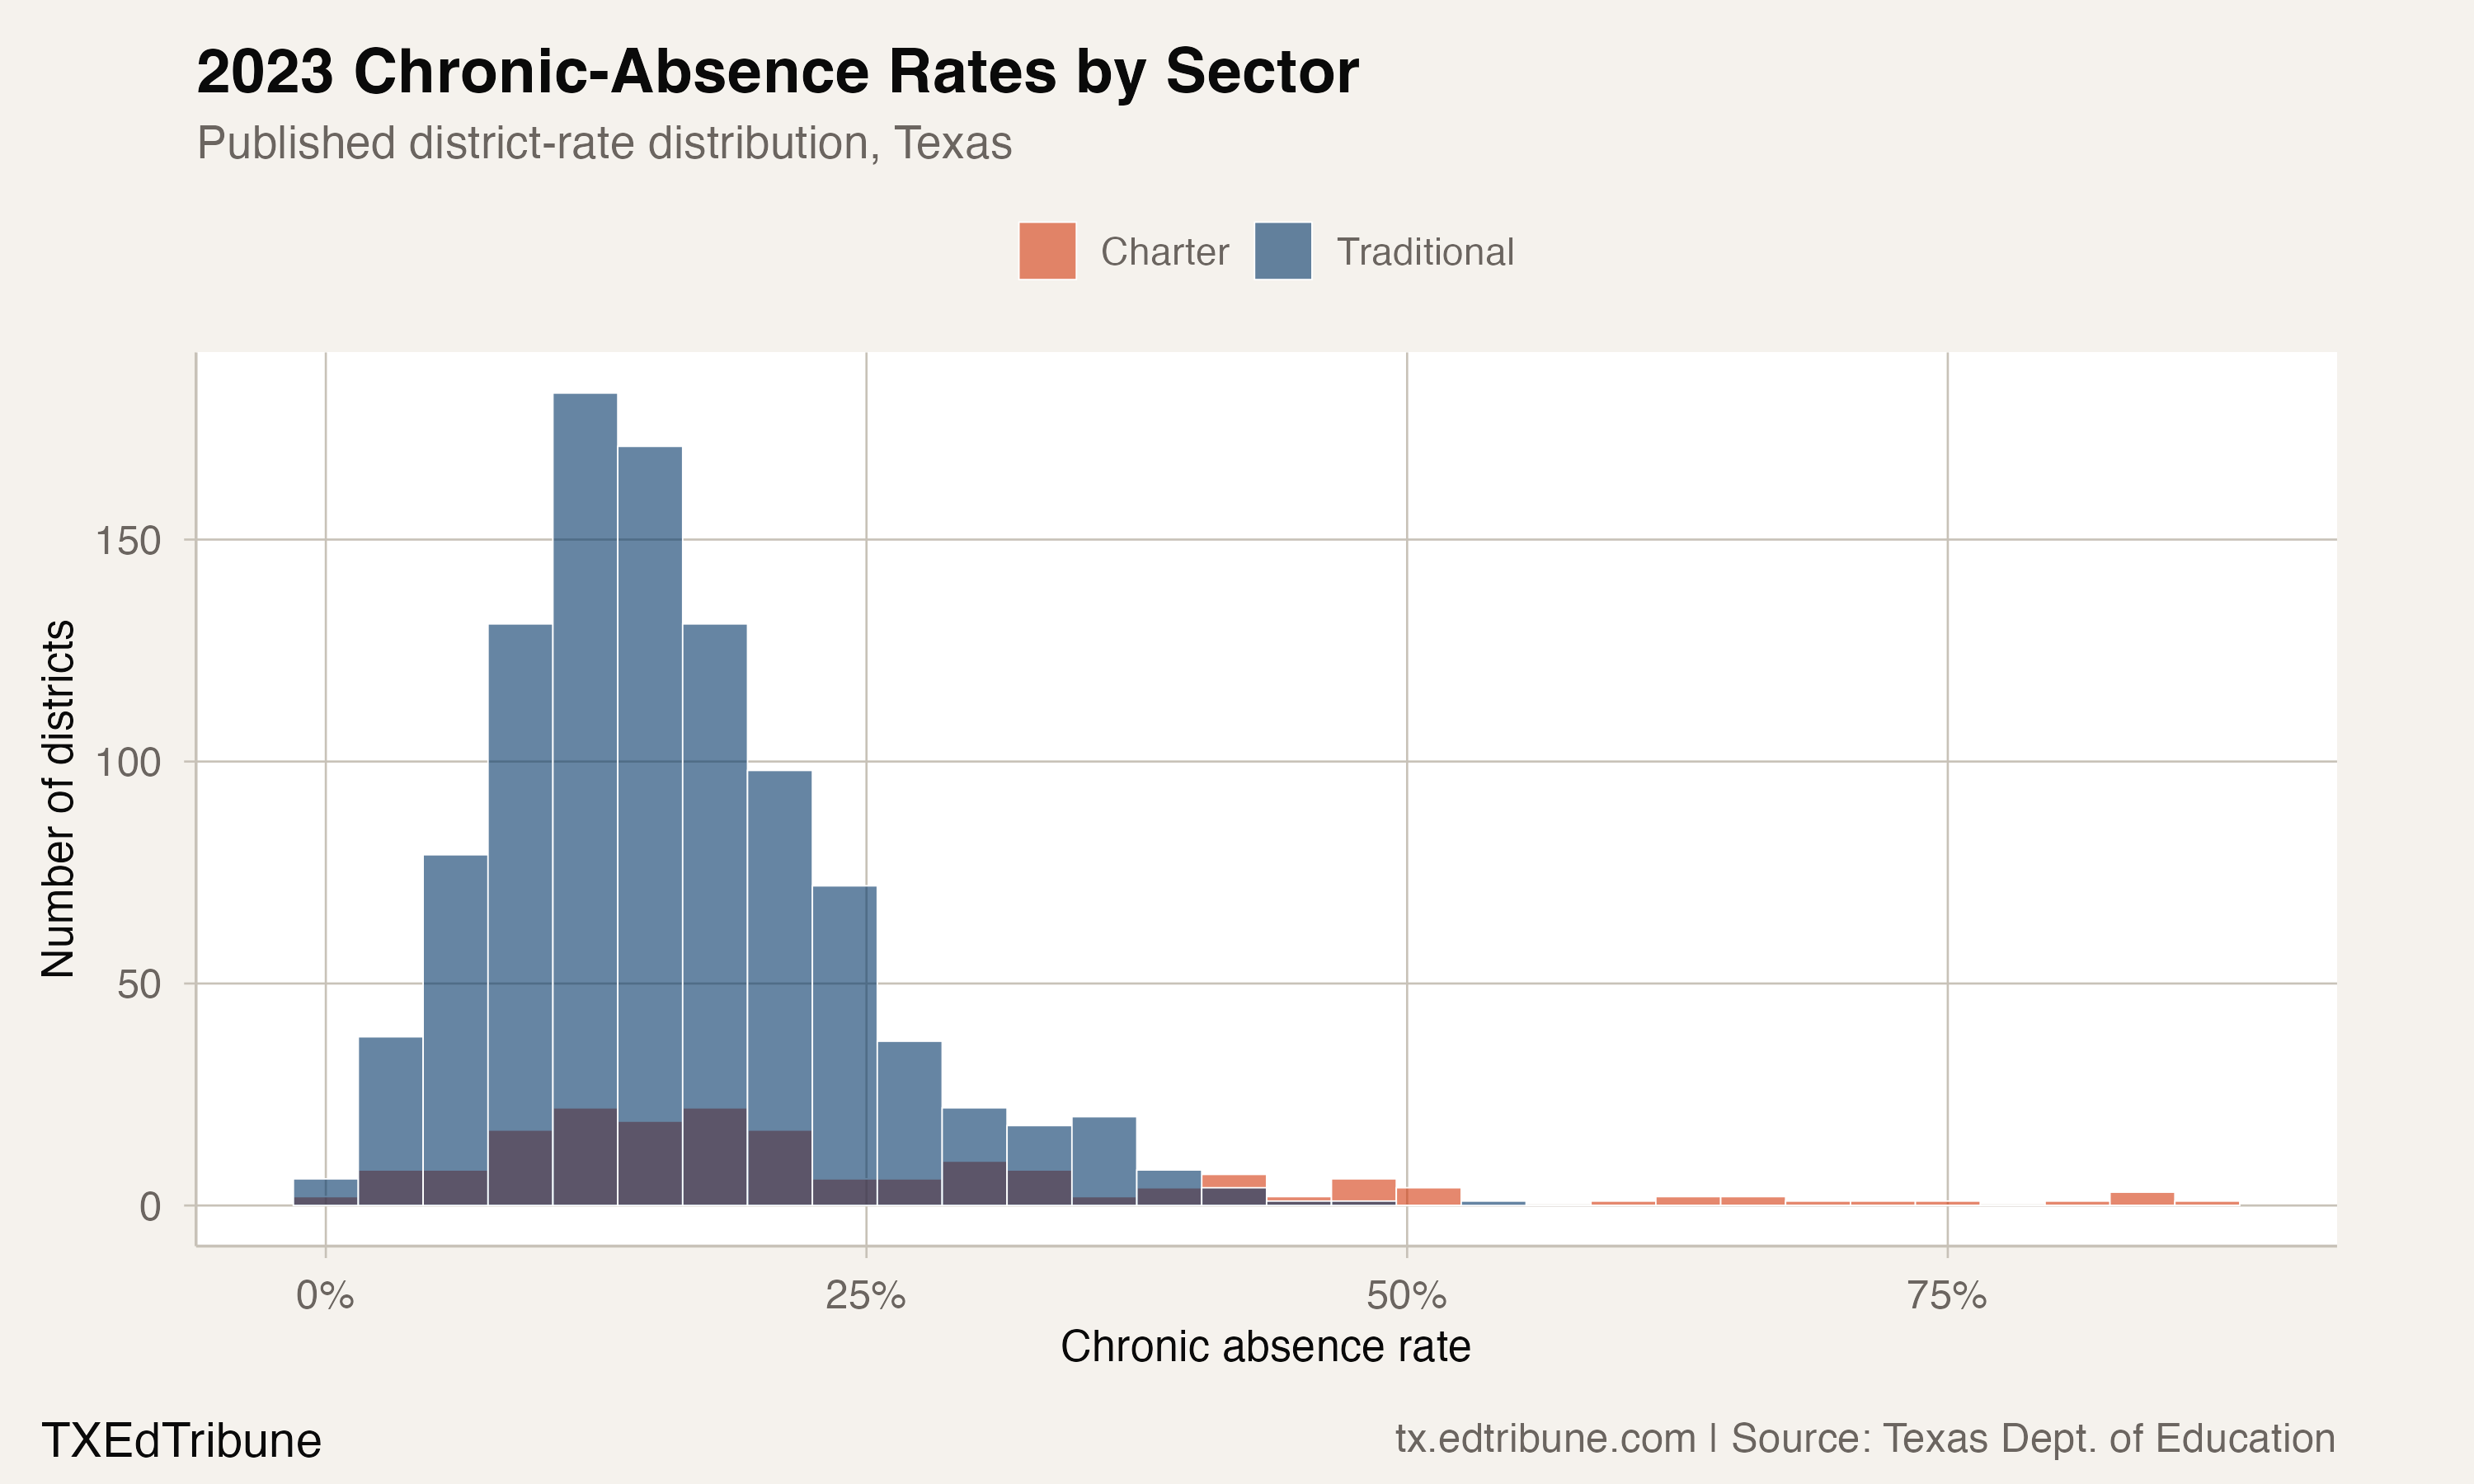
The 2023 charter rows were widely spread. Thirty-three charter districts had published rates of at least 40%, while 34 were below 10%. Five were at least 80%.
The highest published charter rate was 87.1% at Texans Can Academies. The lowest was 0.0% at Raven School. The charter range was 87.1 points; the traditional-district range was 53.6 points.
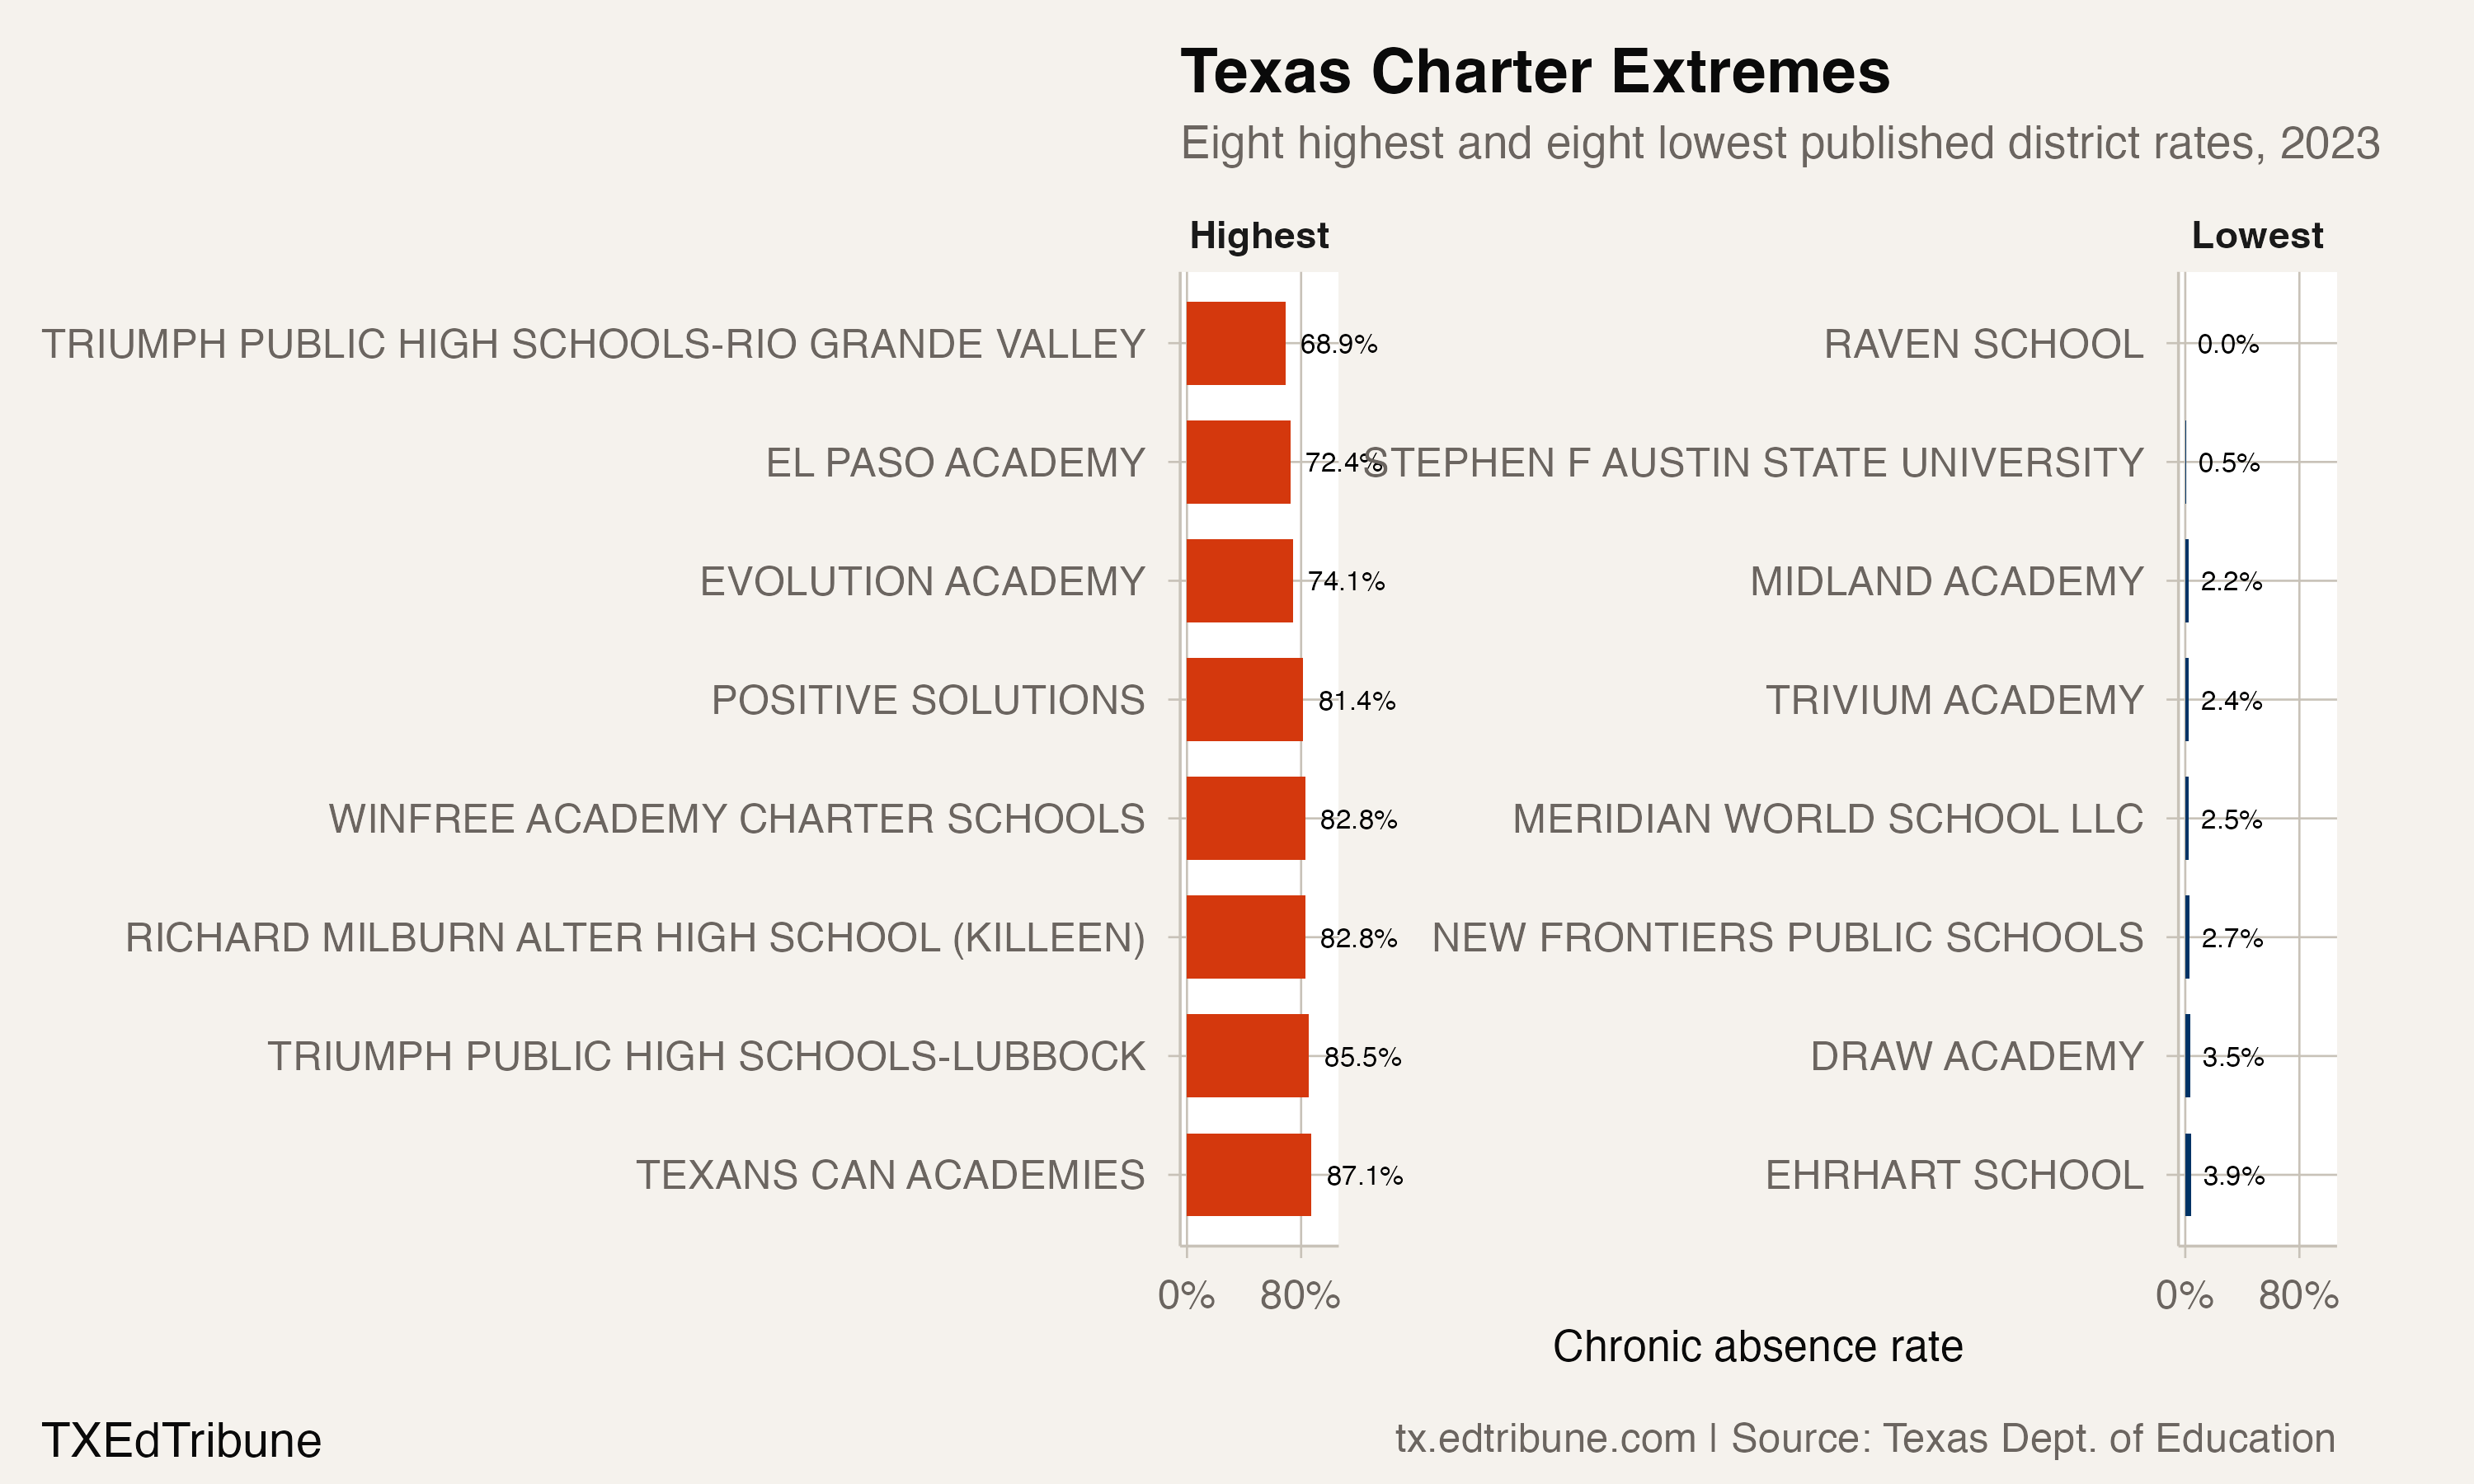
The extremes are descriptive, not an explanation of school operations or student circumstances. The published absence rows do not include mechanism fields that would establish why any district's rate is high or low.
Unresourced: This analysis does not establish whether sector composition, enrollment patterns, school models, reporting practices or other factors produced the observed differences.
Data from the Texas Education Agency. Analysis covers published 2019-20 through 2023-24 district chronic-absence rows; sector summaries are arithmetic means of reported district rates.
Detailed code that reproduces the analysis and figures in this article is available exclusively to EdTribune subscribers.
Discussion
Sign in to join the discussion.
Loading comments...