Correction (July 28, 2026): An earlier version of this article built its comparison universe by grouping district records on district name as well as district identifier. The Texas Education Agency renamed 47 systems between 2019 and 2023 (41 charter, 6 traditional), and each rename split a single system into two partial records, neither of which spanned both endpoint years, so all 47 fell out of the comparison. Every figure below has been re-derived at the district identifier grain, the rule the article described in the first place. The universe is 1,187 systems, not 1,140; 121 recovered (10.2%), not 119 (10.4%); 1,066 remained elevated (89.8%), not 1,021 (89.6%); the median change is an increase of 5.8 points, not 5.7; 252 systems worsened by more than 10 points and 27 by more than 20, not 231 and 23; traditional districts recovered 105 of 1,019, not 104 of 1,013; and charter systems recovered 16 of 168, or 9.5%, not 15 of 127, or 11.8%. That last change reverses the direction of the sector comparison: traditional districts recovered at a slightly higher share than charter systems, not a lower one. The statewide series and the count of 117 systems at their 2023 panel high were not affected.
Only 121 of 1,187 Texas district-level systems with reported chronic absenteeism rates in both 2019 and 2023 returned to or below their earlier rate. That was 10.2%.
The other 1,066 systems, 89.8% of the fixed comparison, reported a higher rate in 2023 than in 2019.
Texas's statewide rate did improve in the latest year of the panel. It fell 5.5 percentage points from 25.7% in 2022 to 20.3% in 2023. The endpoint comparison shows that the statewide decline did not mean most district-level systems had returned to their 2019 rate.
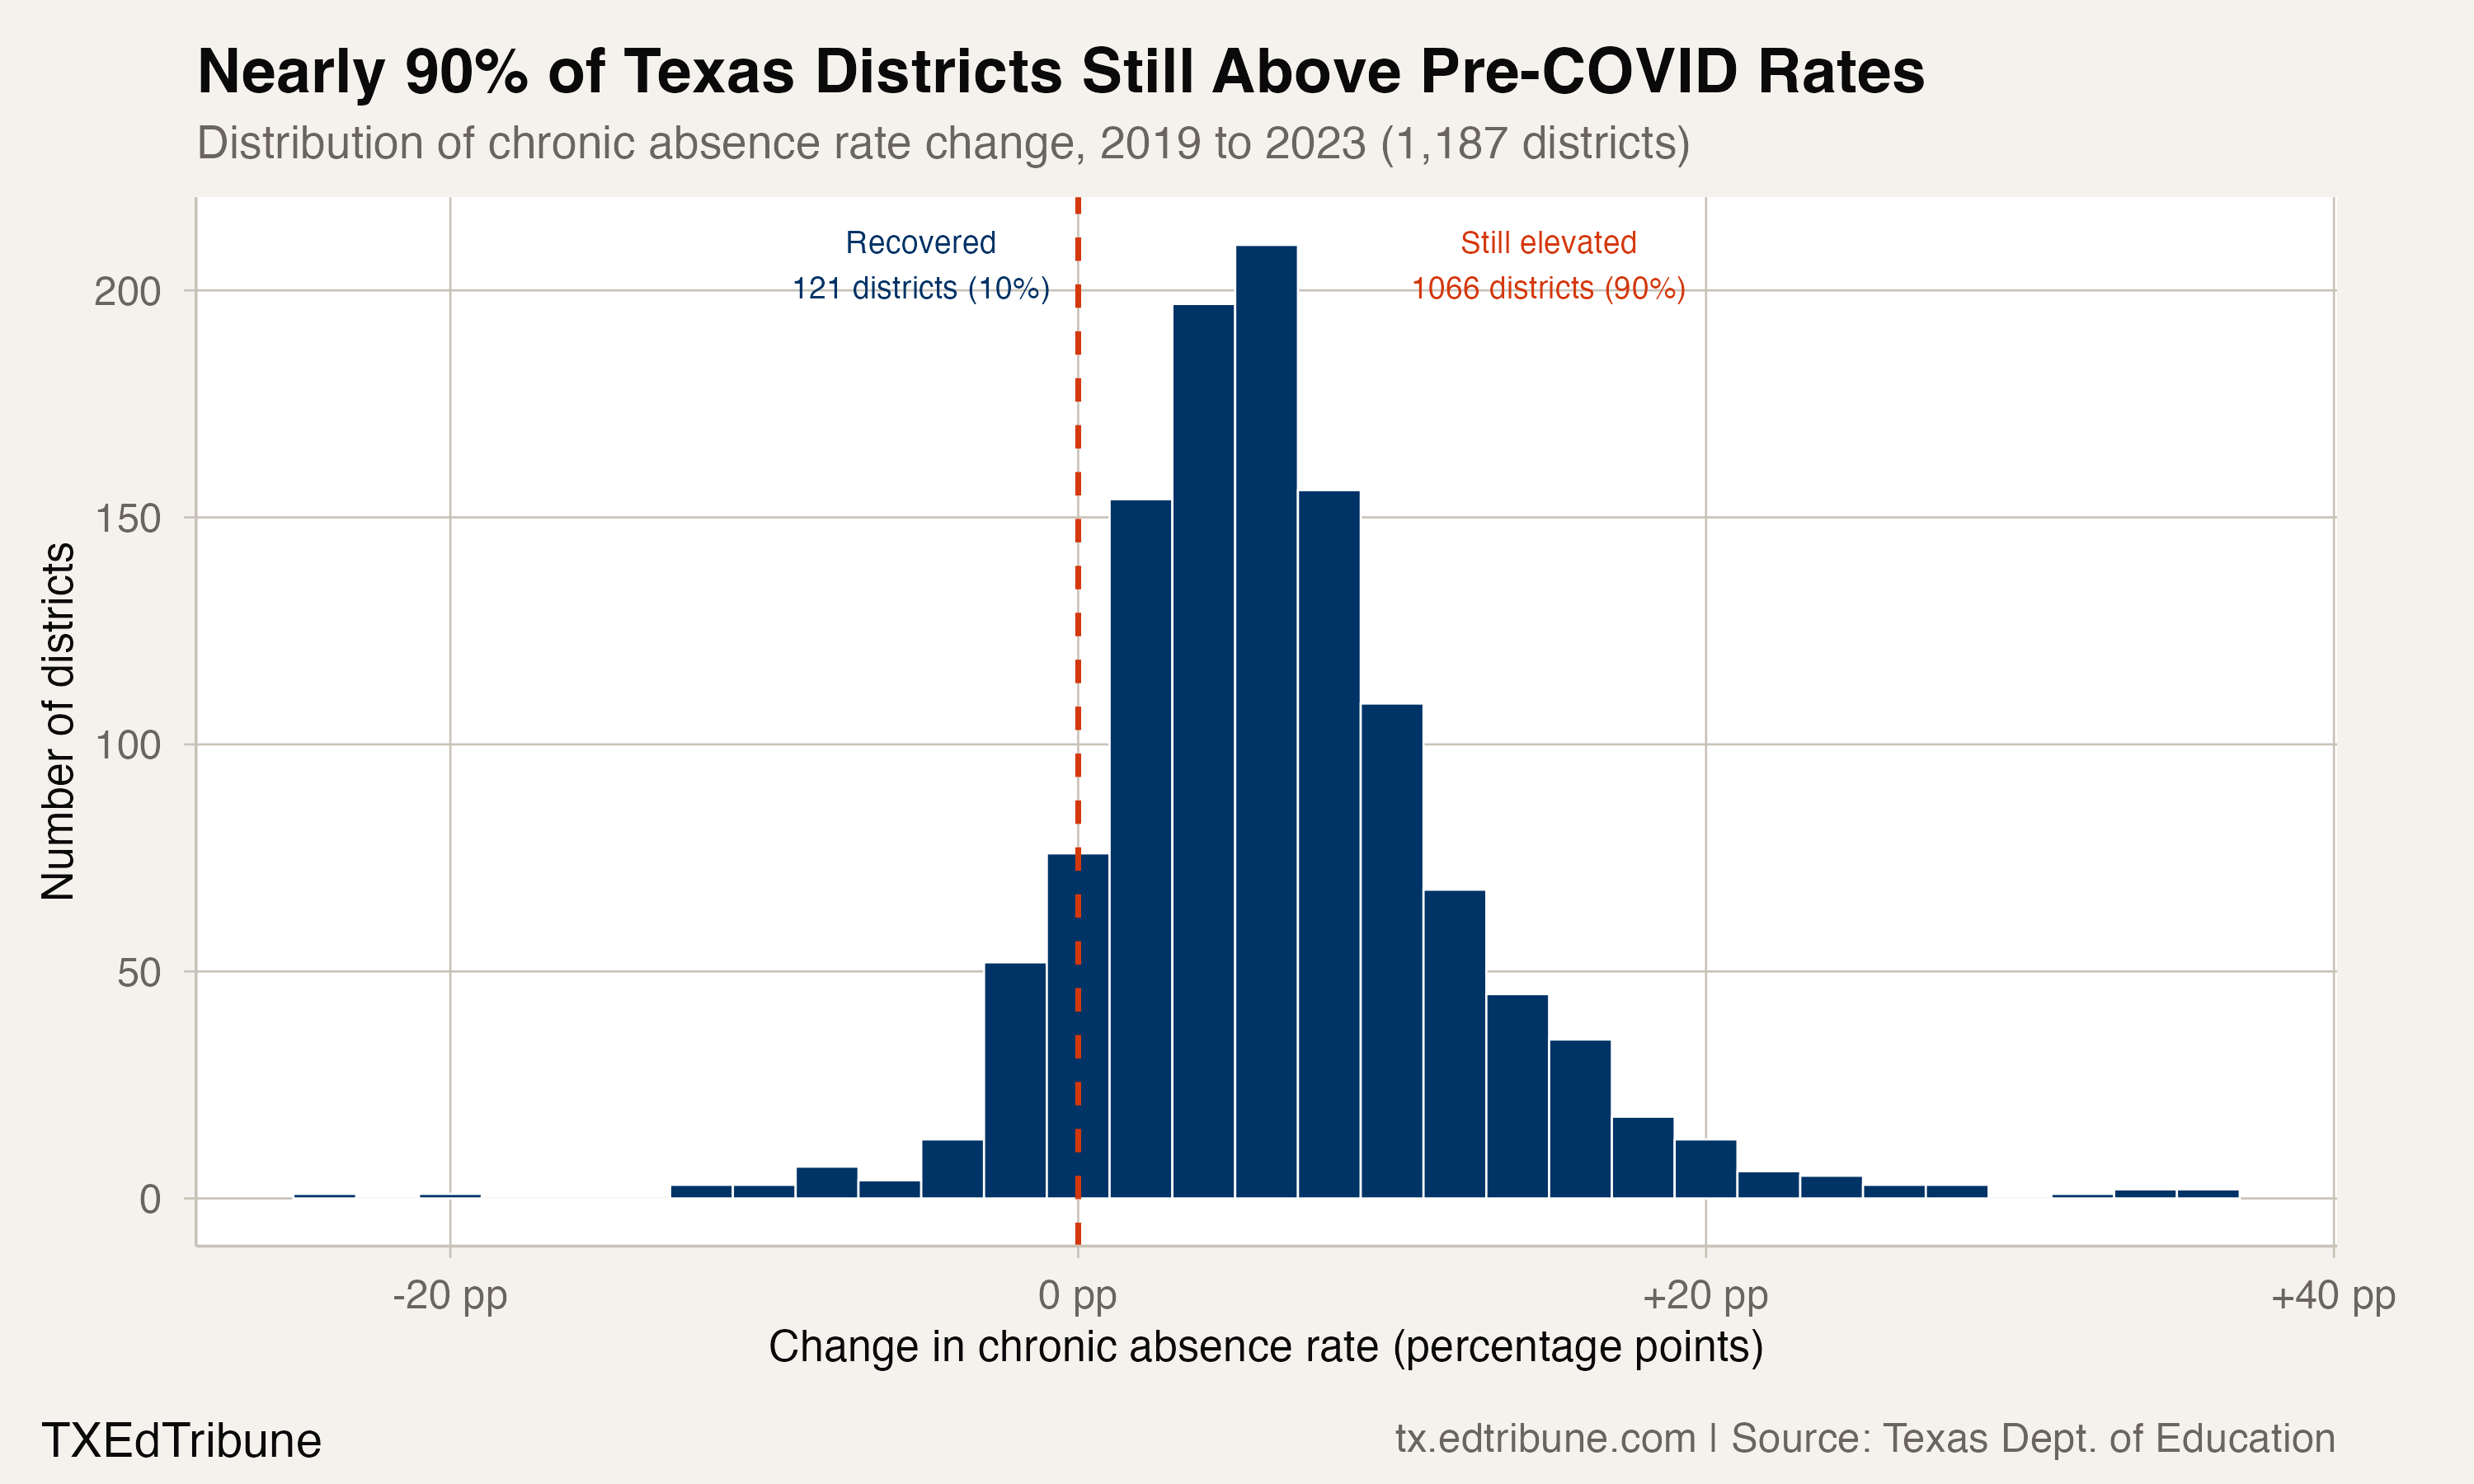
A median increase of 5.8 points
The median district-level change from 2019 to 2023 was an increase of 5.8 percentage points. Some 252 systems worsened by more than 10 points, and 27 worsened by more than 20 points.
The recovery rule is intentionally simple: a system counts as recovered when its 2023 rate is less than or equal to its 2019 rate. It does not require a particular amount of improvement.
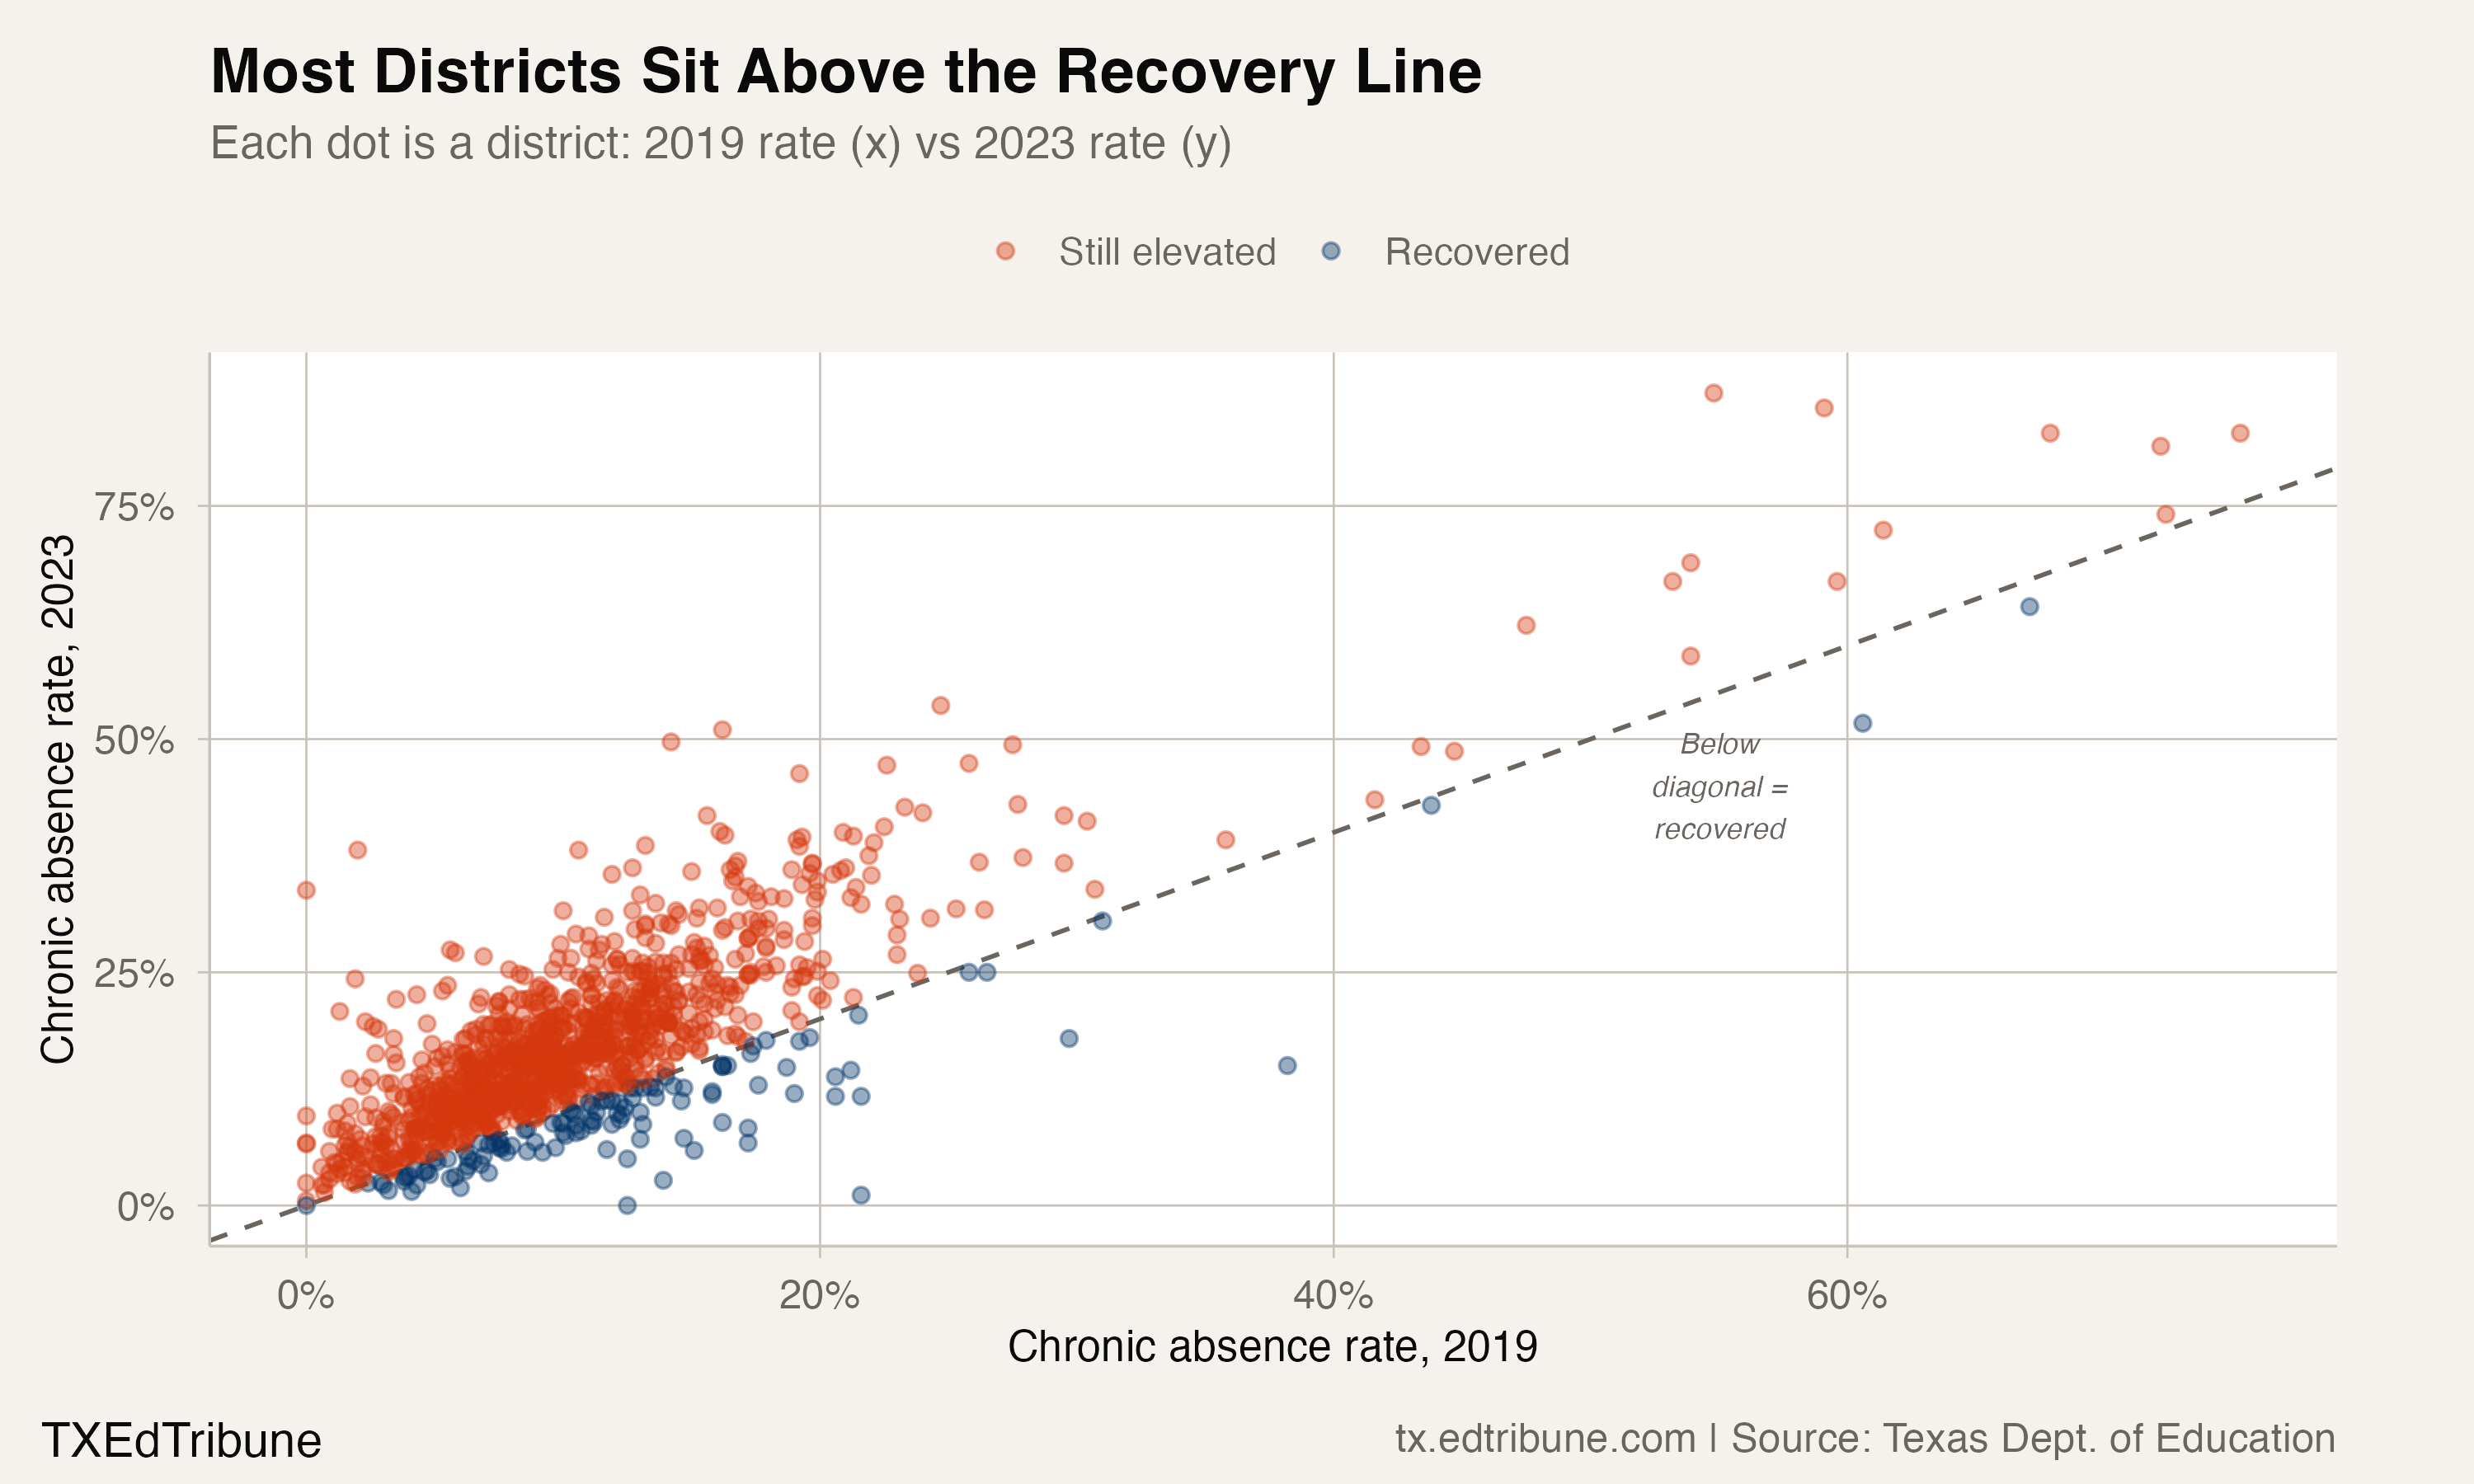
Points below the diagonal had recovered under that rule; points above it remained elevated.
Traditional and charter systems were both near 10%
Among traditional districts, 105 of 1,019 recovered, or 10.3%. Among charter systems, 16 of 168 recovered, or 9.5%. Traditional districts recovered at the higher share of the two, by less than a percentage point.
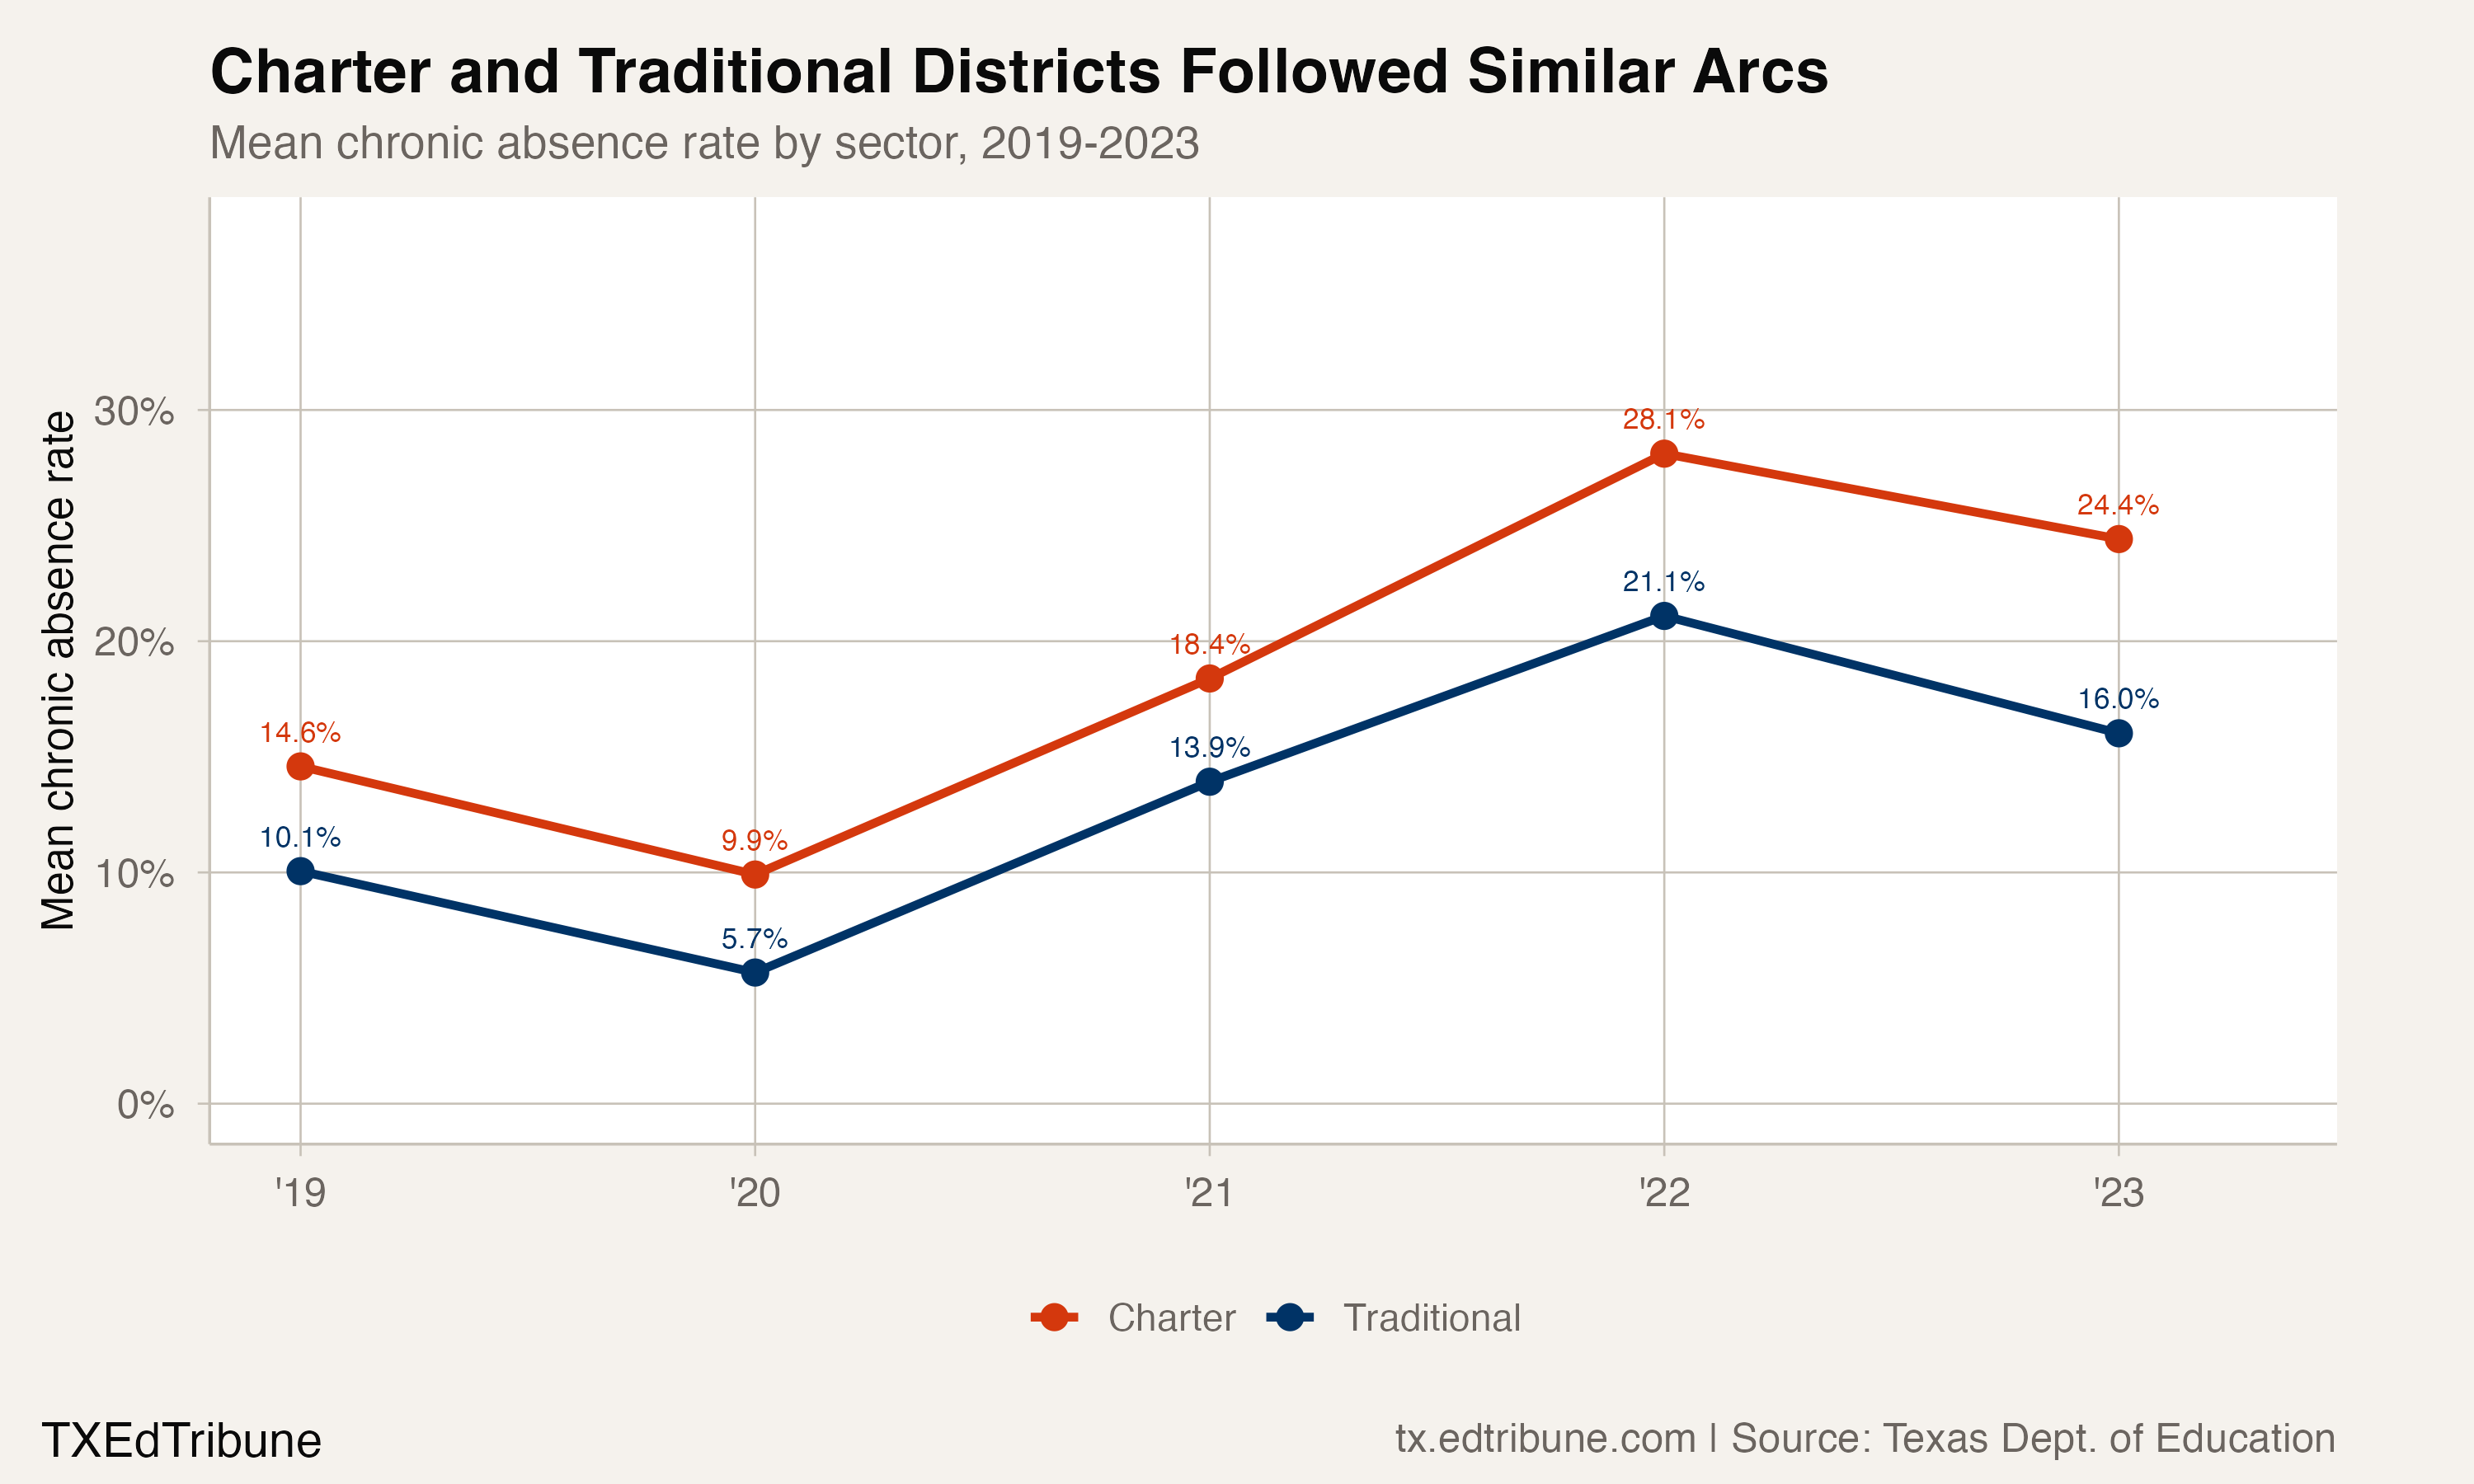
The comparison does not establish that either governance model caused the outcome. The attendance files identify sector and rates, not the policies or student populations responsible for the change.
Extremes should be read with care
The largest endpoint changes include both conventional districts and charter systems. They also include systems with very different enrollment sizes and missions.
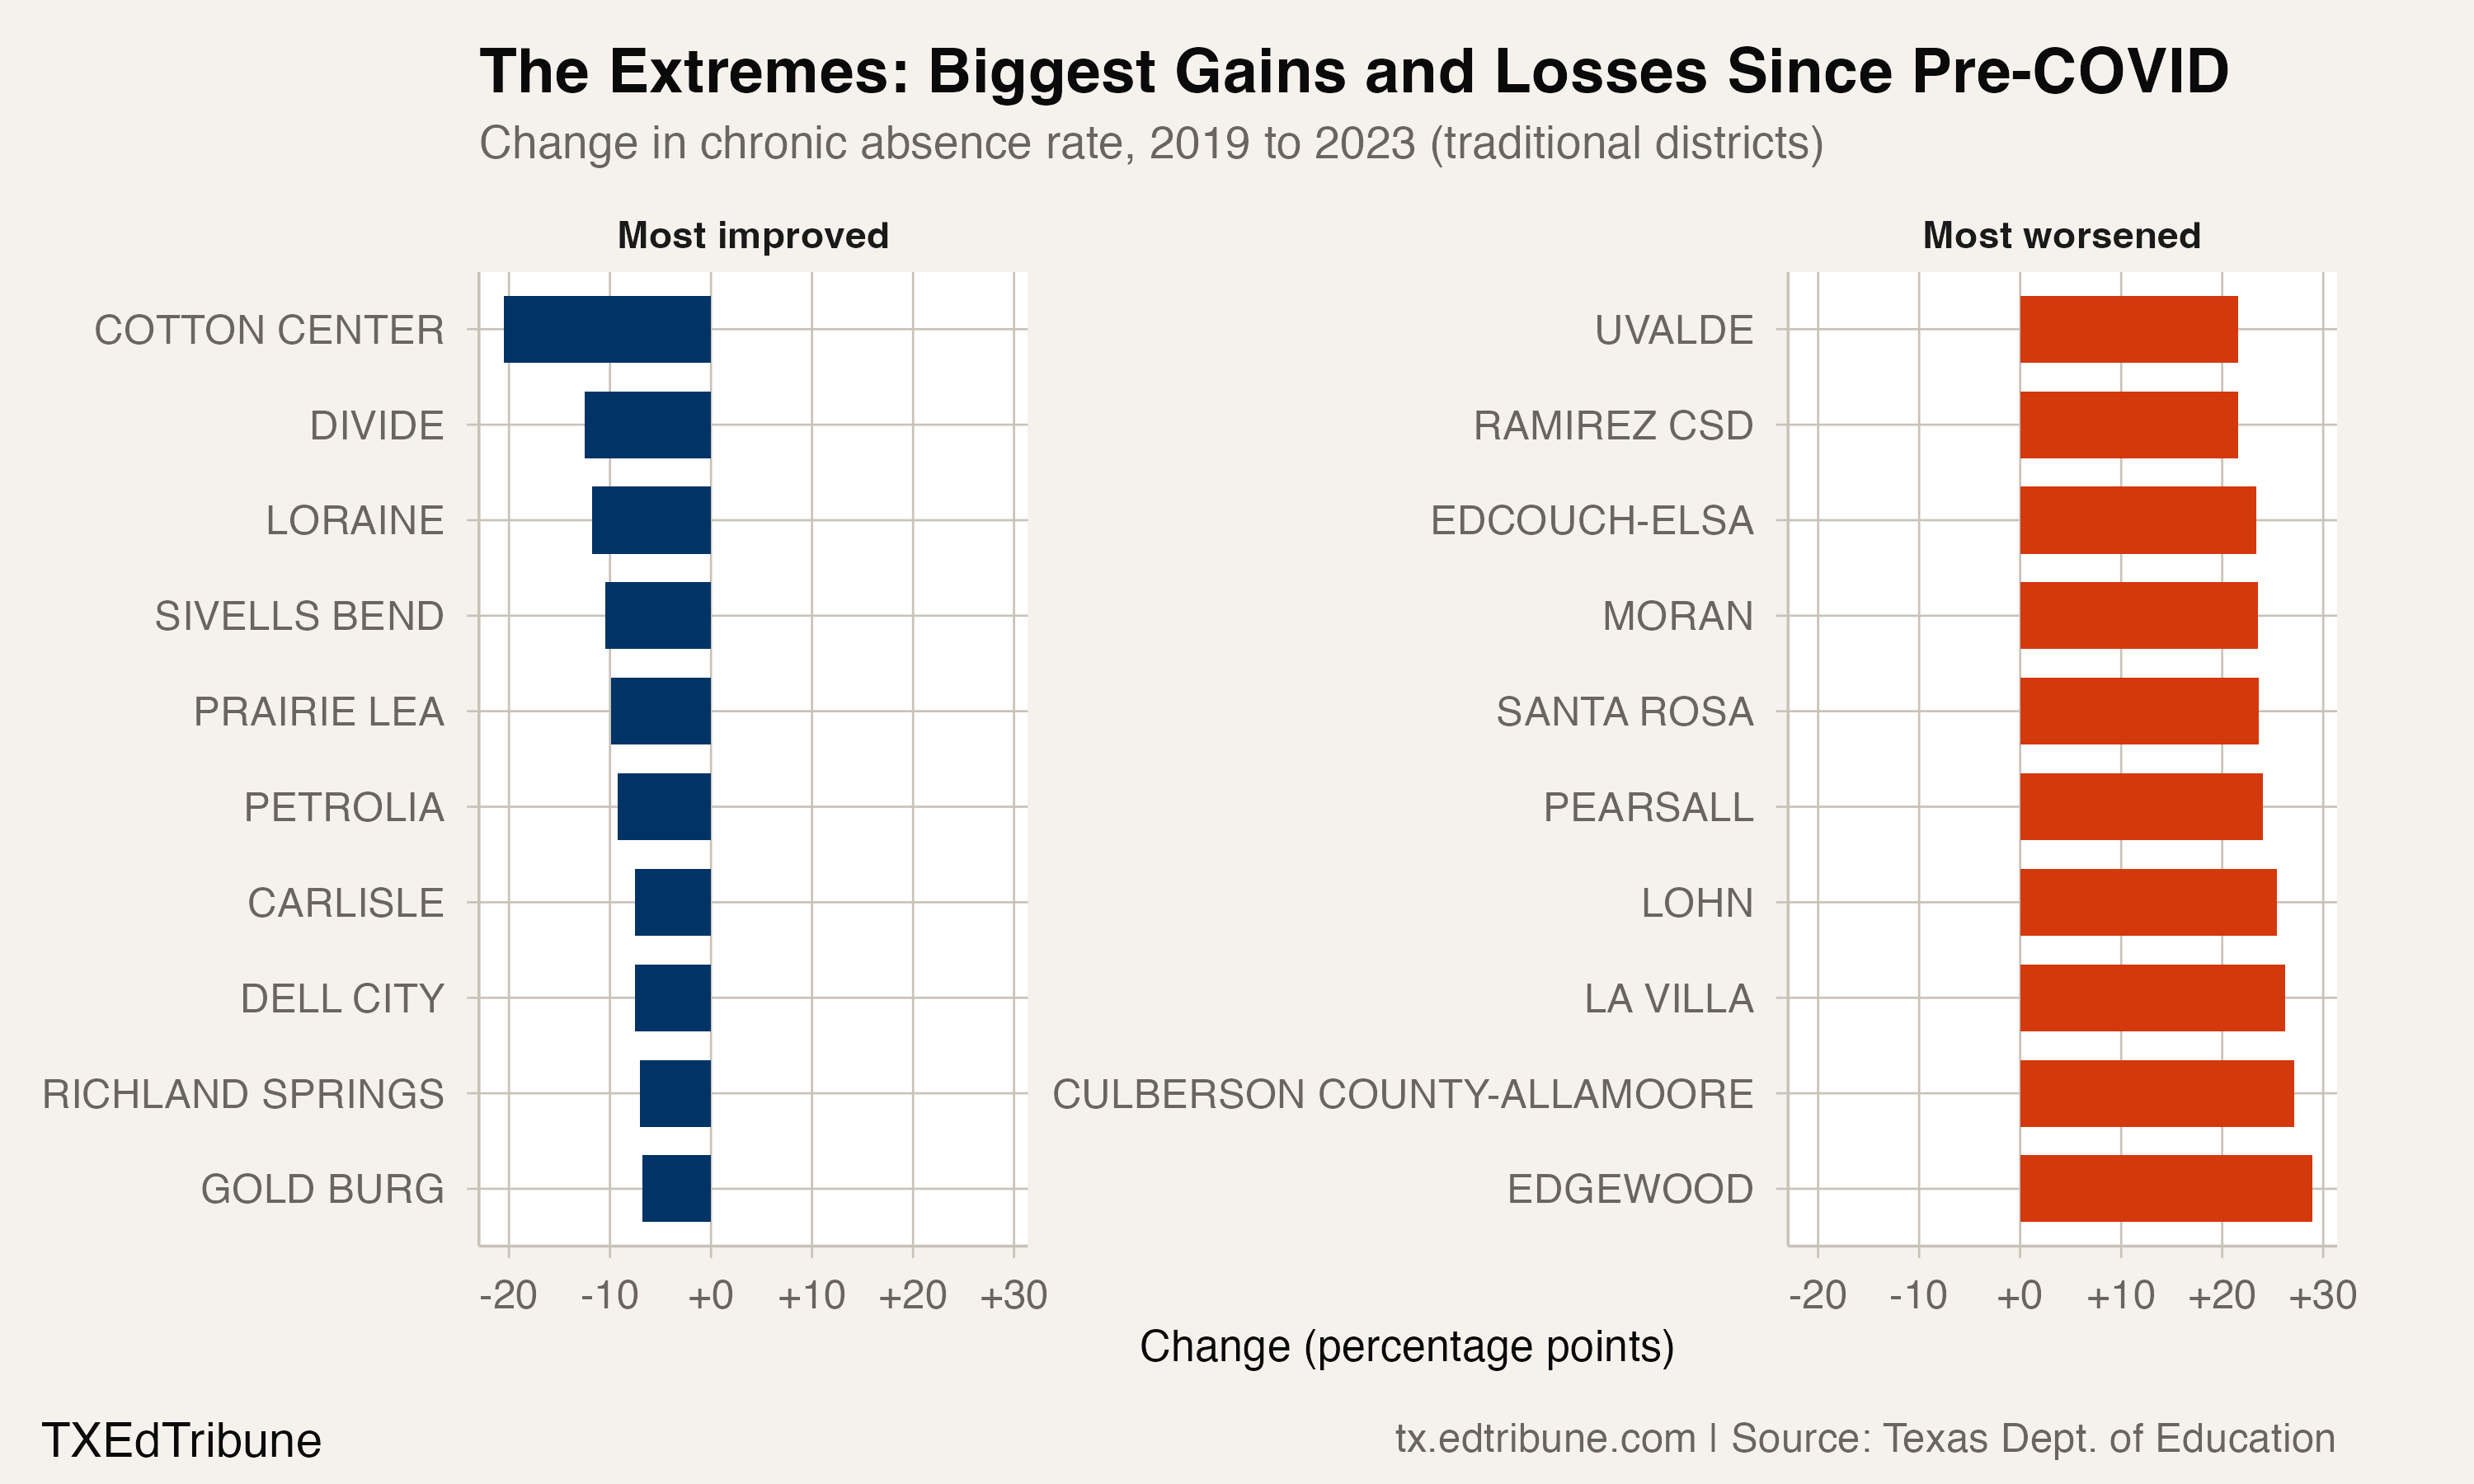
The chart is descriptive, not a performance ranking adjusted for size, student composition, or program type.
In addition, 117 systems reported their highest chronic absenteeism rate in 2023 within the five-year package panel. That is a panel-specific maximum, not an all-time historical claim.
What the comparison does not show
The TAPR data establishes the fixed endpoint differences and the distribution across systems. It does not identify whether funding rules, attendance interventions, health conditions, student mobility, or other mechanisms explain those differences. Those explanations are unresourced here.
Every figure above is built at the district identifier grain, so a system the state renamed between the two endpoint years stays in the comparison as one system rather than dropping out of it.
Chronic absenteeism rates come from the Texas Education Agency's Texas Academic Performance Reports.
Detailed code that reproduces the analysis and figures in this article is available exclusively to EdTribune subscribers.
Discussion
Sign in to join the discussion.
Loading comments...