Correction: An earlier draft overstated two Edgewood subgroup rates and incorrectly said every subgroup was above a common threshold. The analysis and subgroup chart now use the package-backed values.
In Edgewood ISD↗ET in San Antonio, the chronic absenteeism rate rose to 53.6% in 2023, the highest point in the available panel. More than half of the district's students missed at least 10% of the school year.
Edgewood moved opposite its larger neighbor. San Antonio ISD↗ET fell from 53.0% in 2022 to 40.6% in 2023. Across Bexar County, 21 school systems exceeded a 30% chronic absenteeism rate that year: 14 charter operators and seven traditional districts.
Edgewood's trajectory
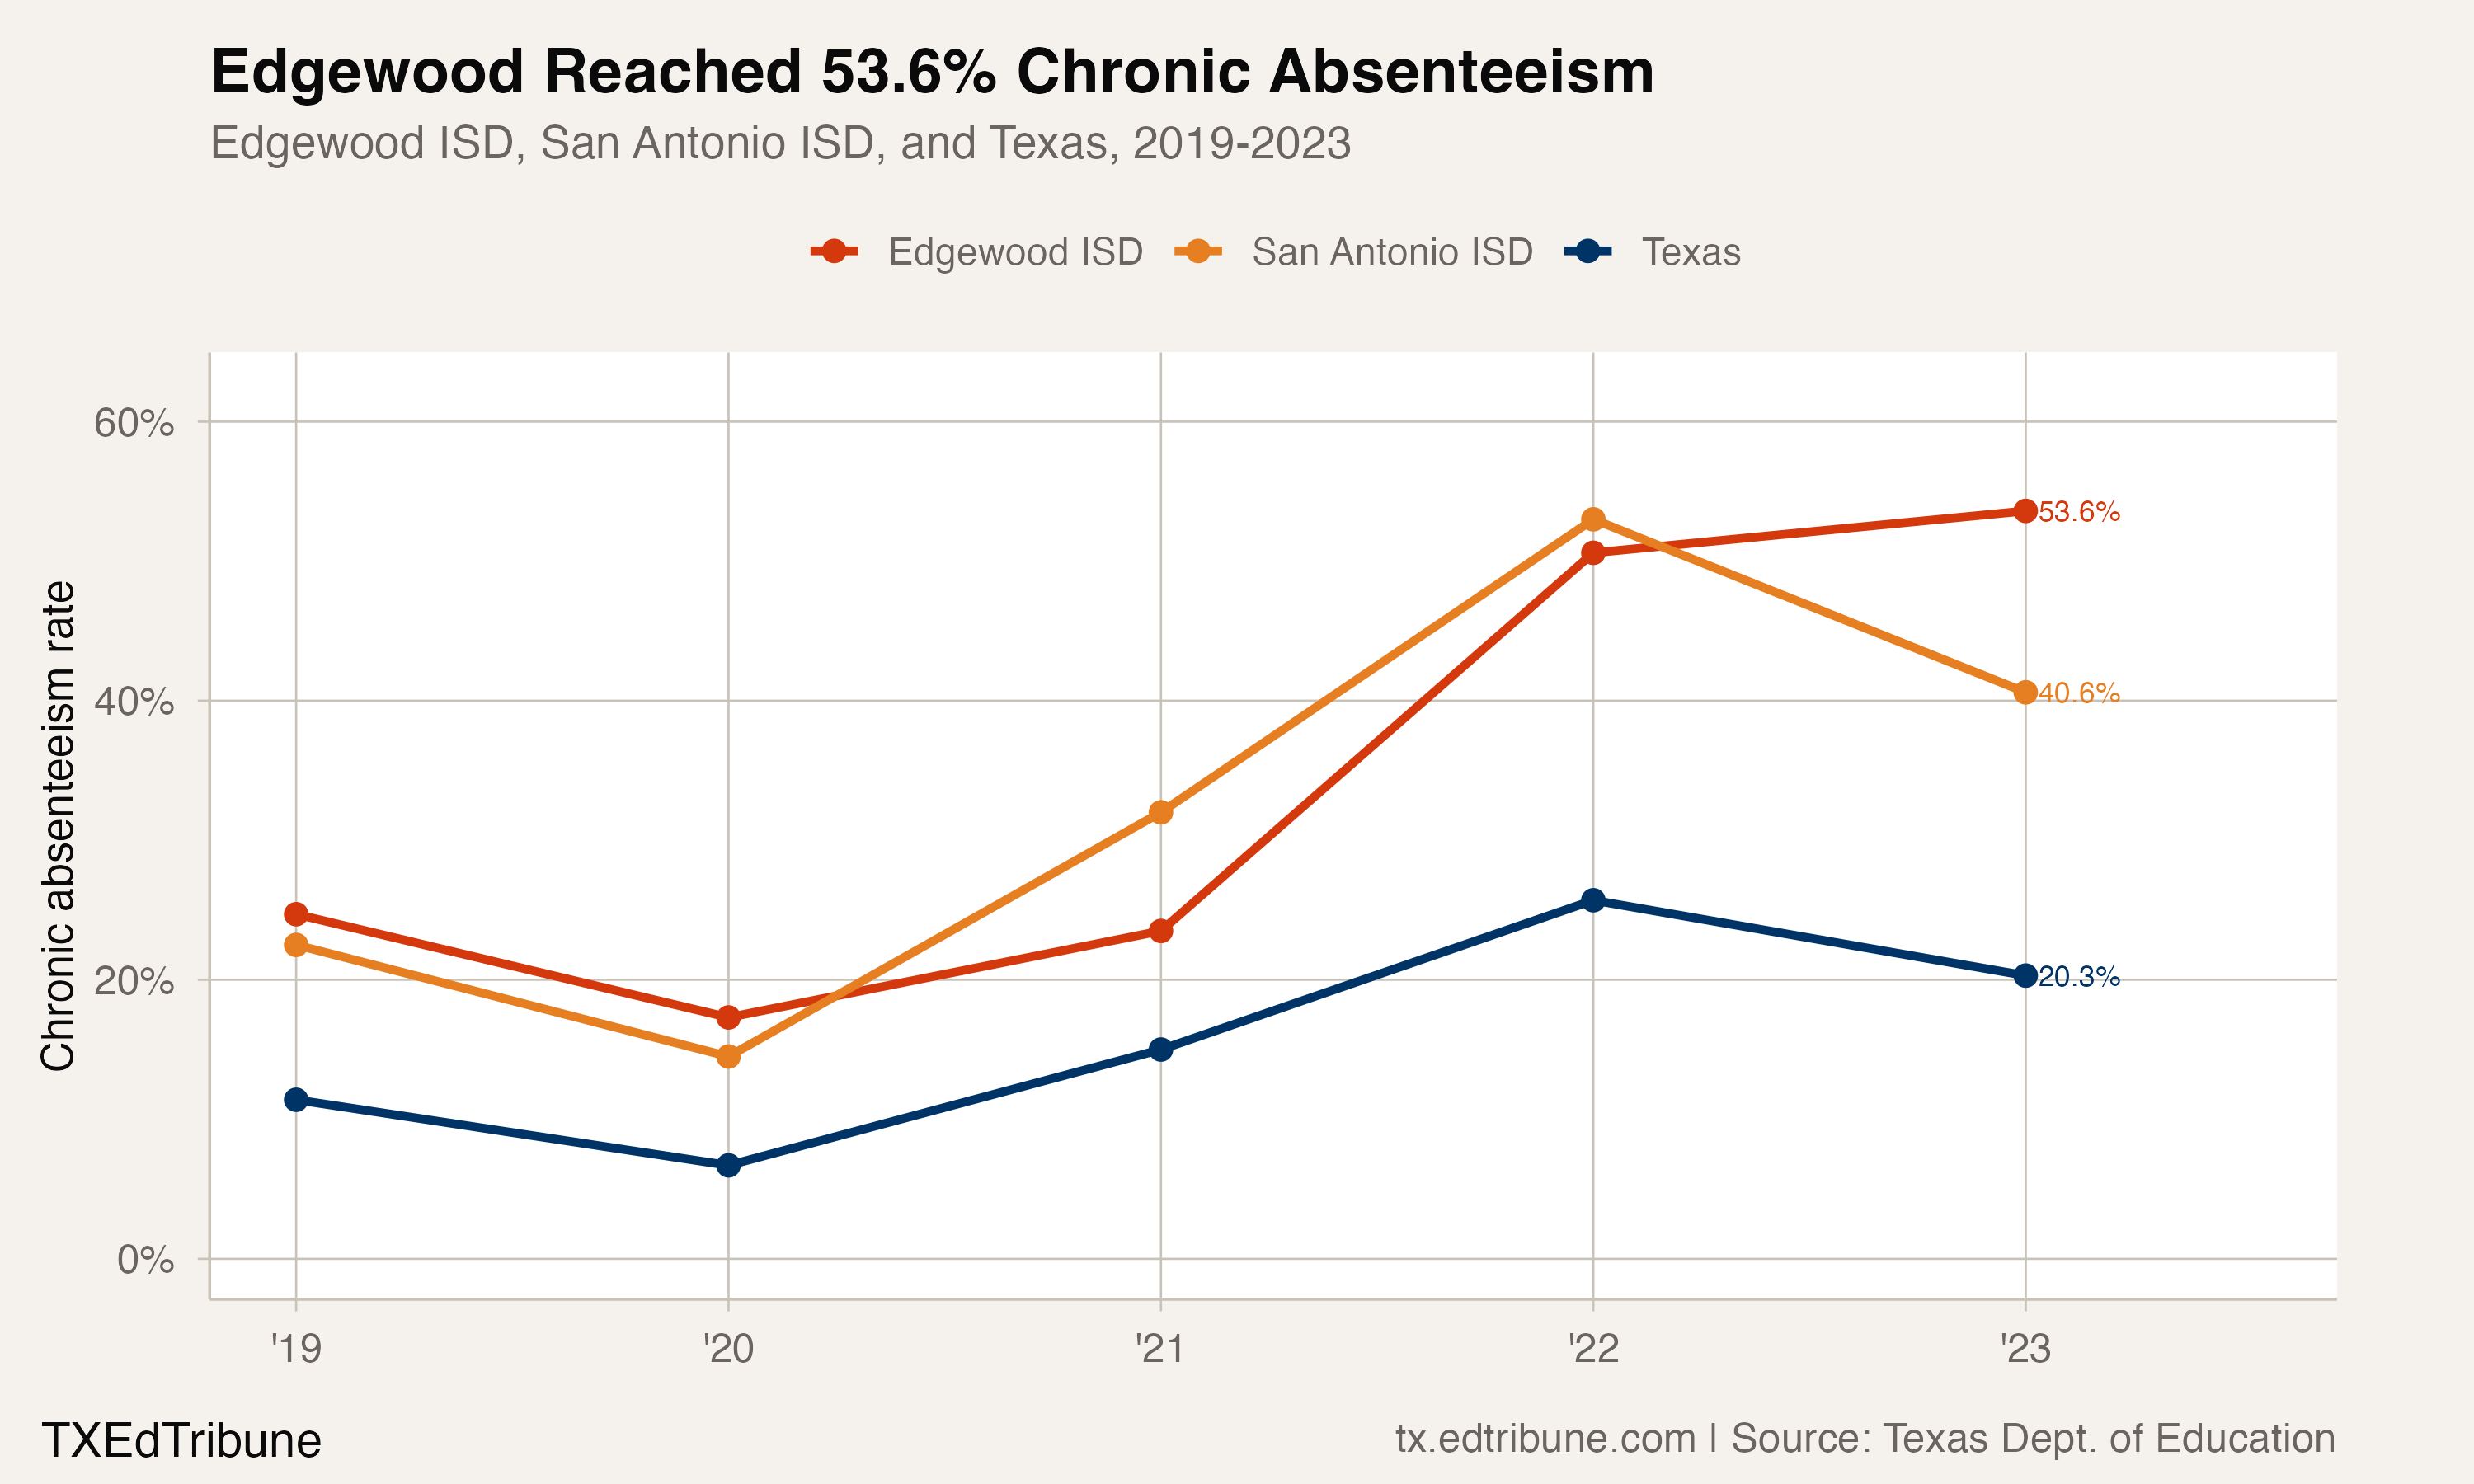
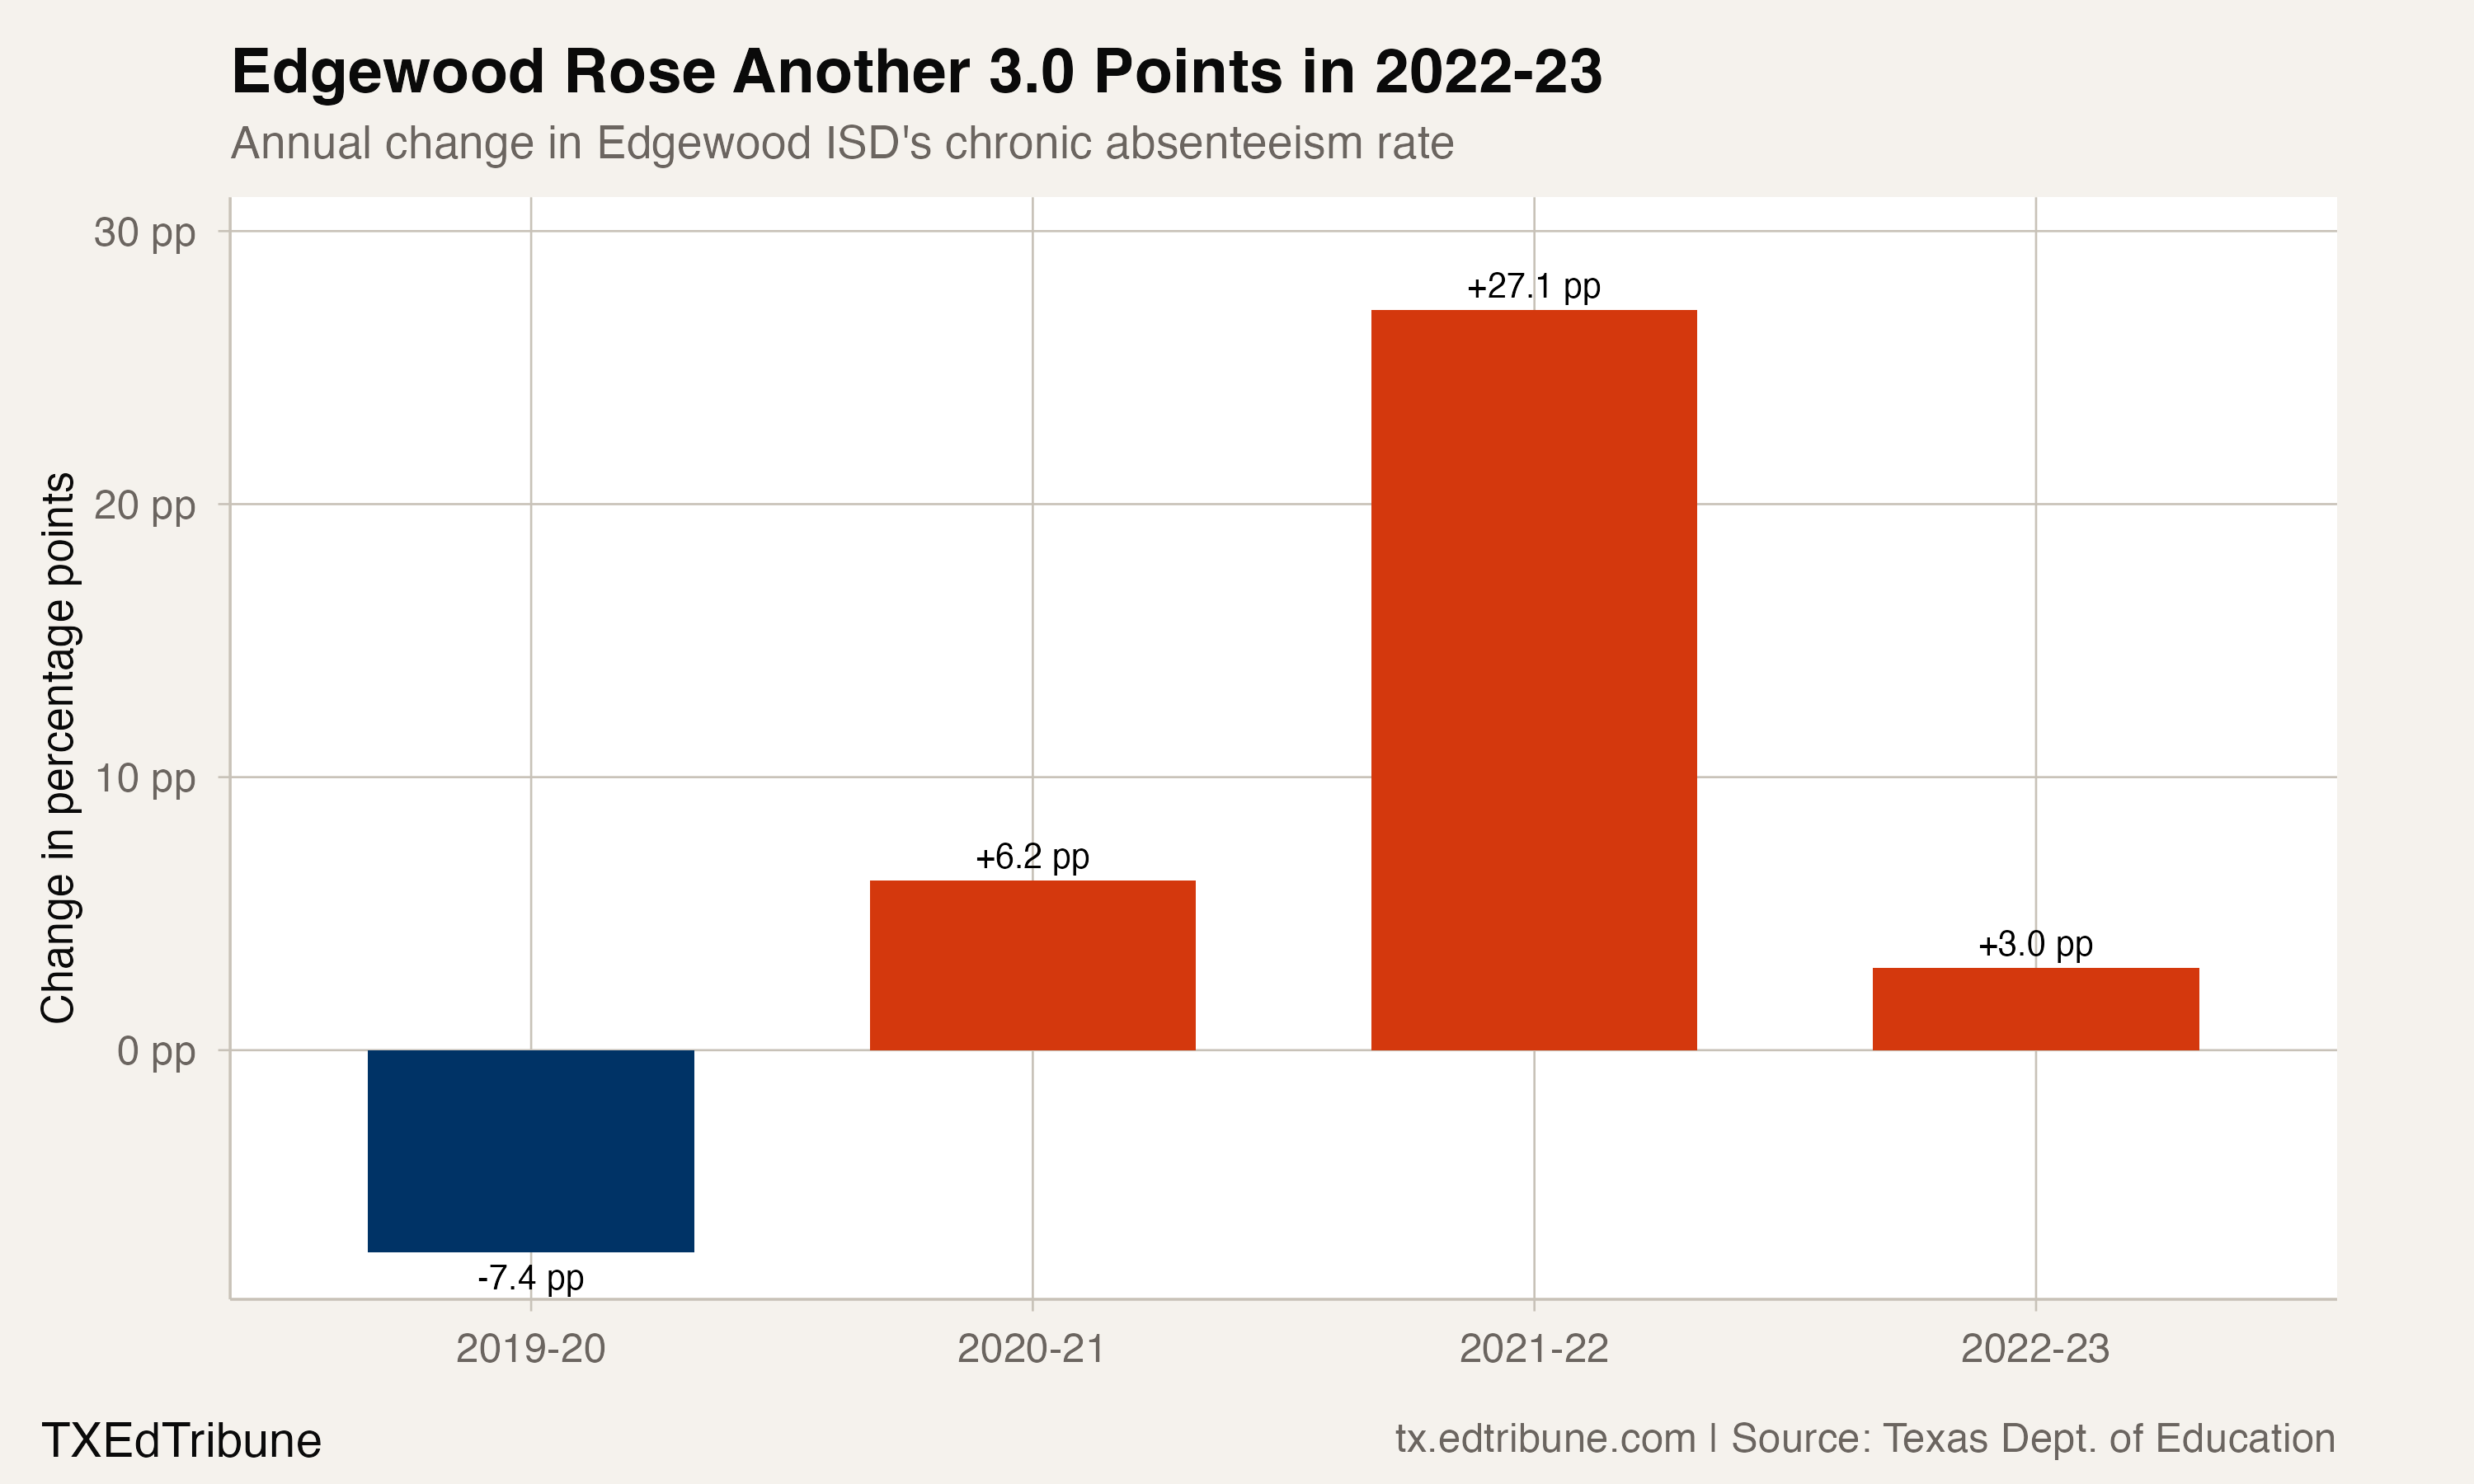
Edgewood's rate was 24.7% in 2019, compared with 11.4% statewide. San Antonio ISD's rate then fell 12.4 percentage points in 2023, while Edgewood rose 3.0 points. Texas fell 5.4 points over the same year, from 25.7% to 20.3%.
The Bexar County landscape
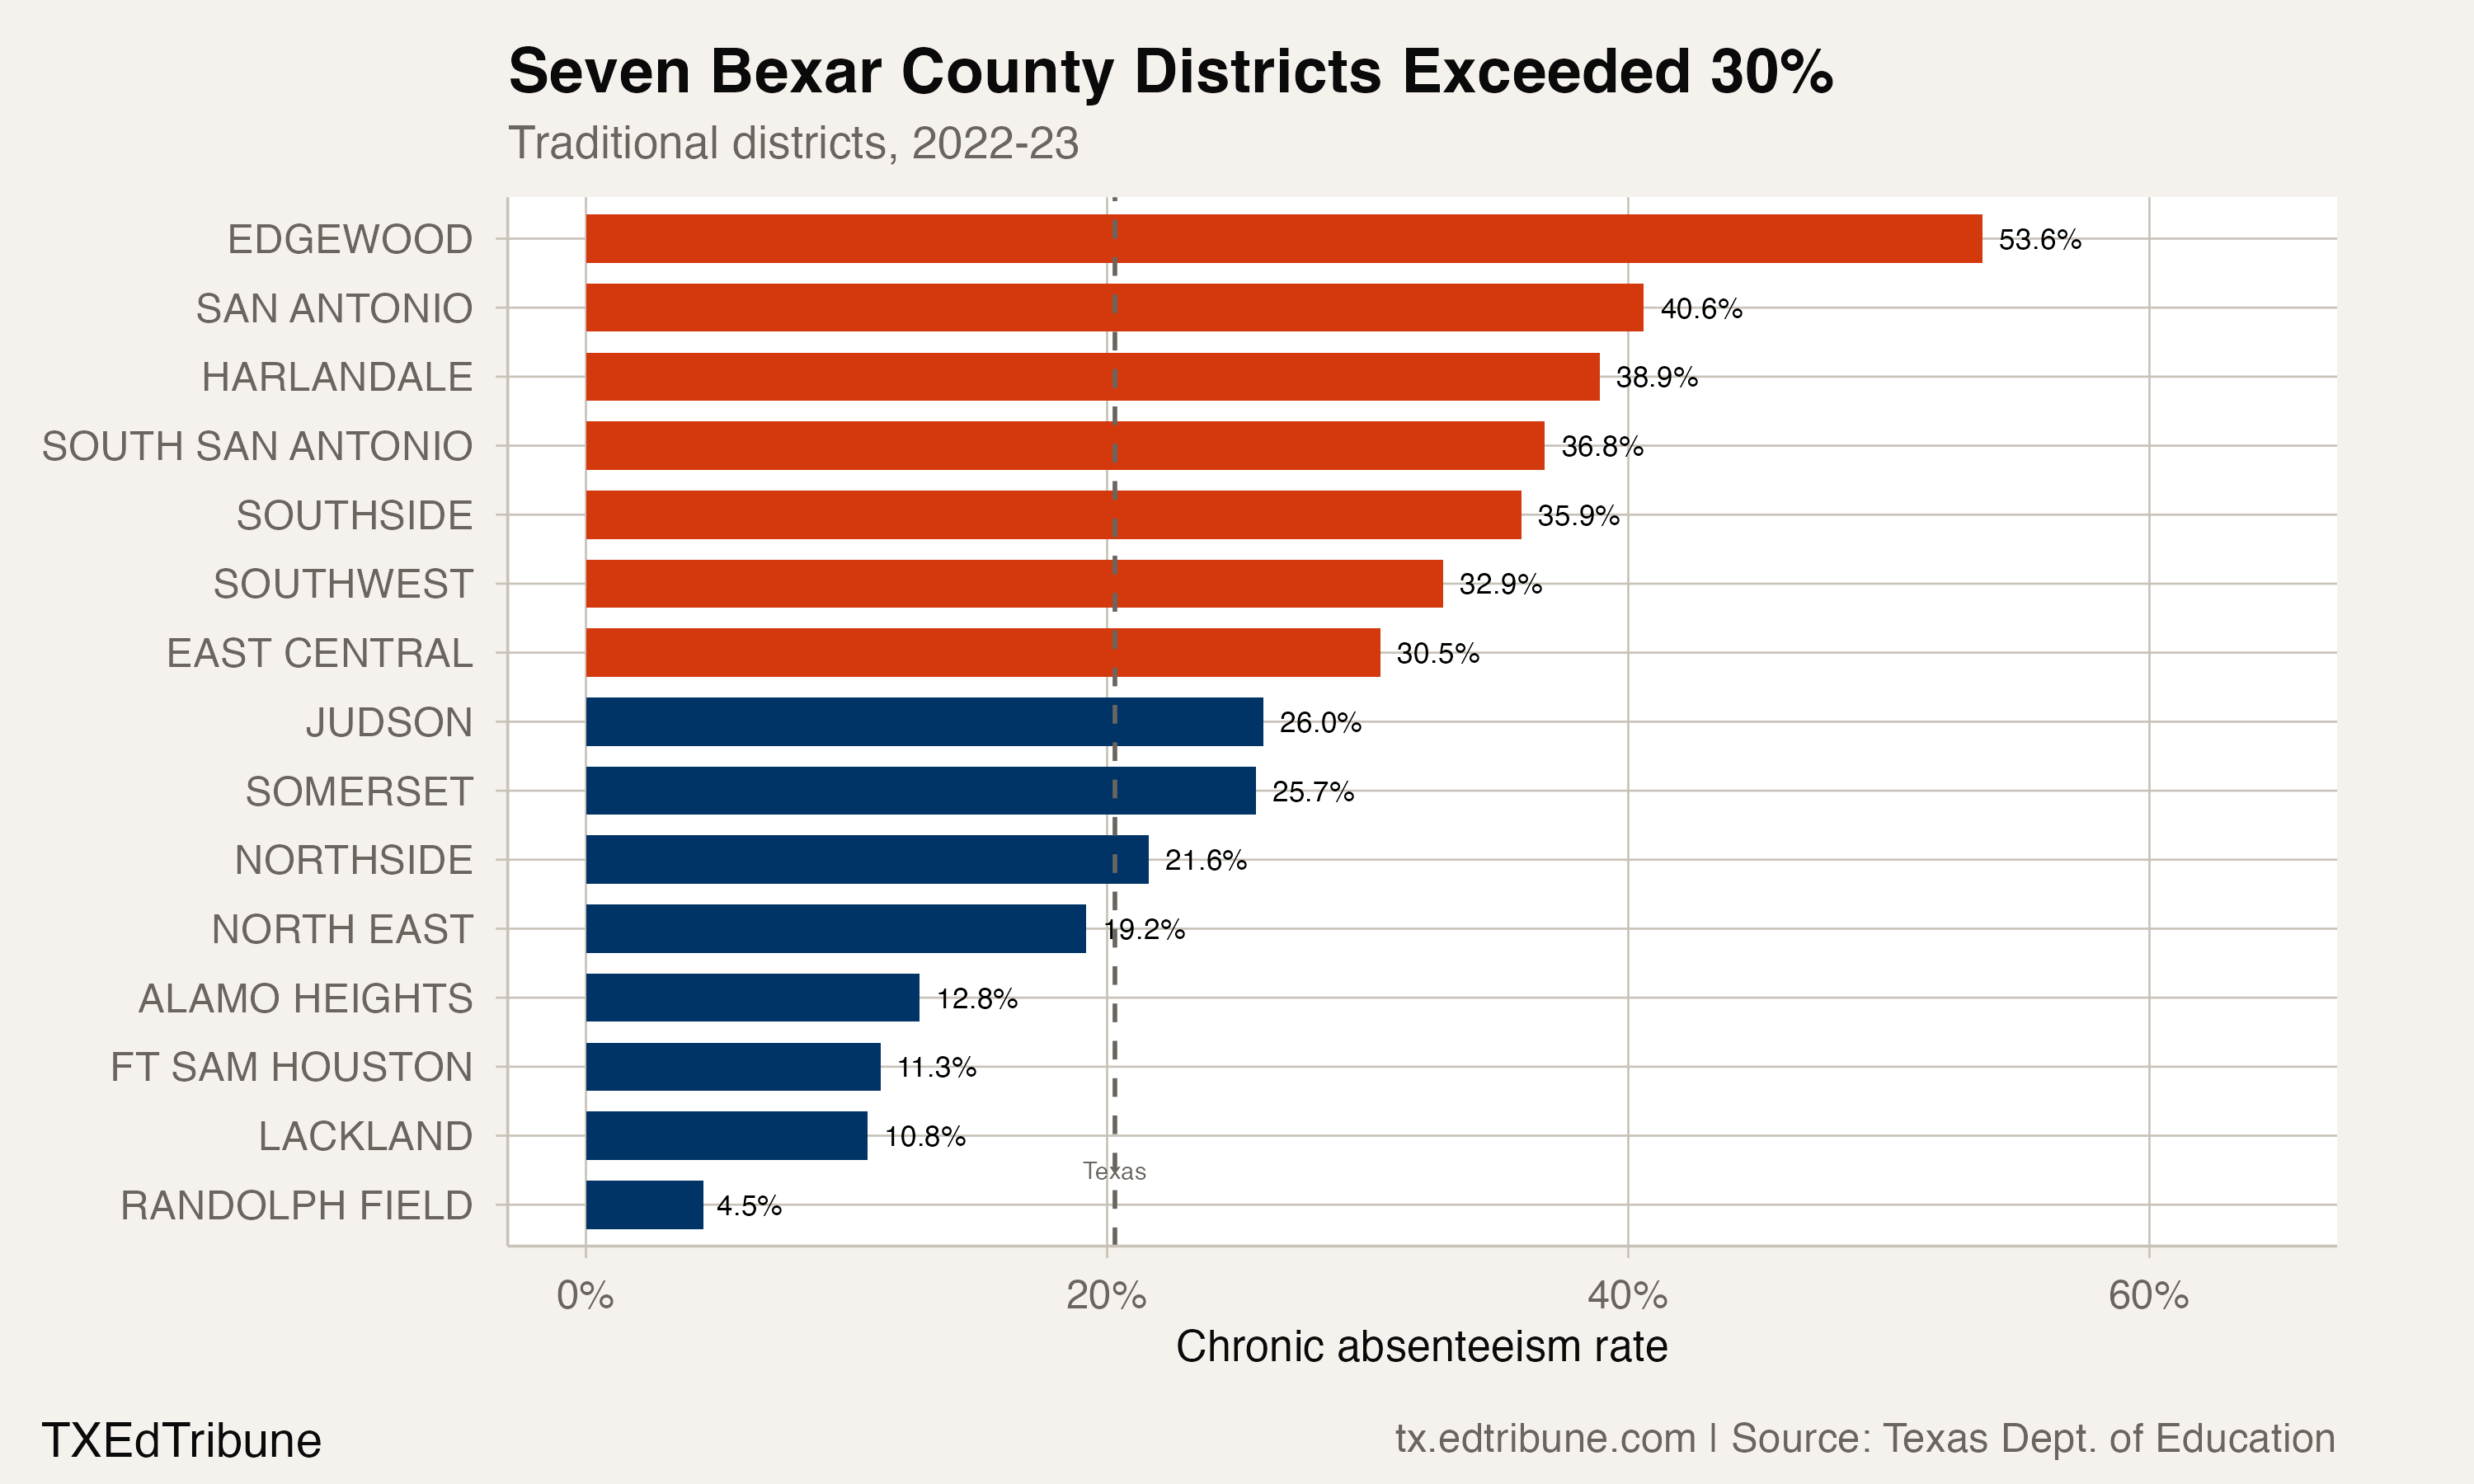
Seven of Bexar County's 15 traditional districts exceeded 30% chronic absenteeism in 2023. Edgewood reported the county's highest traditional-district rate, followed by San Antonio ISD.
Rates differed across Edgewood subgroups
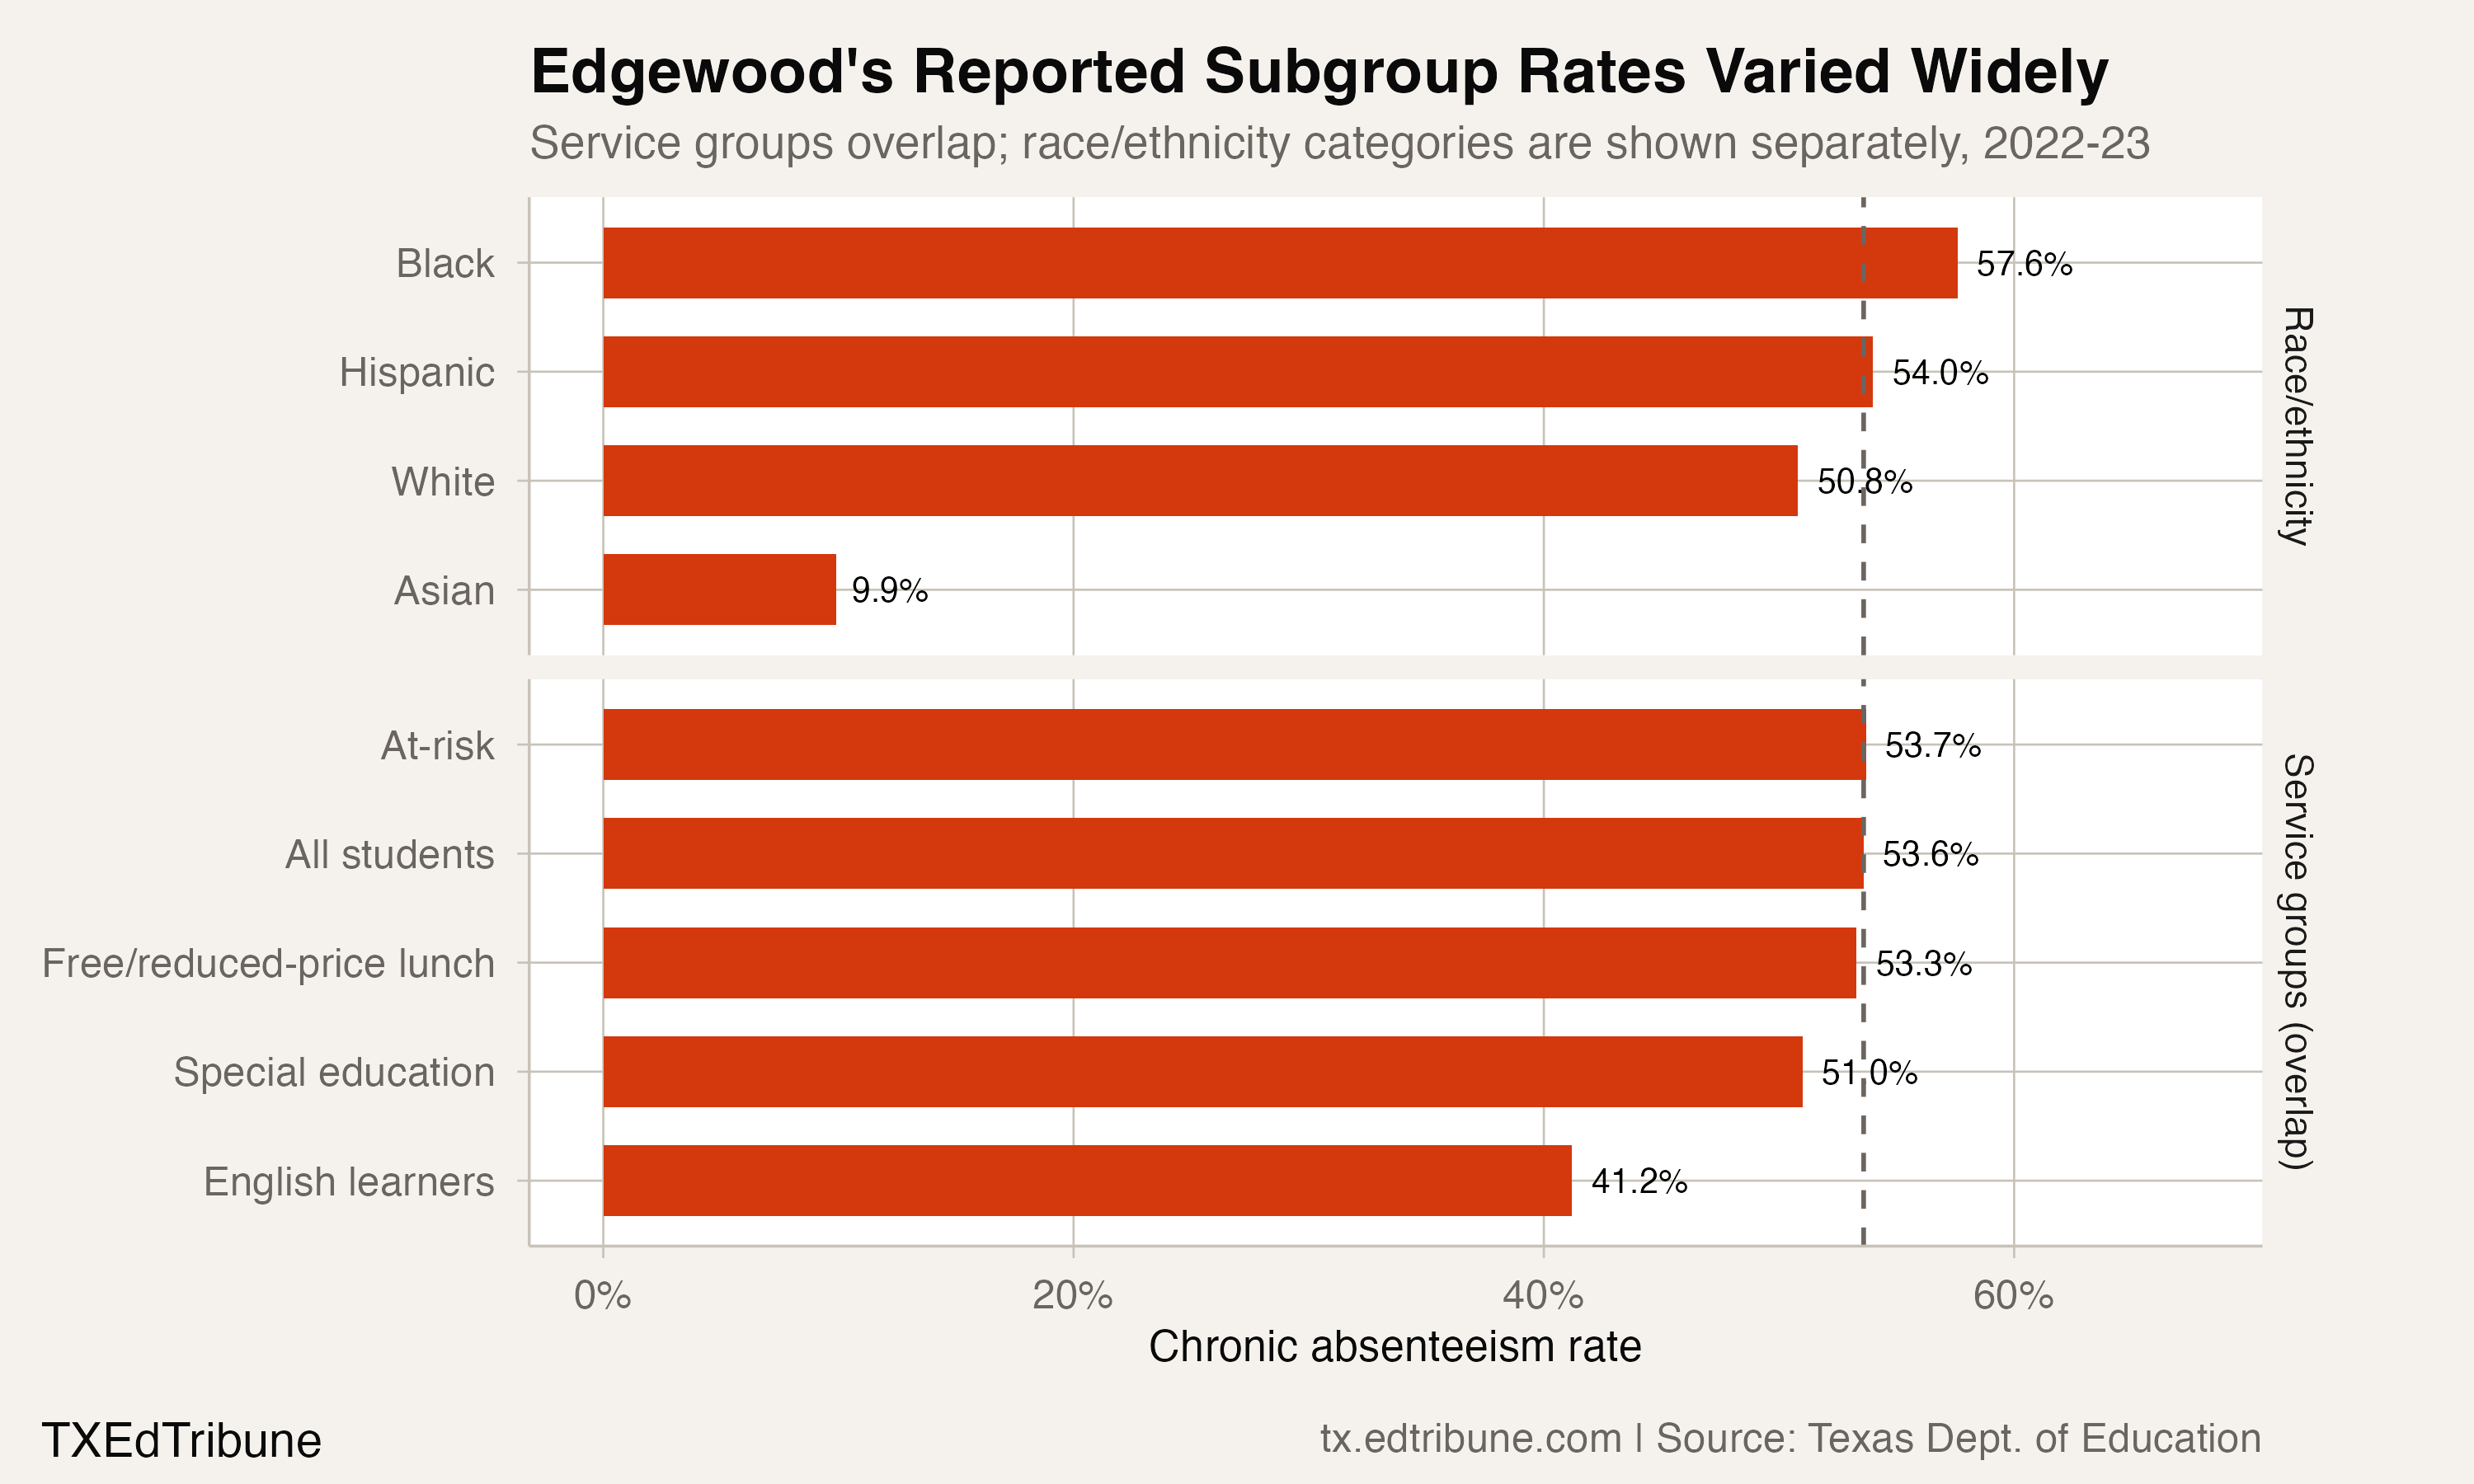
The 2023 package rows show an at-risk rate of 53.7% and a special education rate of 51.0%. Students qualifying for free or reduced-price lunch had a 53.3% rate, while English learners had a 41.2% rate. These service groups overlap with one another and with race and ethnicity categories.
Among the selected race and ethnicity rows, Hispanic students had a 54.0% chronic absenteeism rate. Asian students had a 9.9% rate, showing why the earlier claim that every subgroup exceeded the same threshold was wrong.
Attendance and district resources
Texas school funding is tied in part to average daily attendance, so persistent absence can reduce district revenue while increasing the need for attendance support. Texas Tribune reporting describes the funding pressure and the transportation, health and child care barriers districts are trying to address.
San Antonio ISD's 12.4-point decline shows how quickly a district's reported rate can move. Edgewood's 3.0-point increase in the same year shows that the local pattern was not uniform.
Detailed code that reproduces the analysis and figures in this article is available exclusively to EdTribune subscribers.
Discussion
Sign in to join the discussion.
Loading comments...