In 2022-23, one in four Texas special education students met the state's chronic-absence threshold. The rate was 25.0%, down from 31.6% in 2021-22 but above the 16.9% rate in 2018-19. All students were at 20.3%, leaving a 4.7-point gap.
Those figures describe attendance outcomes. The package does not identify the household, health, transportation or service-delivery mechanisms behind them.
The persistent gap
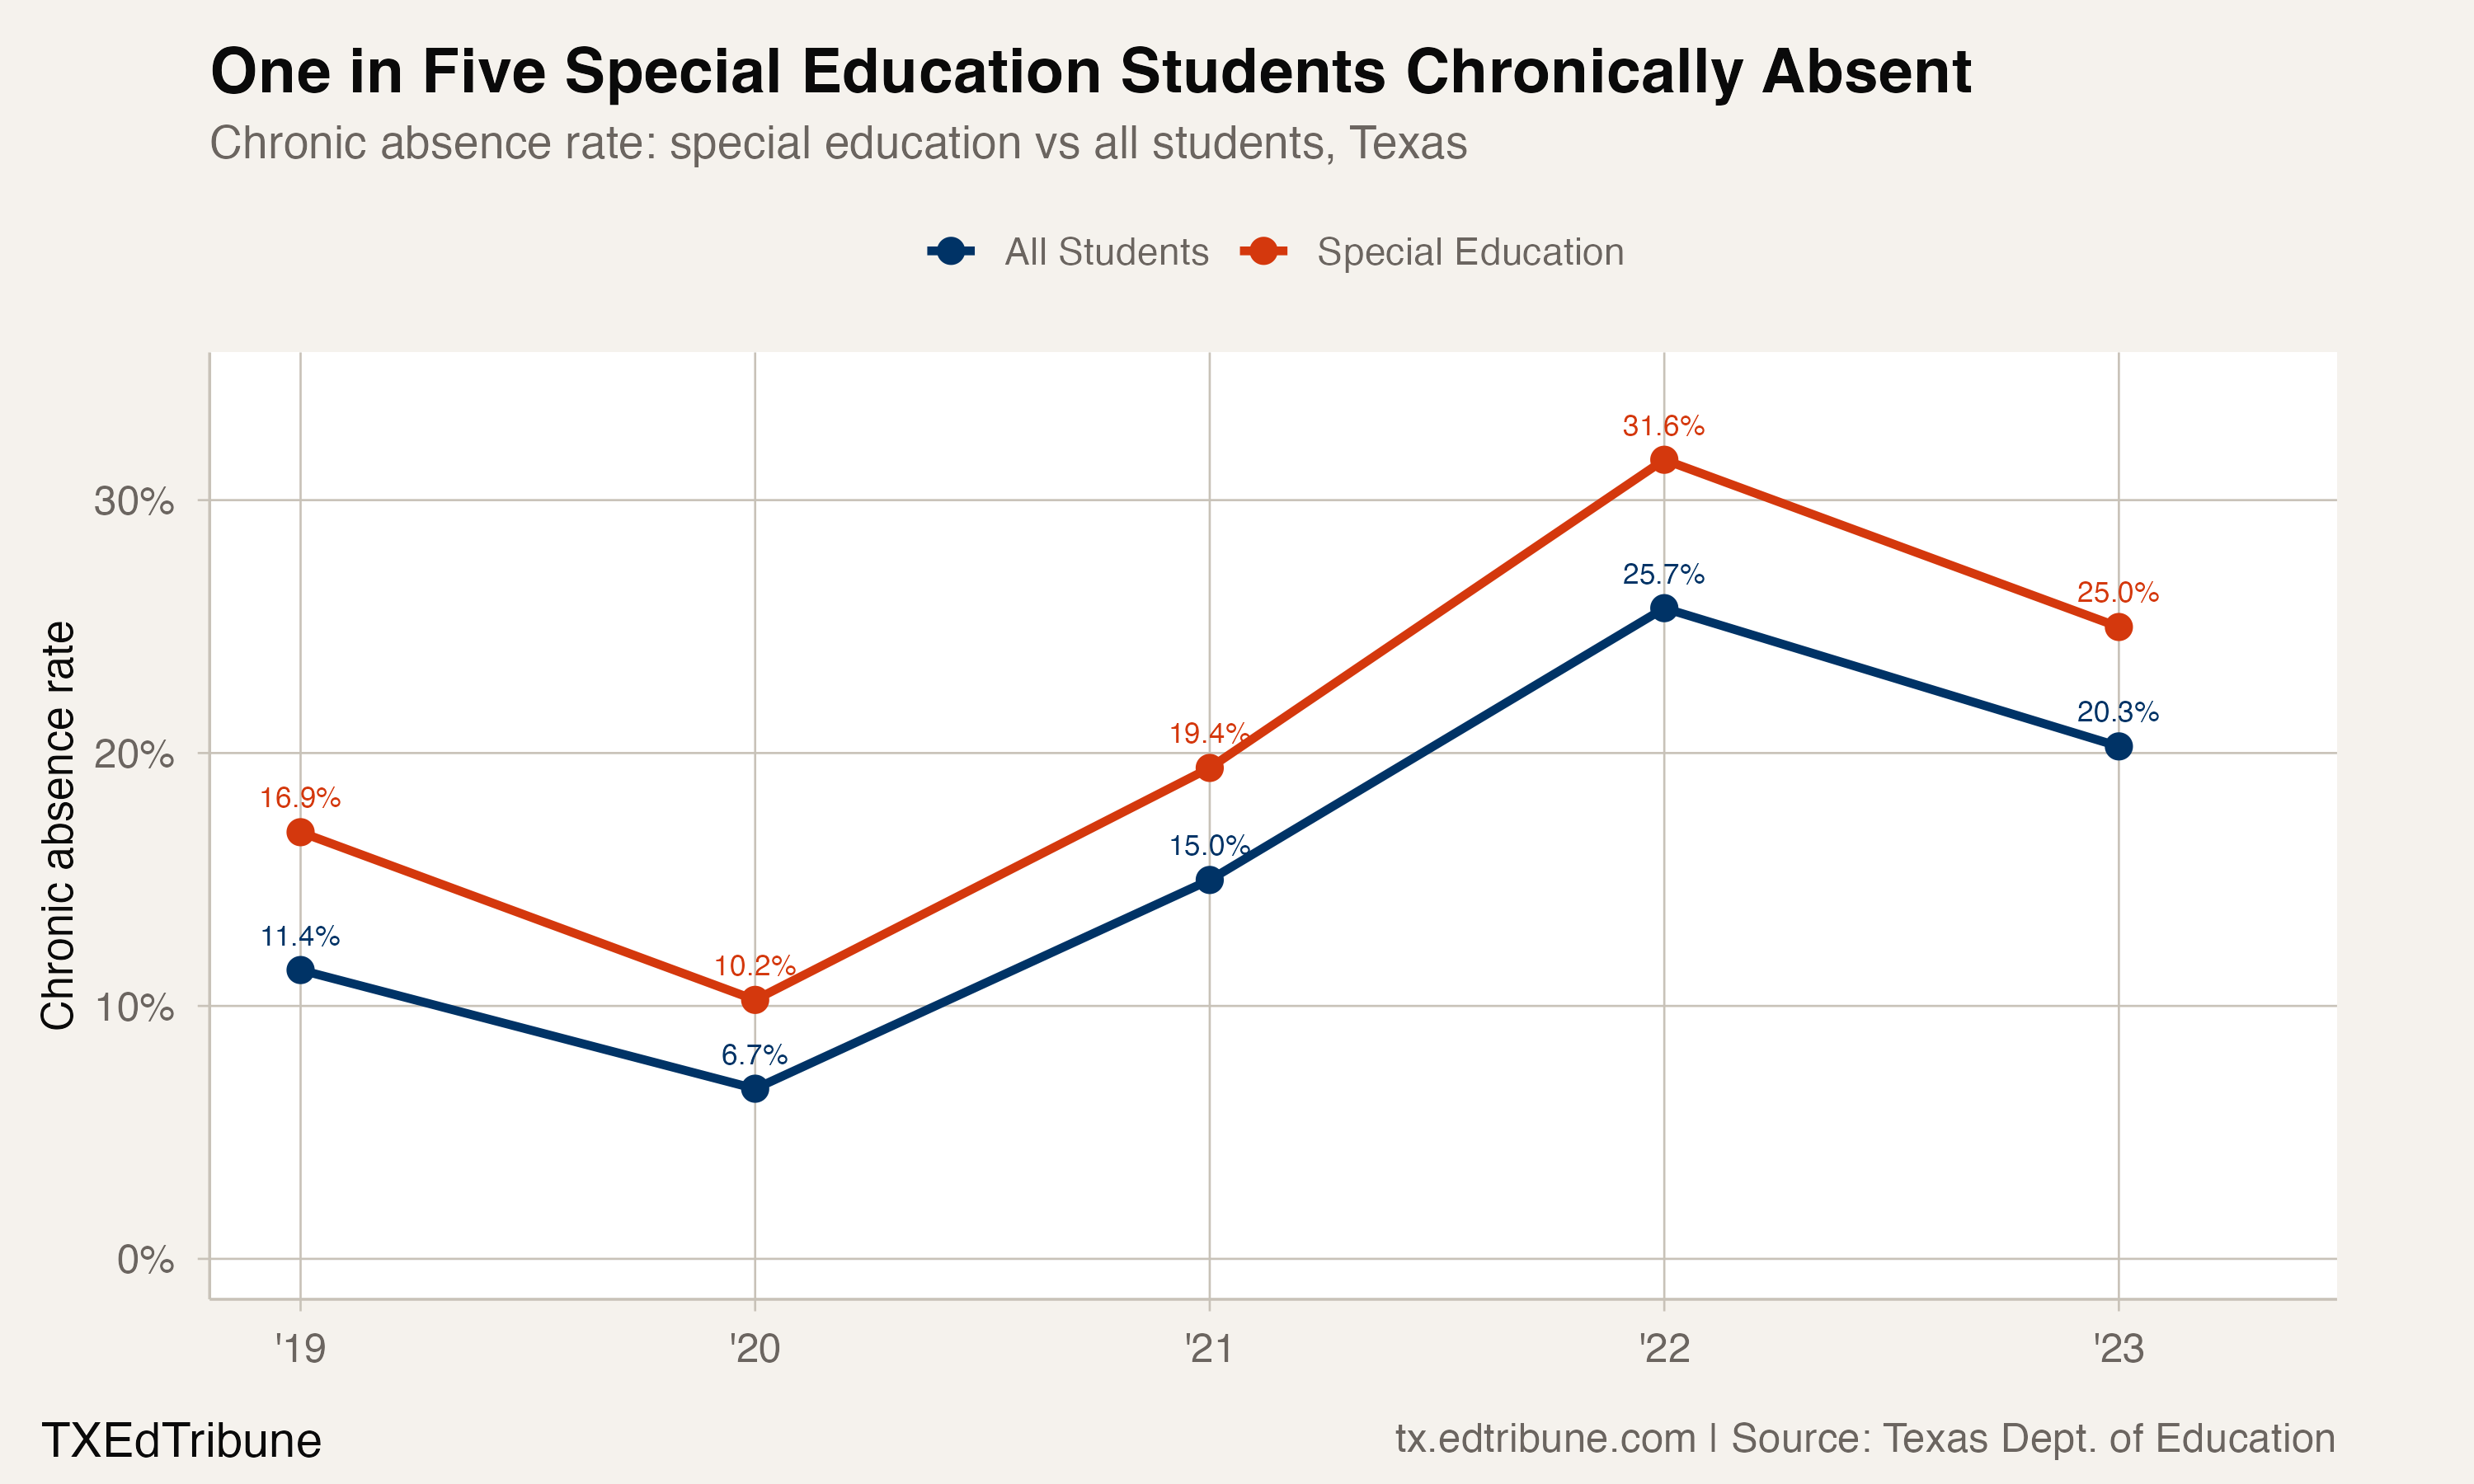
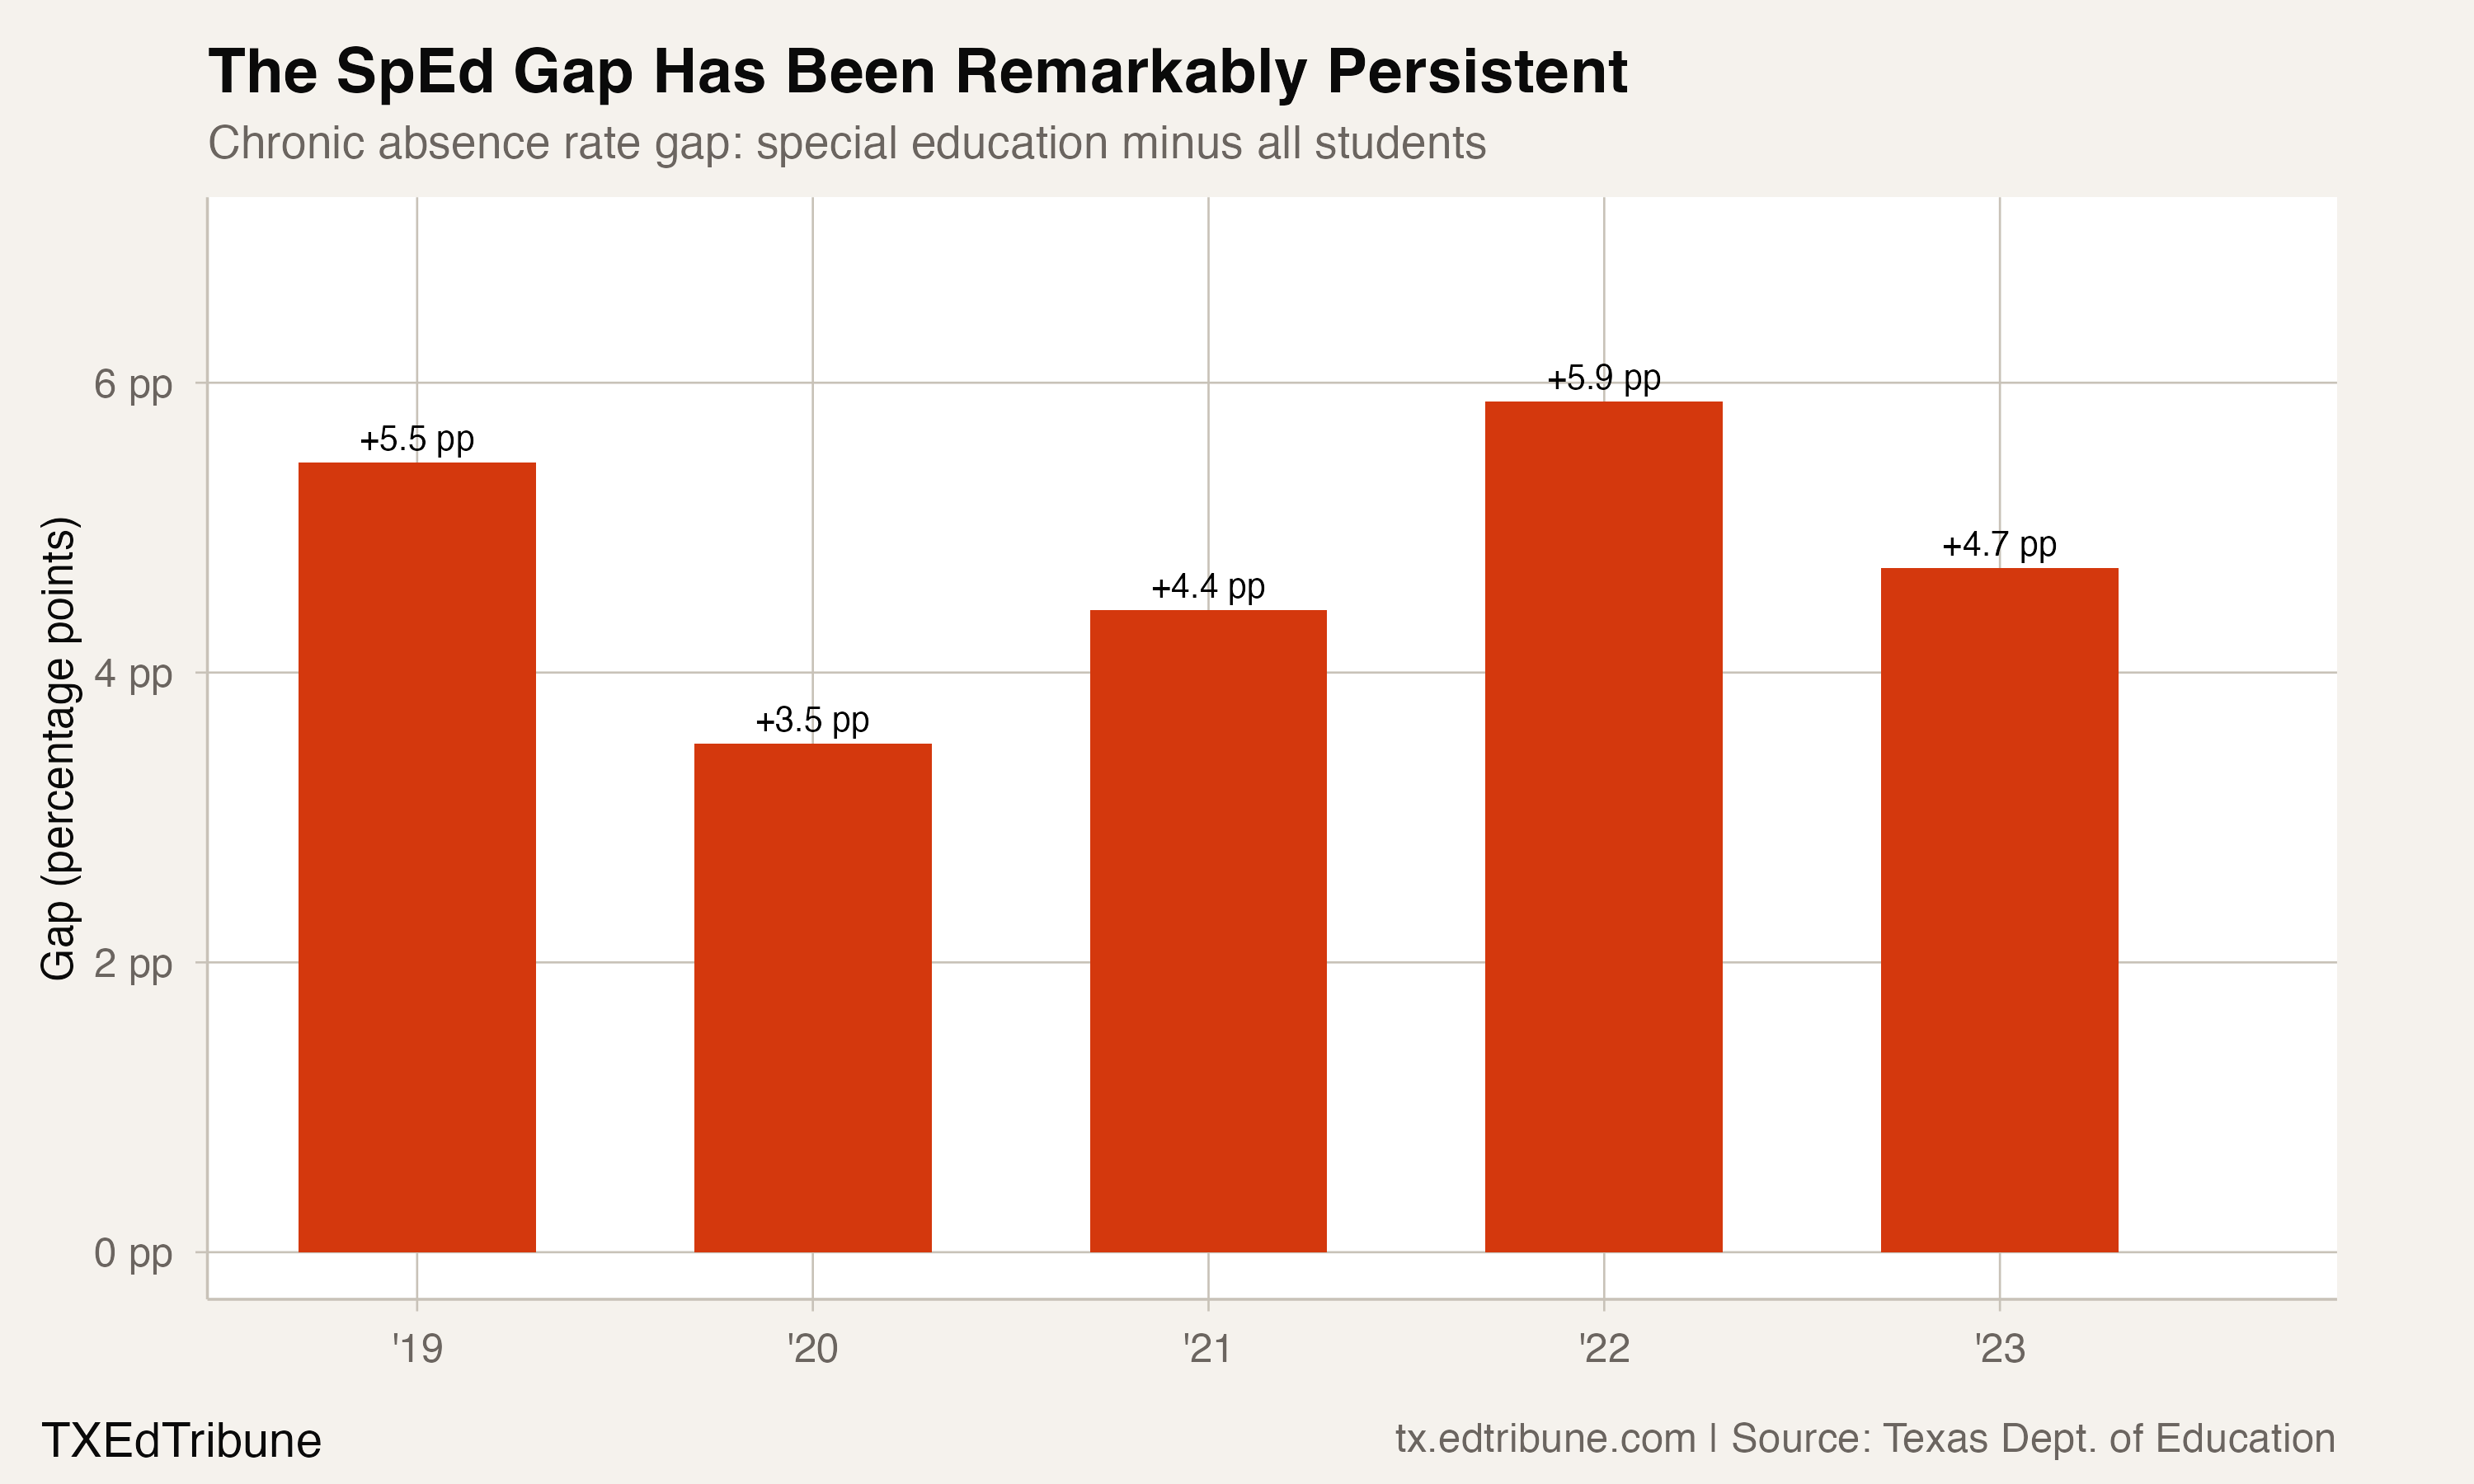
The SpEd chronic rate was above the overall rate in every year of the five-year series. Both rates peaked in 2021-22 and were lower in 2022-23. The gap ranged from 3.5 to 5.9 points, rising from 5.5 points in 2018-19 to 5.9 at the 2021-22 peak and settling at 4.7 in 2022-23.
| Year | Special Ed | All Students | Gap |
|---|---|---|---|
| 2018-19 | 16.9% | 11.4% | 5.5 pp |
| 2019-20 | 10.2% | 6.7% | 3.5 pp |
| 2020-21 | 19.4% | 15.0% | 4.4 pp |
| 2021-22 | 31.6% | 25.7% | 5.9 pp |
| 2022-23 | 25.0% | 20.3% | 4.7 pp |
From the 2021-22 peak to 2022-23, the special-education rate recovered 44.9% of the distance back toward its 2018-19 level. The overall rate recovered 38.2% by the same calculation. These are descriptive calculations, not explanations of why the rates moved.
Where special education fits among vulnerable populations
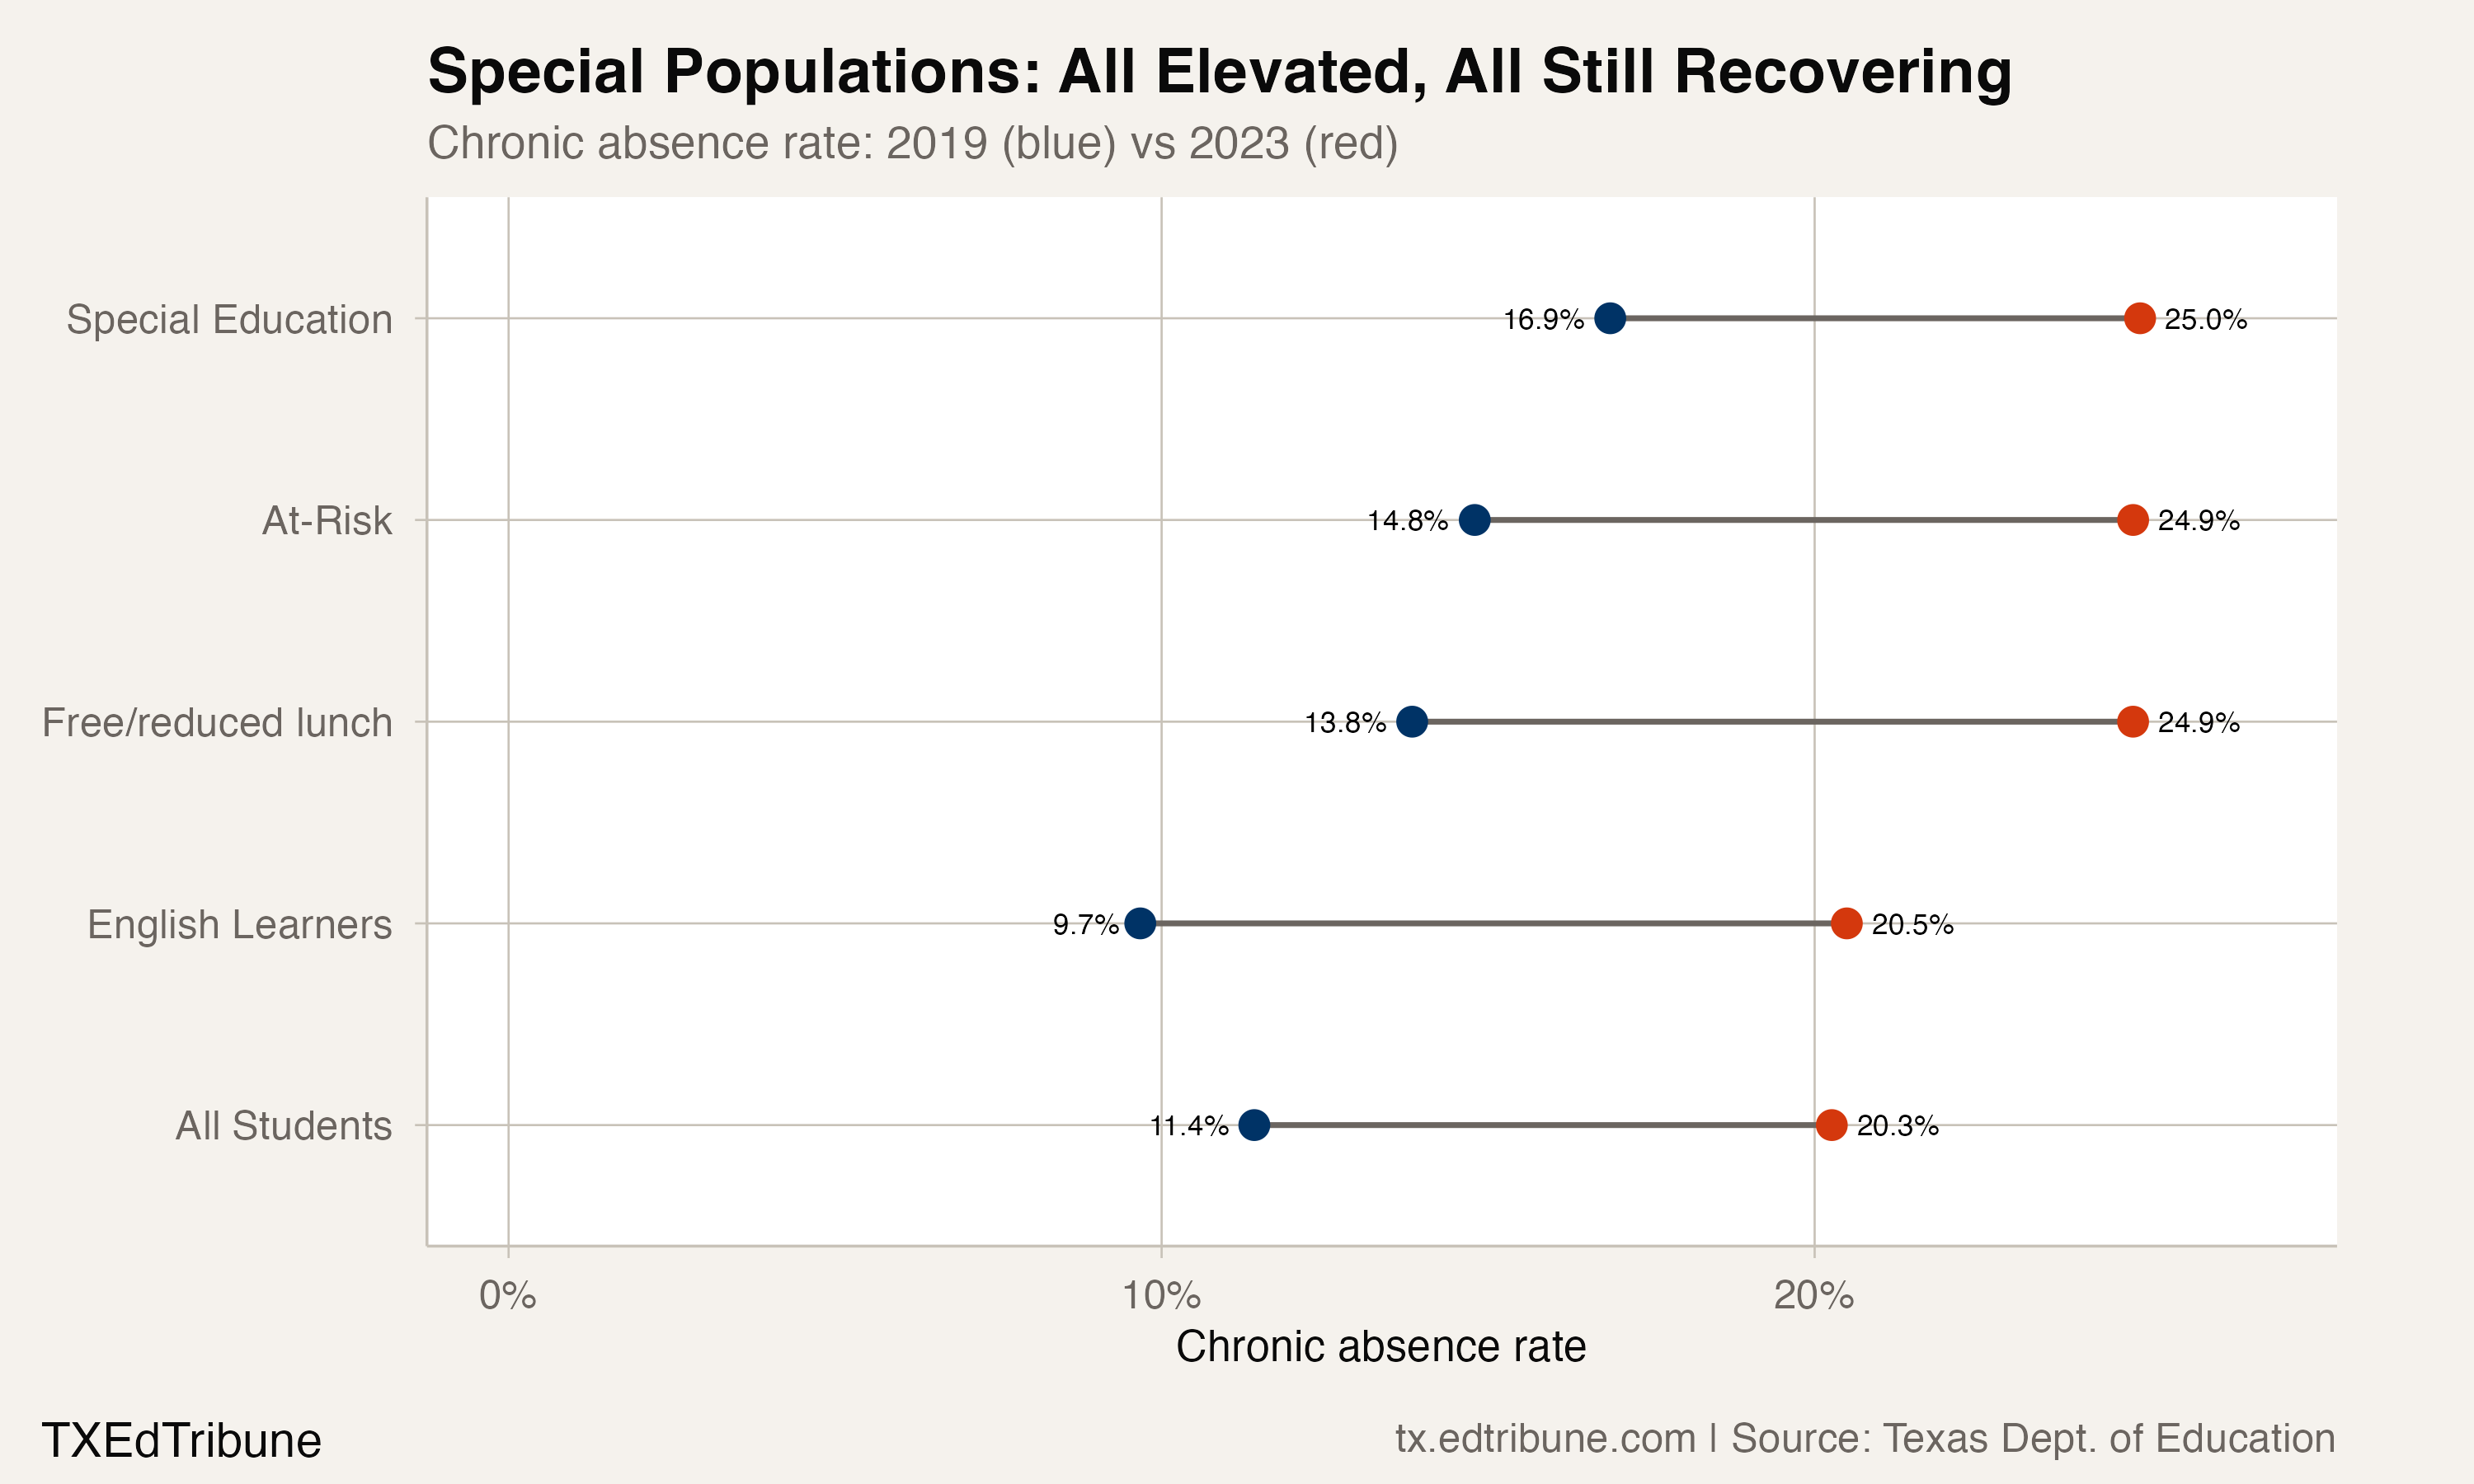
In 2022-23, the statewide special-education rate was 25.0%. Students receiving free or reduced-price lunch were at 24.9%, and at-risk students were at 24.9%. The package does not provide a person-level cross-tabulation, so these figures cannot show how much the groups overlap.
The trend chart shows both special-education and overall rates below their 2021-22 peaks in 2022-23. The attendance data do not measure the services a student received or missed.
Wide variation across districts
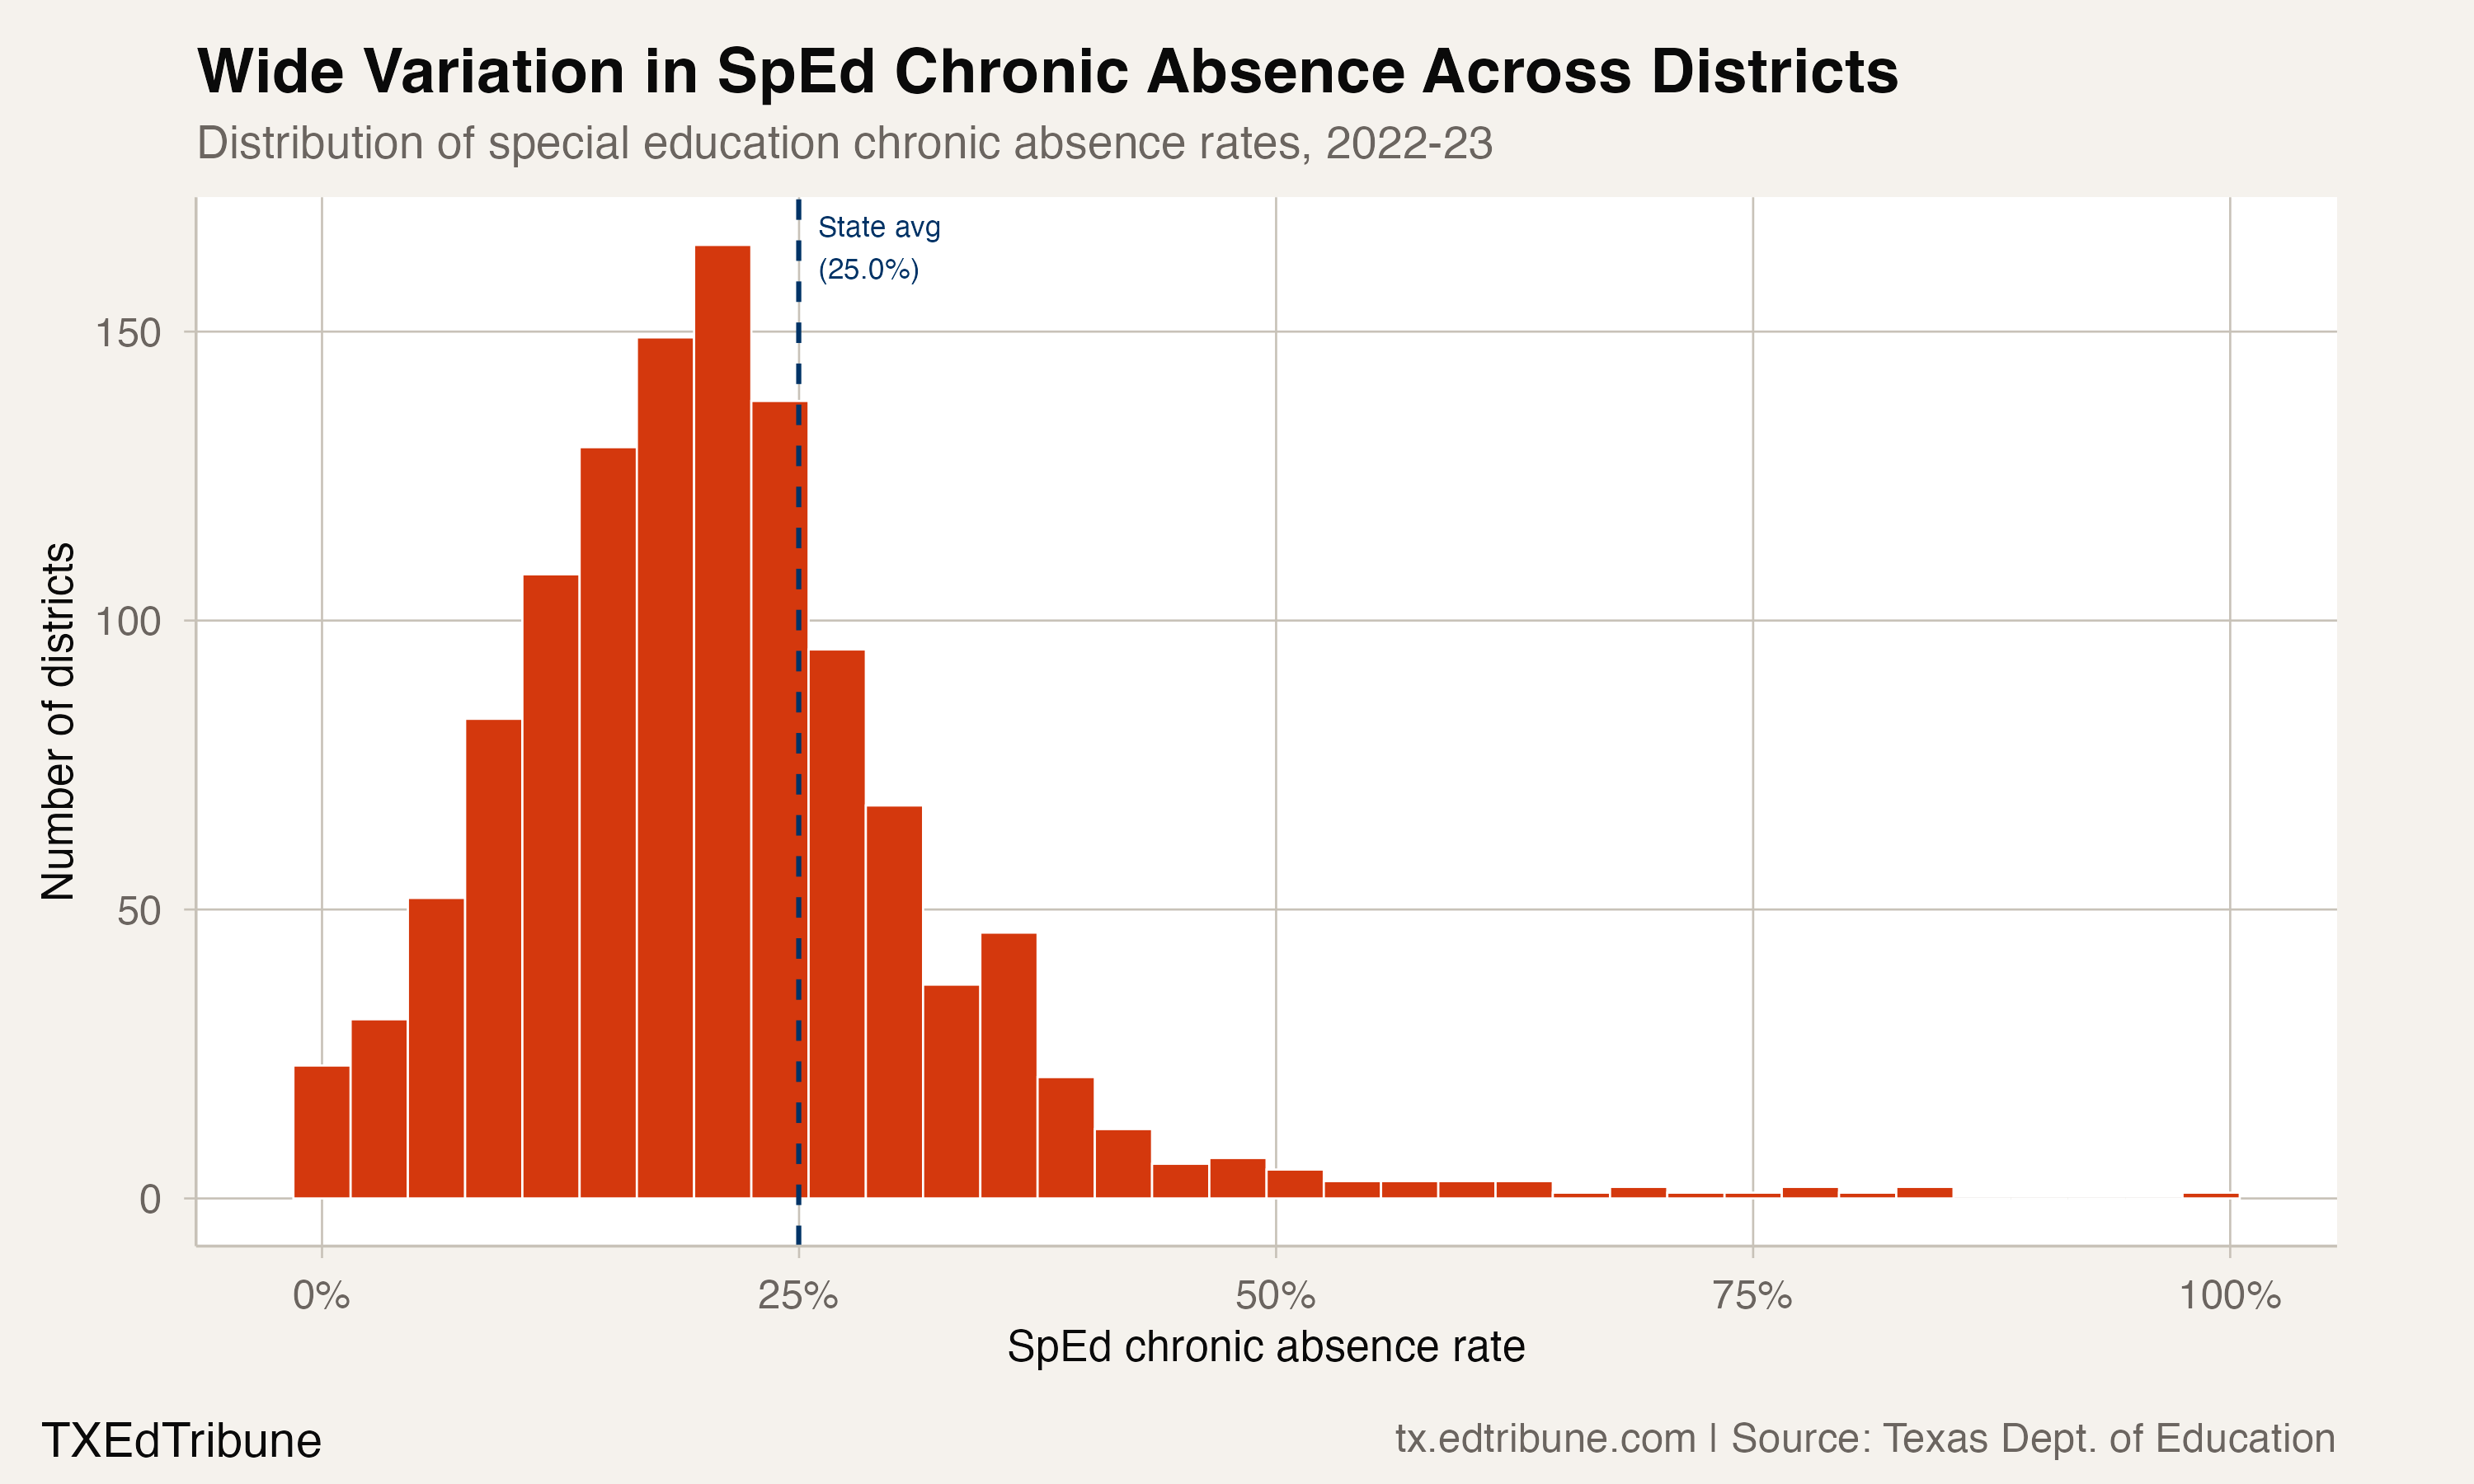
Among 1,199 districts with published special-education attendance data, reported rates ranged from 0.0% to 100.0%. Fifty-five districts were below 5%, while 26 were above 50%. Those are district-level ranges, not evidence about the reasons for any individual student's absences.
The district distribution shows the size of the range, but not its mechanism. It does not say whether a missed day corresponded to a missed instructional or related-service session, whether a session was rescheduled, or whether a student was entitled to compensatory services.
The most defensible reading is narrower: one quarter of Texas special-education students were chronically absent in the latest year in this package, and the rate remained above the all-student rate. The records do not support a claim about why.
Detailed code that reproduces the analysis and figures in this article is available exclusively to EdTribune subscribers.
Discussion
Sign in to join the discussion.
Loading comments...