In this series: Texas 2025-26 Enrollment.
Half the students in Dallas ISD↗ET are classified as English learners. Not in a magnet program or a single campus, but across the entire district: 70,422 students who need language support services in a system of 139,776. Twenty years ago, that share was 30.6%.
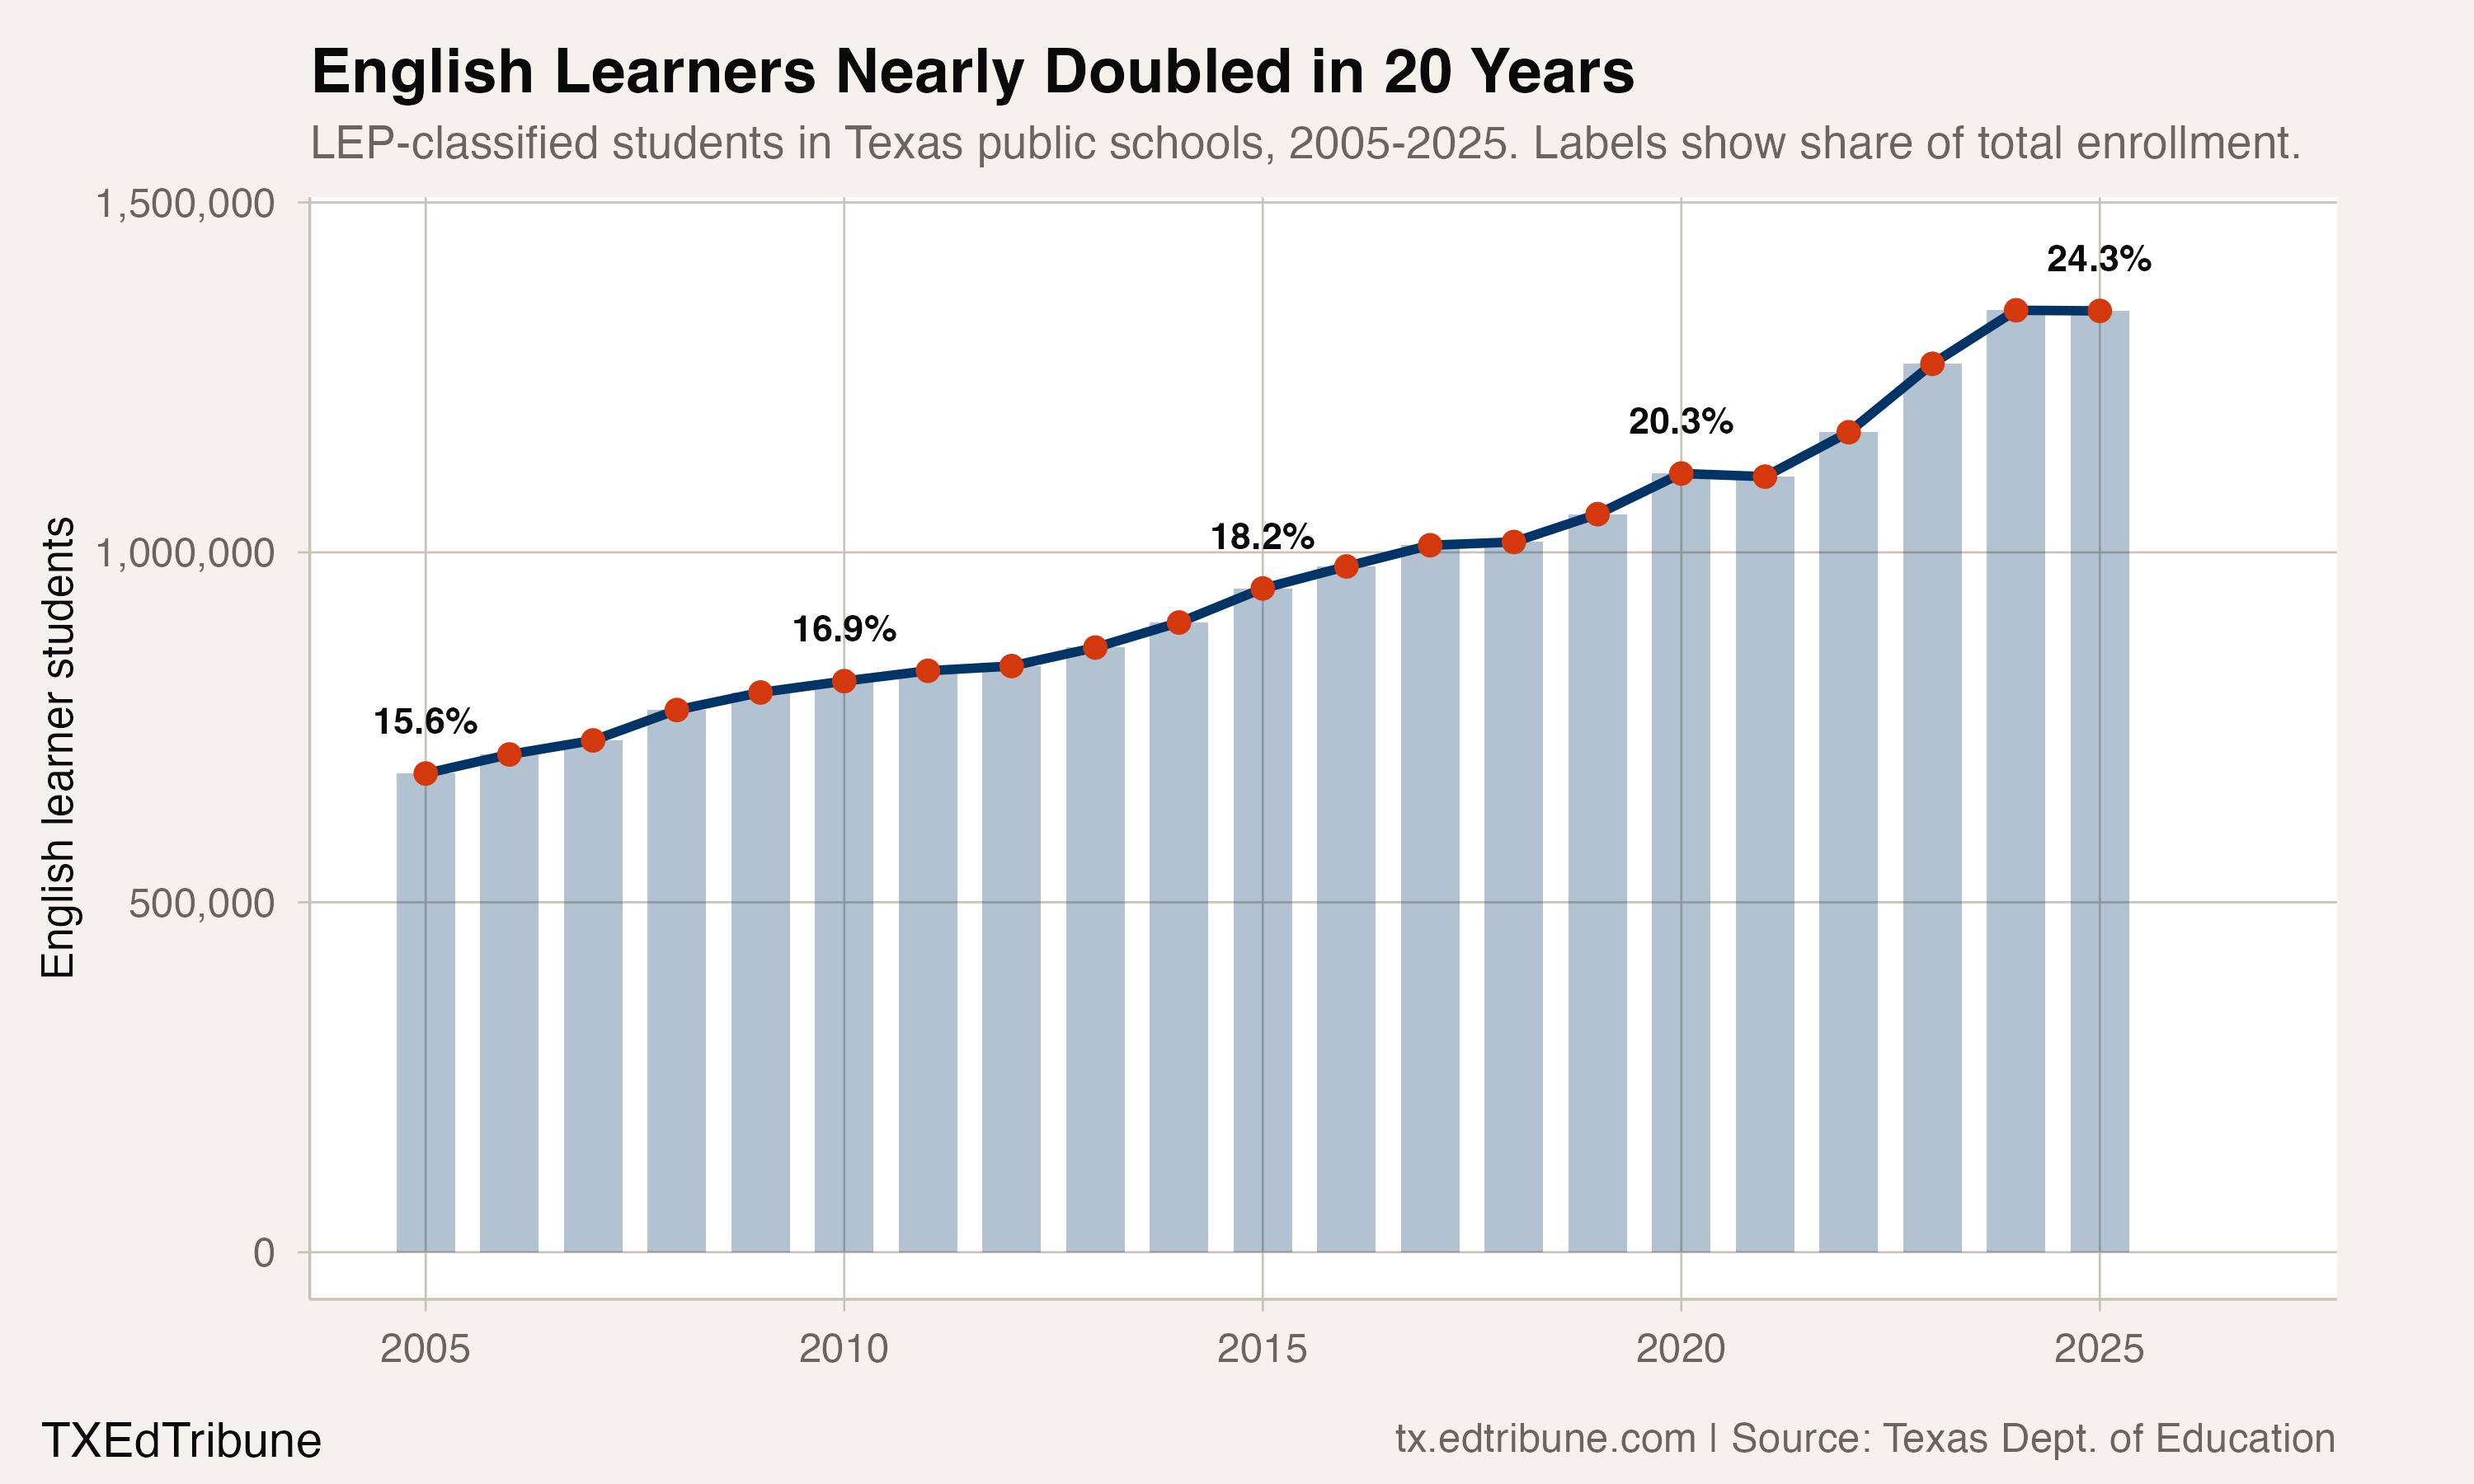
Dallas is not an outlier. It is the leading edge of a transformation that has reshaped every corner of Texas public education. In 2024-25, 1,345,031 students statewide were classified as limited English proficient, 24.3% of all enrollment. One in four. The state added 661,024 English learners over two decades, a 96.6% increase, while total enrollment grew just 26.2%.
The fastest-growing student population in the state
The raw numbers are staggering, but the acceleration since 2020 is what should command attention. Between 2019-20 and 2024-25, Texas added 232,357 English learners. Over the same period, total enrollment grew by just 51,326. English learner growth was 4.5 times larger than total enrollment growth. If EL-classified students had merely held their 2020 share, Texas would have about 220,000 fewer students in language support programs.
The growth accelerated sharply after the pandemic. From 2015 to 2020, LEP enrollment grew by 164,283. From 2020 to 2025, it grew by 232,357, a 41% faster pace. The single largest annual jump came in 2022-23, when Texas added 97,747 English learners in a single year, an 8.3% increase that dwarfed every prior year.
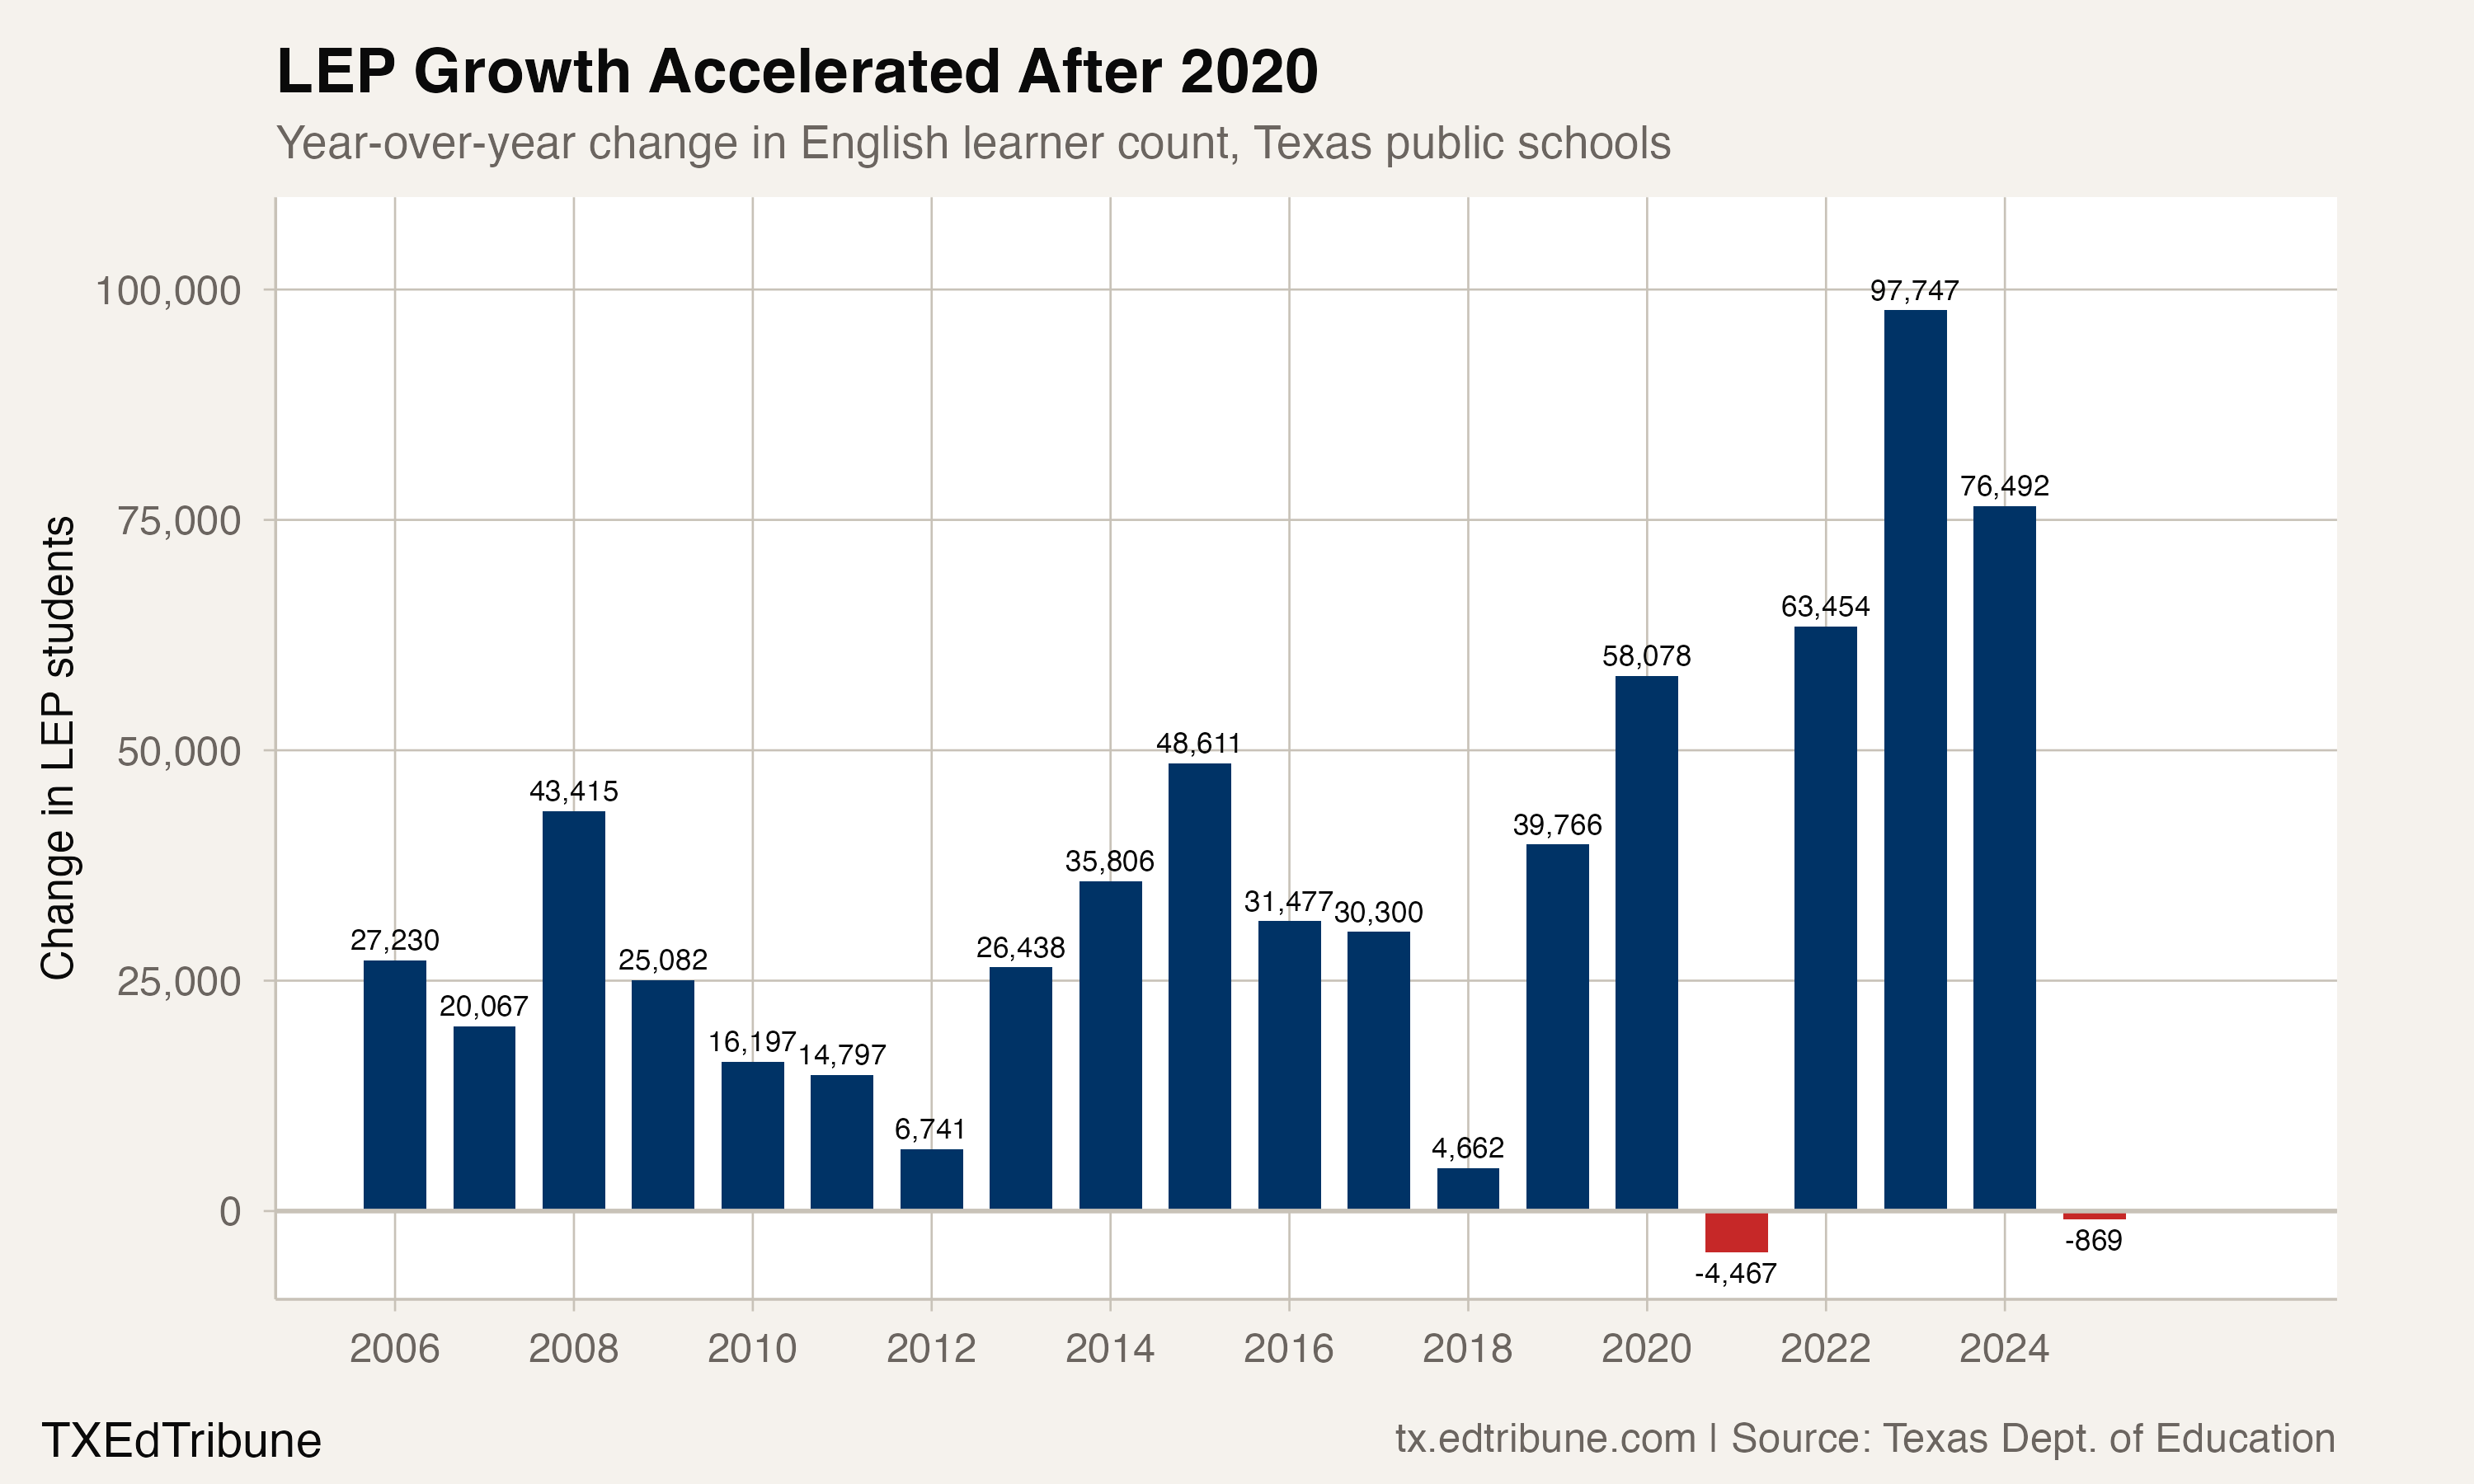
Then, in 2024-25, the count dropped by 869 students, the first dip since the COVID year of 2020-21. At 24.3%, the statewide LEP share ticked down from 24.4% the year before. Whether this is a plateau or a one-year pause will shape the next decade of Texas school finance.
Arrivals, identification, or both
The most contentious question in Texas EL policy is how much of this growth represents new students arriving in schools versus existing students being identified at higher rates. The enrollment data alone cannot answer it, but one metric offers a partial signal.
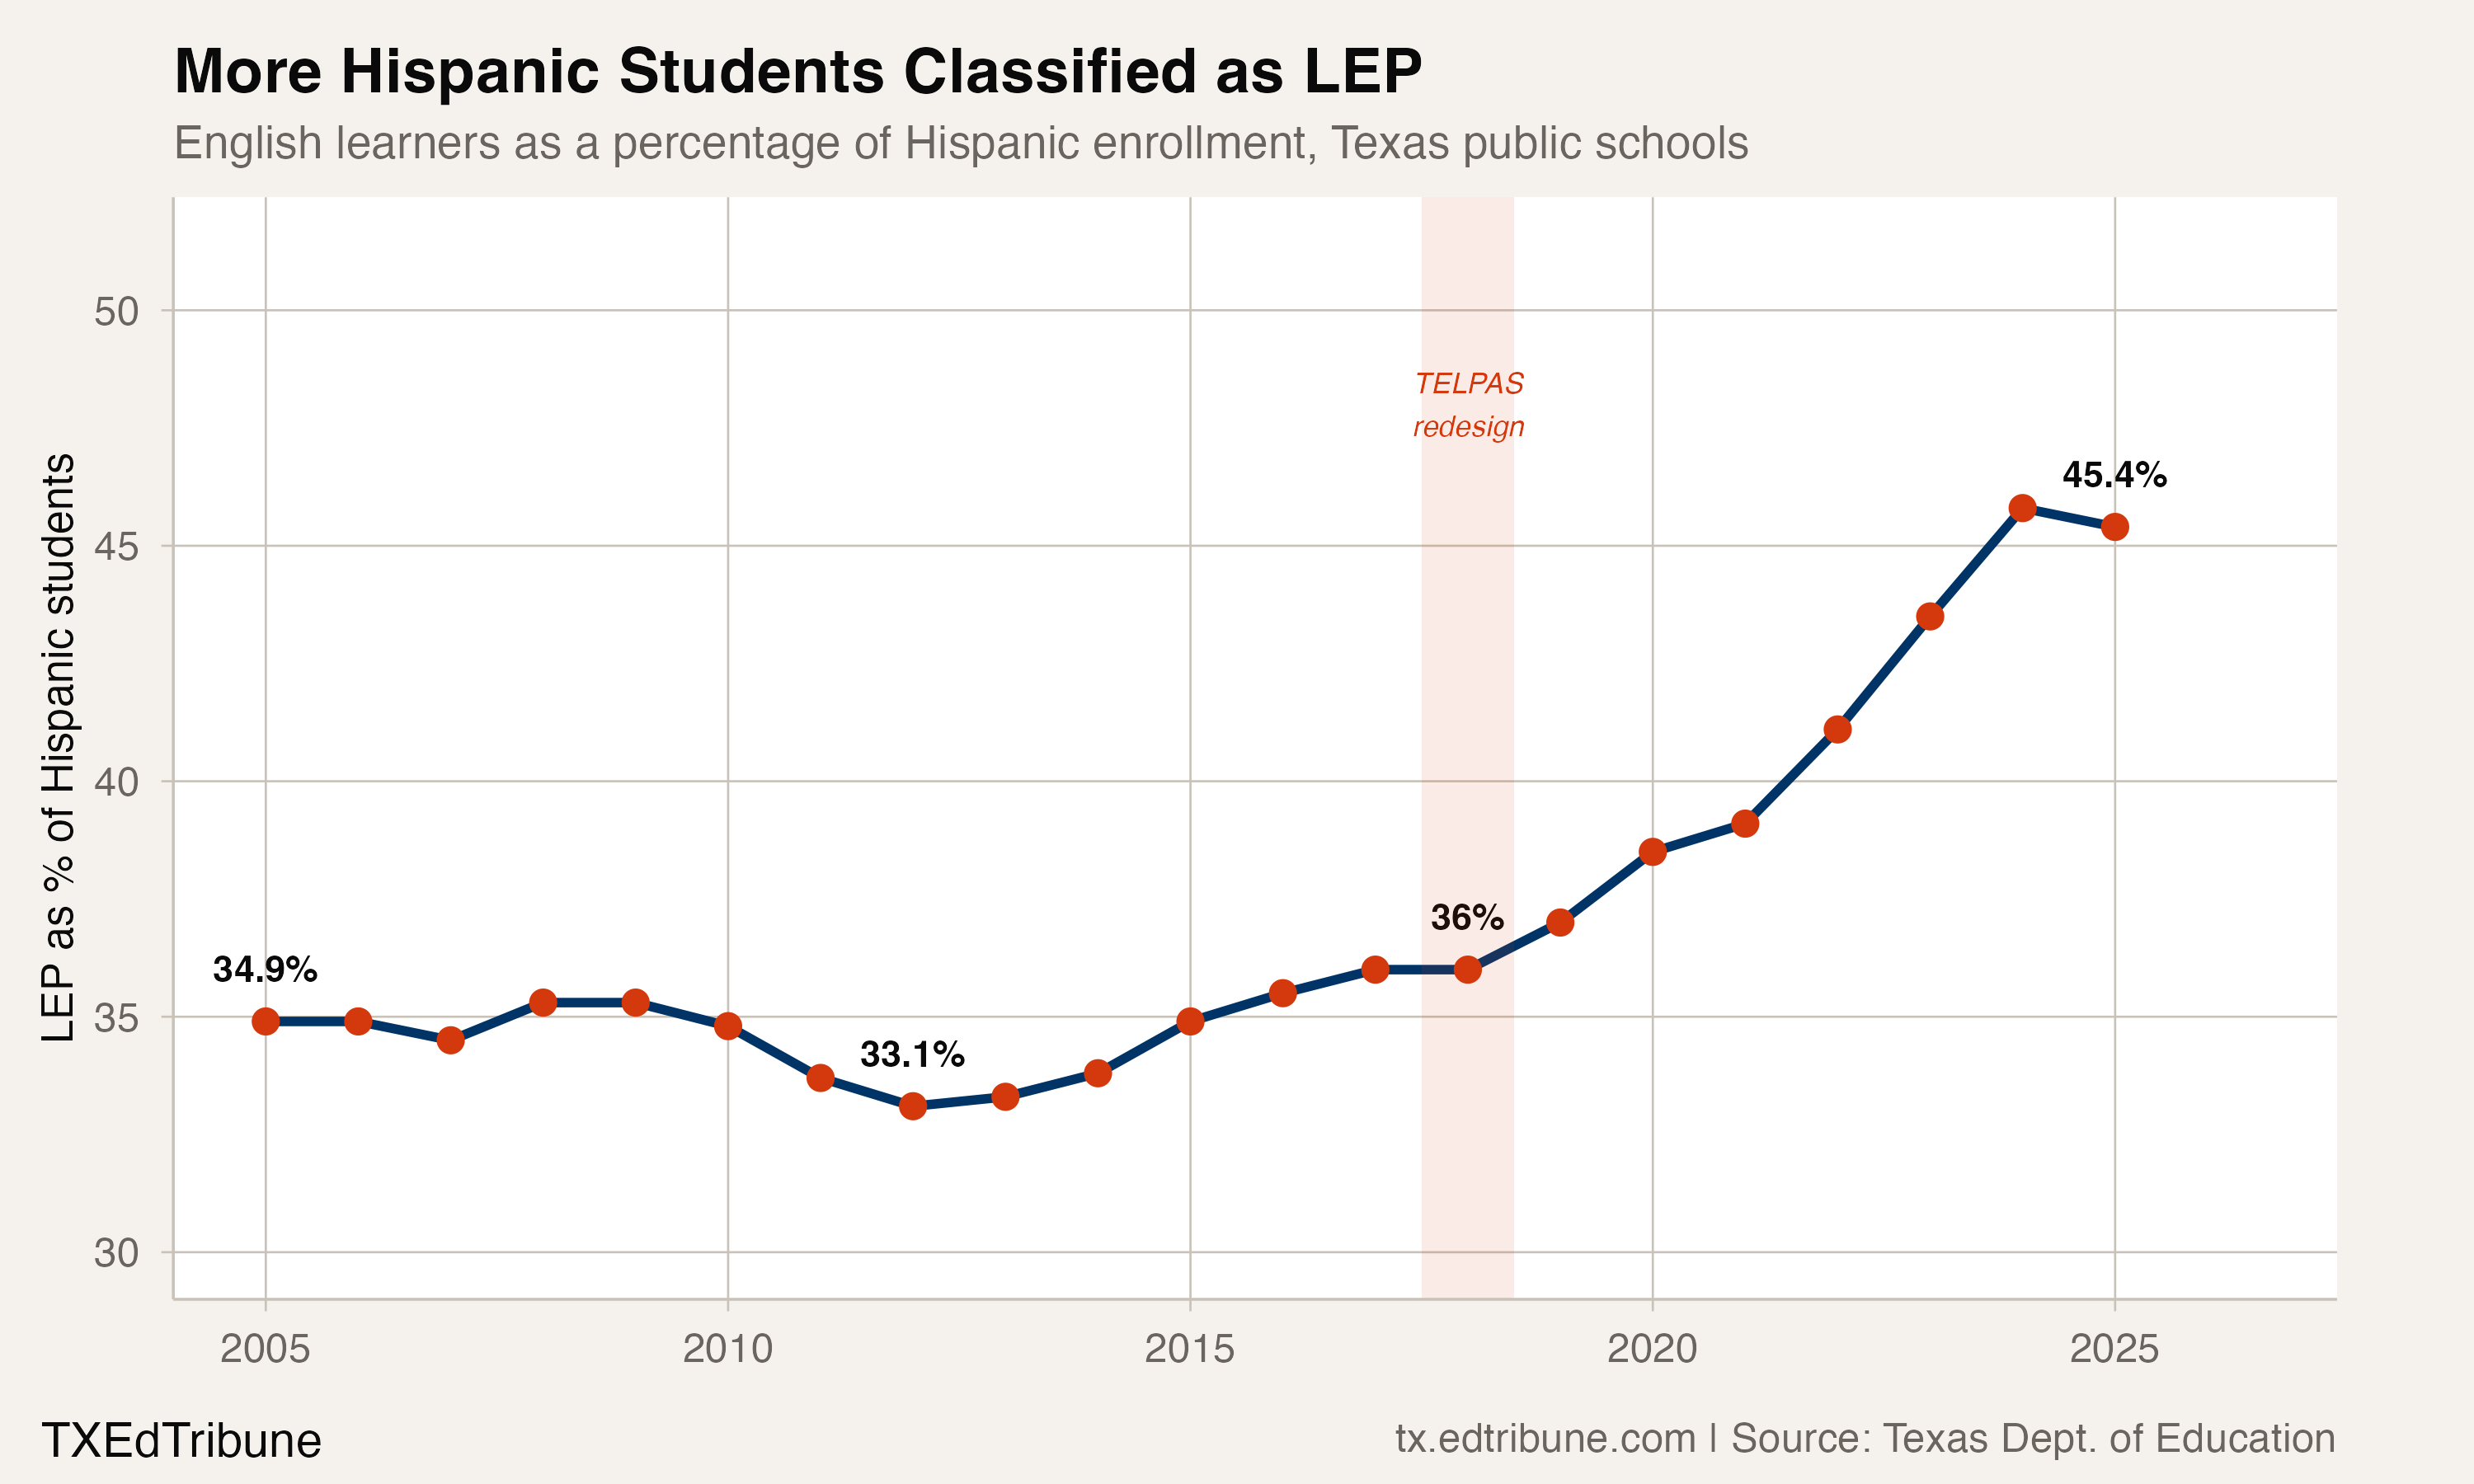
In 2005, English learners represented 34.9% of all Hispanic students in Texas. That ratio held remarkably stable through 2018, never rising above 36%. Then it surged: to 38.5% in 2020, 43.5% in 2023, and 45.8% in 2024. Nearly half of all Hispanic students in Texas are now classified LEP, up from roughly a third.
If the growth were driven entirely by newly arrived immigrant families, you would expect the LEP-to-Hispanic ratio to remain relatively stable, since both numerator and denominator would grow together. The sharp rise suggests something else is happening: either more existing Hispanic students are being identified as English learners, or newly arrived families have higher LEP classification rates than settled Hispanic families, or reclassification out of LEP status has slowed.
The reclassification explanation has direct evidence behind it. A study by IES's Regional Educational Laboratory Southwest found that the share of Texas English learners reclassified as English proficient dropped from 11.8% in 2017-18 to 4.2% in 2020-21, a decline of 7.6 percentage points. The 2018 redesign of TELPAS, the state's English language proficiency assessment, was a likely contributor. Research from Rice University's Kinder Institute found that among first-graders in the 2018-19 cohort, 83% remained unclassified before middle school, compared to 48% of the 2011-12 cohort.
Slower reclassification does not mean students are not learning English. It means they stay classified as LEP longer, which inflates the count. Immigration is certainly a factor too. Immigration accounted for nearly 57% of Texas's new residents between 2023 and 2024, according to the Texas state demographer. But the data makes clear that reclassification policy, not just new arrivals, is a substantial driver of the headline number.
The suburban front line
The districts absorbing the most English learners are not all border communities. They are the fast-growing suburbs of Houston, Dallas, and Austin where immigrant families increasingly settle directly, bypassing the urban core.
Katy ISD↗ET, west of Houston, had 4,678 English learners in 2005, 10.6% of enrollment. By 2025, it had 23,488, a share of 24.5%. Cypress-Fairbanks ISD↗ET went from 10,821 (13.7%) to 24,907 (21.2%). Prosper ISD↗ET, in Collin County north of Dallas, saw its LEP count more than quadruple from 956 to 4,316 in five years, its share jumping from 5.7% to 13.7%.
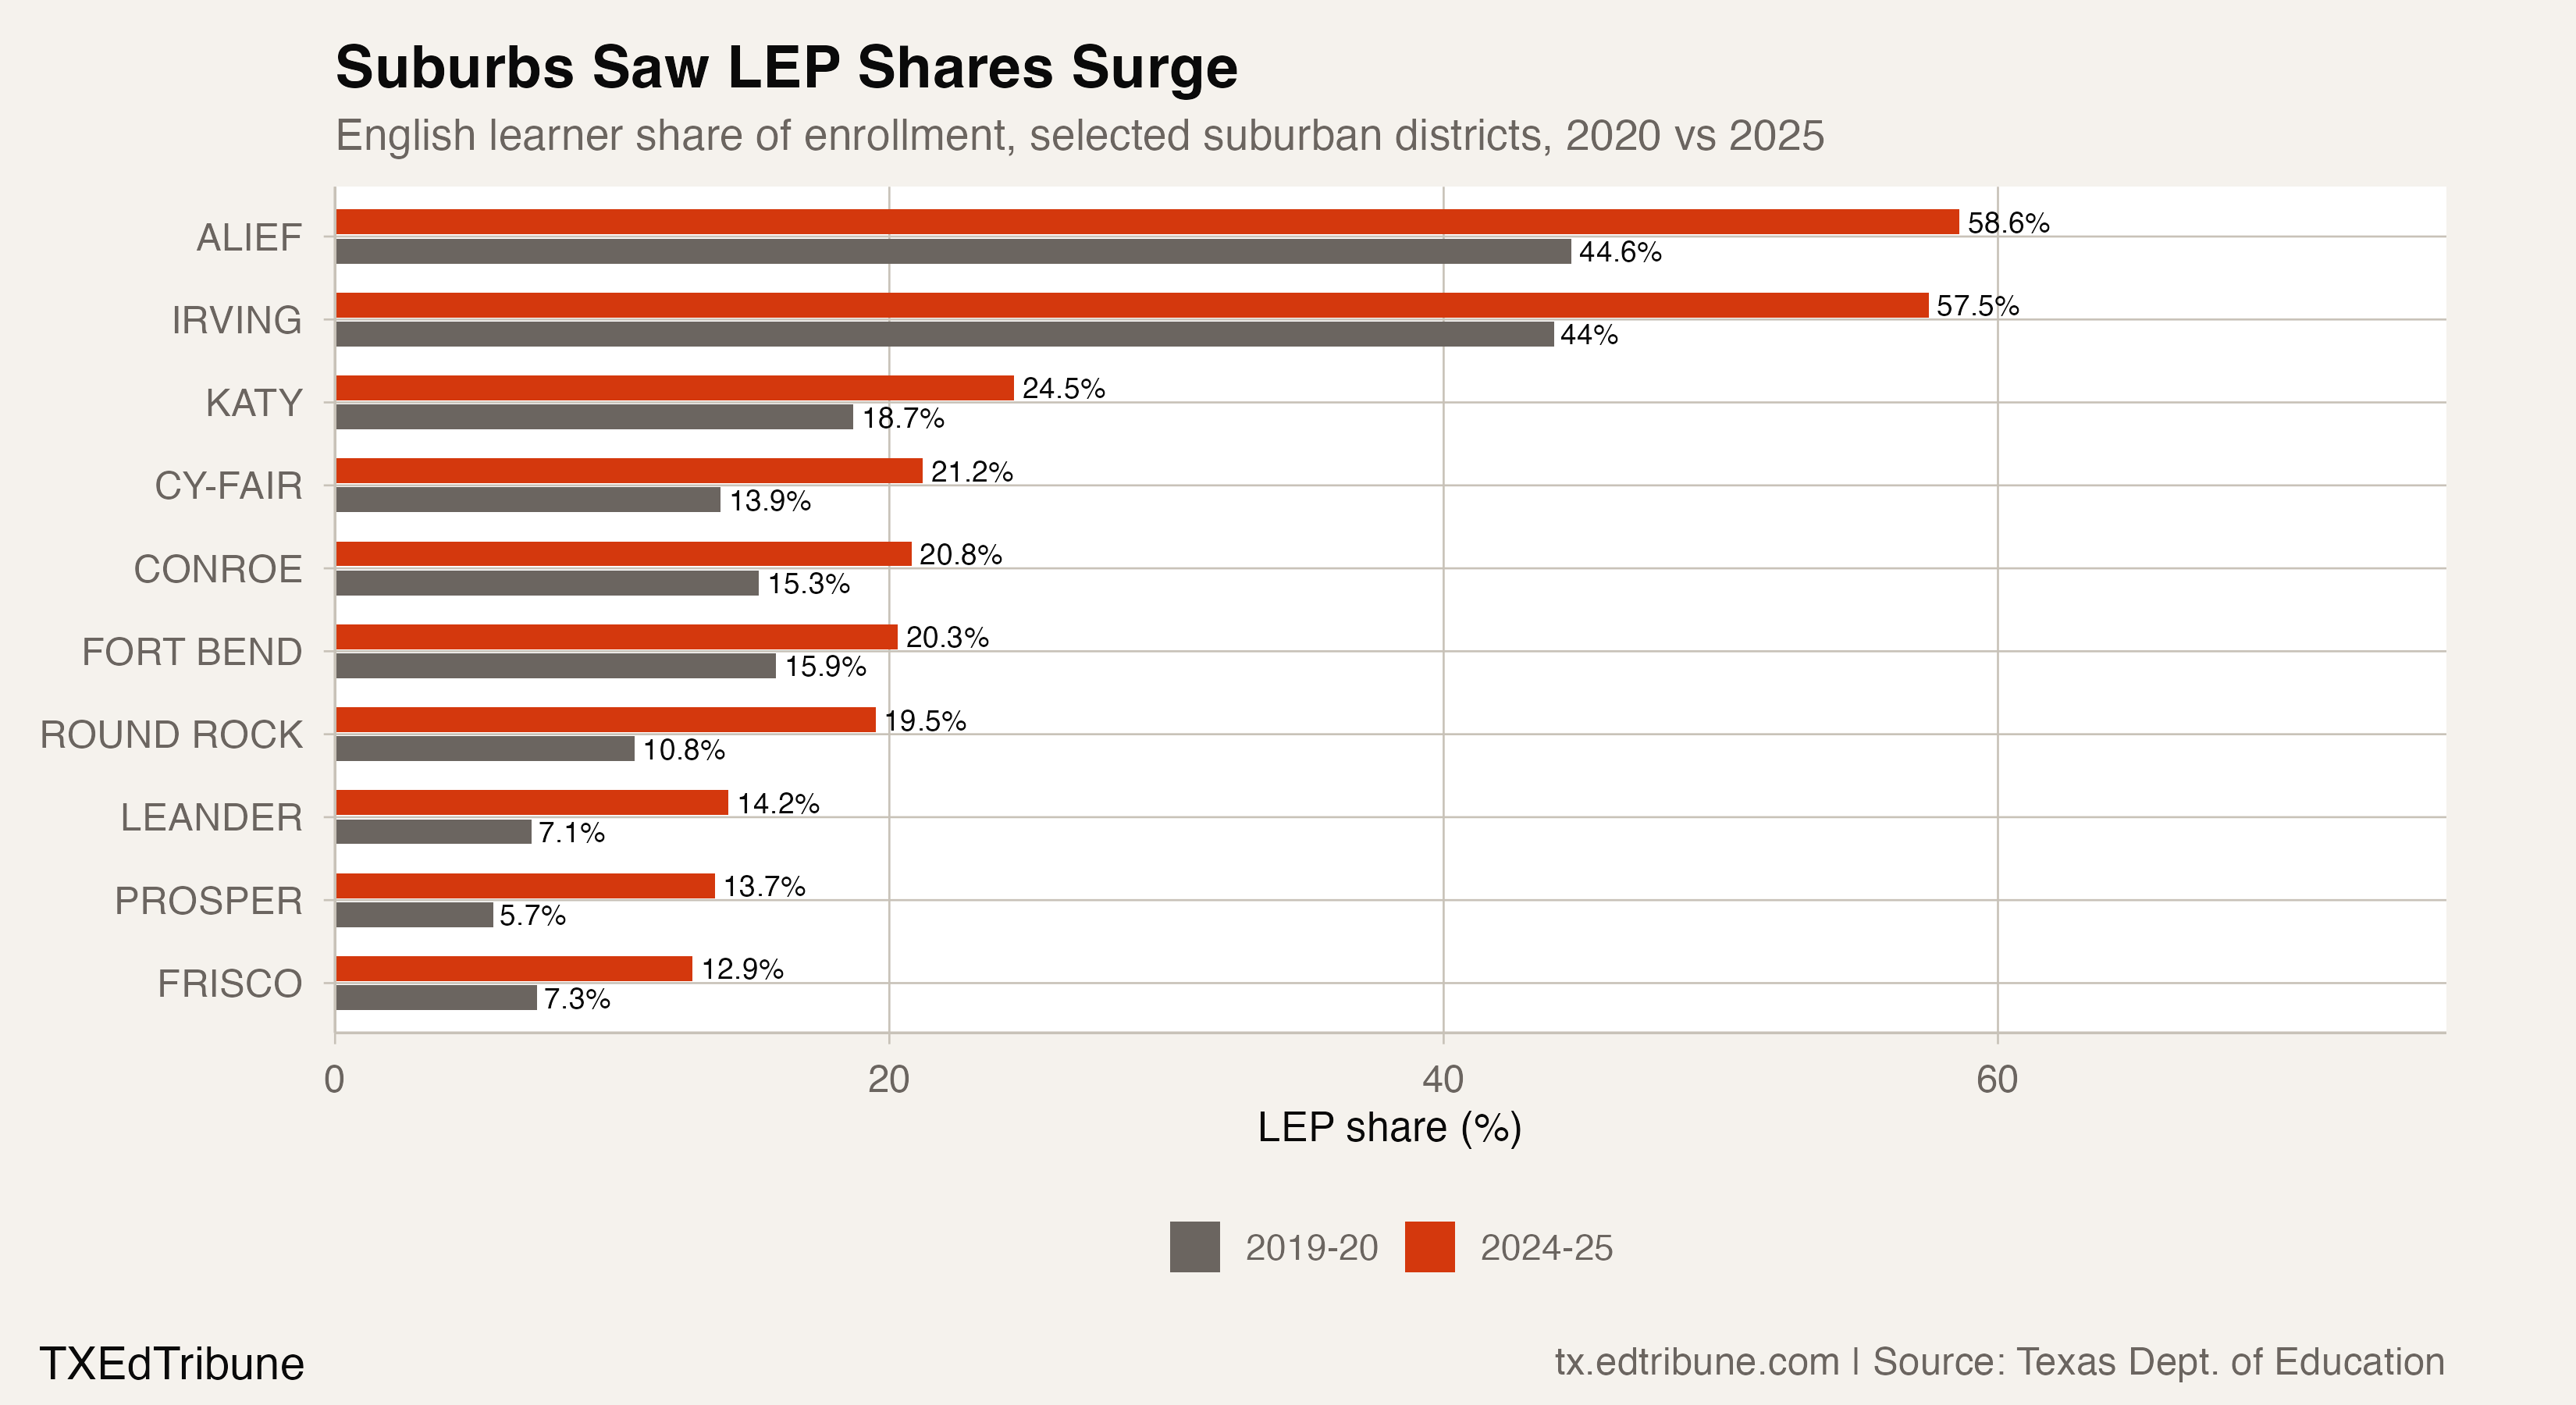
Cleveland ISD↗ET, northeast of Houston in Liberty County, went from 47.0% to 62.8% LEP in five years. Alief ISD↗ET, inside the Houston metro, reached 58.6%. Irving ISD↗ET, between Dallas and Fort Worth, hit 57.5%. These are not small programs operating at the margins of a district. In 54 Texas districts, a majority of students are now classified as English learners.
The charter sector is growing fast on the same axis. IDEA Public Schools↗ET added 16,671 English learners between 2020 and 2025, the largest absolute gain of any entity in the state, and its LEP share rose from 38.2% to 44.8%.
Where the teachers are not
The surge in English learners has collided with a persistent shortage of certified bilingual educators. The Intercultural Development Research Association reports that only 22% of Texas's emergent bilingual students are enrolled in dual language immersion programs, the approach most recommended by researchers for achieving bilingualism and biliteracy. The rest are in transitional bilingual or ESL pullout programs that research consistently finds less effective.
"Bilingual education is more than a quality education program, it is a civil right." -- IDRA policy brief, citing Lau v. Nichols (1974)
Texas's bilingual education allotment, restructured under HB 3 in 2019, provides a 0.1 weight on the basic allotment for most EL program models and 0.15 for dual language immersion. But per-pupil spending has not increased since 2019, according to analysis by the Kinder Institute, even as the population needing services has grown by more than 230,000 students.
The staffing gap is acute in suburban districts that built their infrastructure for a different student body. A district like Round Rock ISD↗ET, where LEP share jumped from 10.8% to 19.5% in five years, must recruit bilingual-certified teachers into a labor market where every neighboring district faces the same need.
The twelve largest EL programs
Houston ISD↗ET carries the second-largest EL program in the state at 69,145 students (39.3%), up from 28.5% in 2005. Fort Worth ISD↗ET reached 42.2%. Across the top 12 districts by EL count, every single one saw its LEP share rise over the past five years.
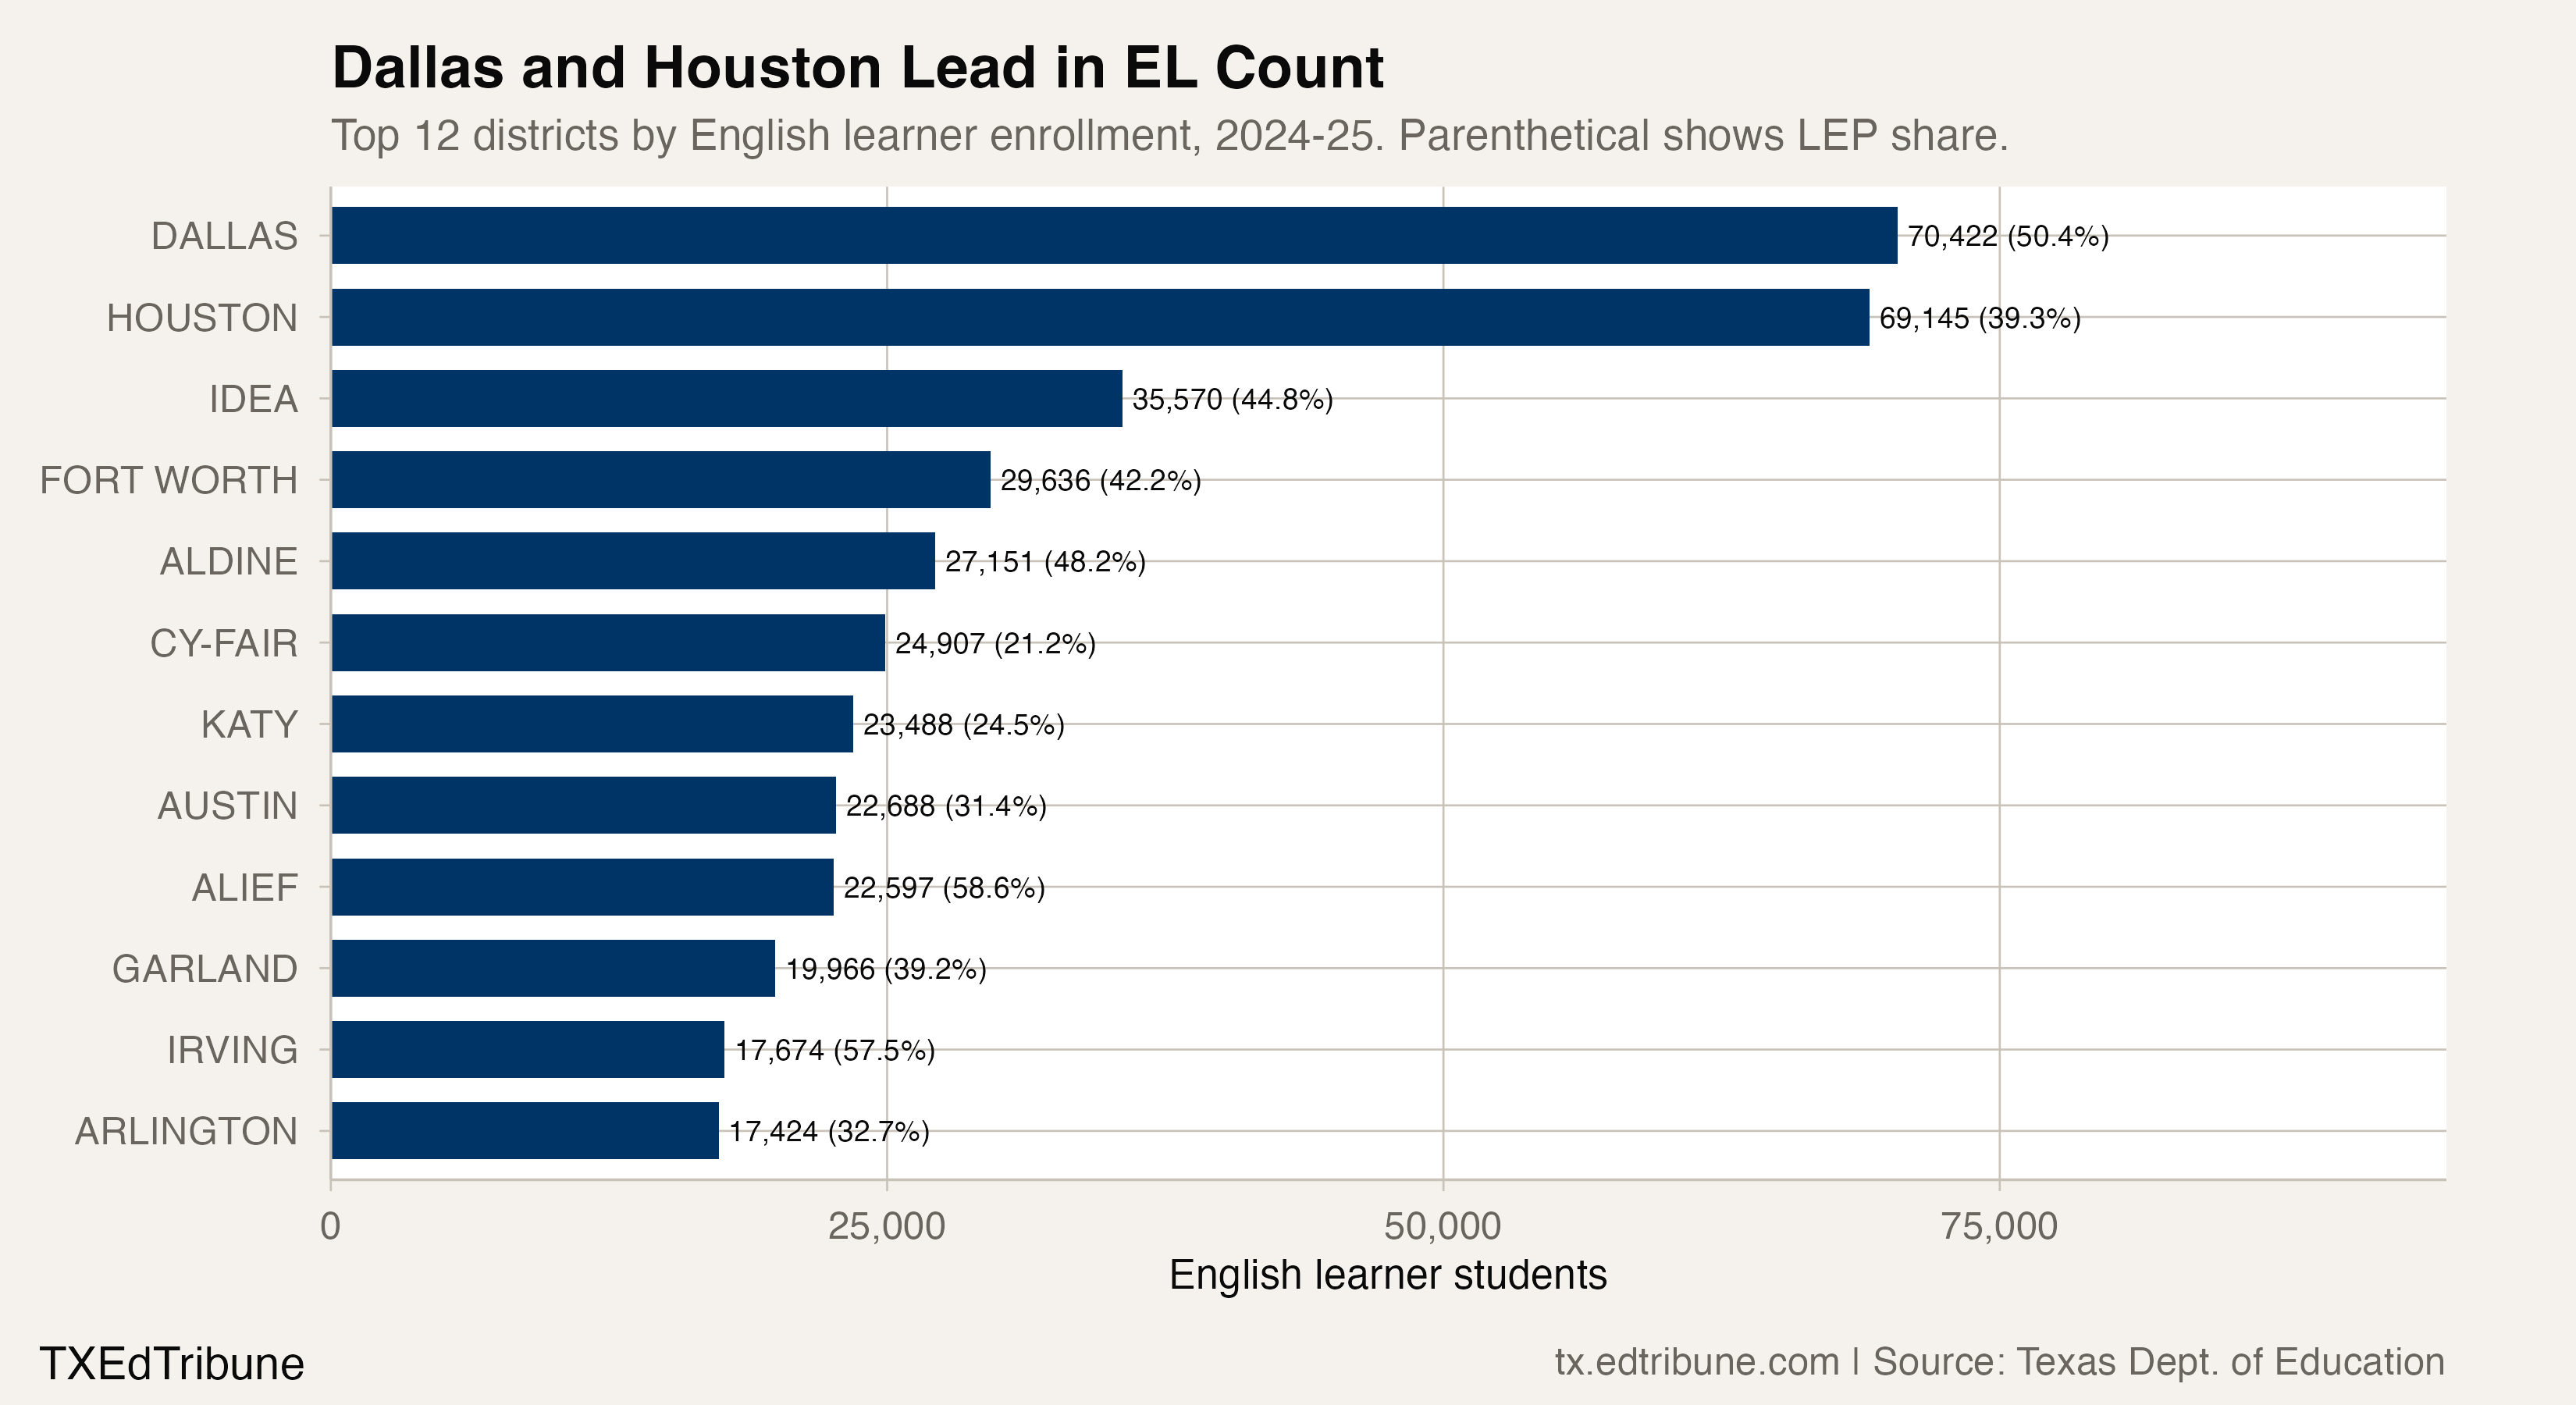
The concentration is notable. Dallas and Houston alone account for 139,567 English learners, more than 10% of the statewide total. Add IDEA Public Schools, Fort Worth, Aldine, Cy-Fair, and Katy, and seven entities account for 280,319 students, roughly 21% of all Texas EL enrollment.
What the first plateau signals
The 869-student decline in 2024-25, from 1,345,900 to 1,345,031, could be statistical noise. Or it could mark the beginning of a deceleration. Border encounters dropped substantially in late 2024 and early 2025, which would reduce new enrollments with a lag. If reclassification rates stabilize or improve under the latest TELPAS framework, exits from LEP status could begin to offset new identifications.
The more structural question is whether the reclassification bottleneck that accumulated 1.35 million students in the LEP pipeline will ease. The enrollment data cannot distinguish a student who arrived six months ago from one who has been classified LEP for eight years. Both count the same in the headline number, but they represent very different instructional needs and very different costs. Until Texas disaggregates its English learner counts by years in classification, the one-in-four figure will remain a blunt instrument for a population that demands precision.
Detailed code that reproduces the analysis and figures in this article is available exclusively to EdTribune subscribers.
Discussion
Sign in to join the discussion.
Loading comments...