In this series: Texas 2025-26 Enrollment.
Texas's newer Student Enrollment Reports counted 5,467,642 public school students in 2025-26, last school year and the most recent published year used here. That was 76,613 fewer than the preceding year's 5,544,255, a decline of 1.4%.
The state's historical annual performance reports tell a longer story of growth, followed by smaller annual gains. They reported 4,383,871 students in 2004-05 and 5,530,499 in 2024-25. That historical endpoint differs from the overlapping year's newer enrollment report total. The two series remain separate here; their unequal overlapping counts do not establish why they differ.
Growth slowed before the newer report's decline
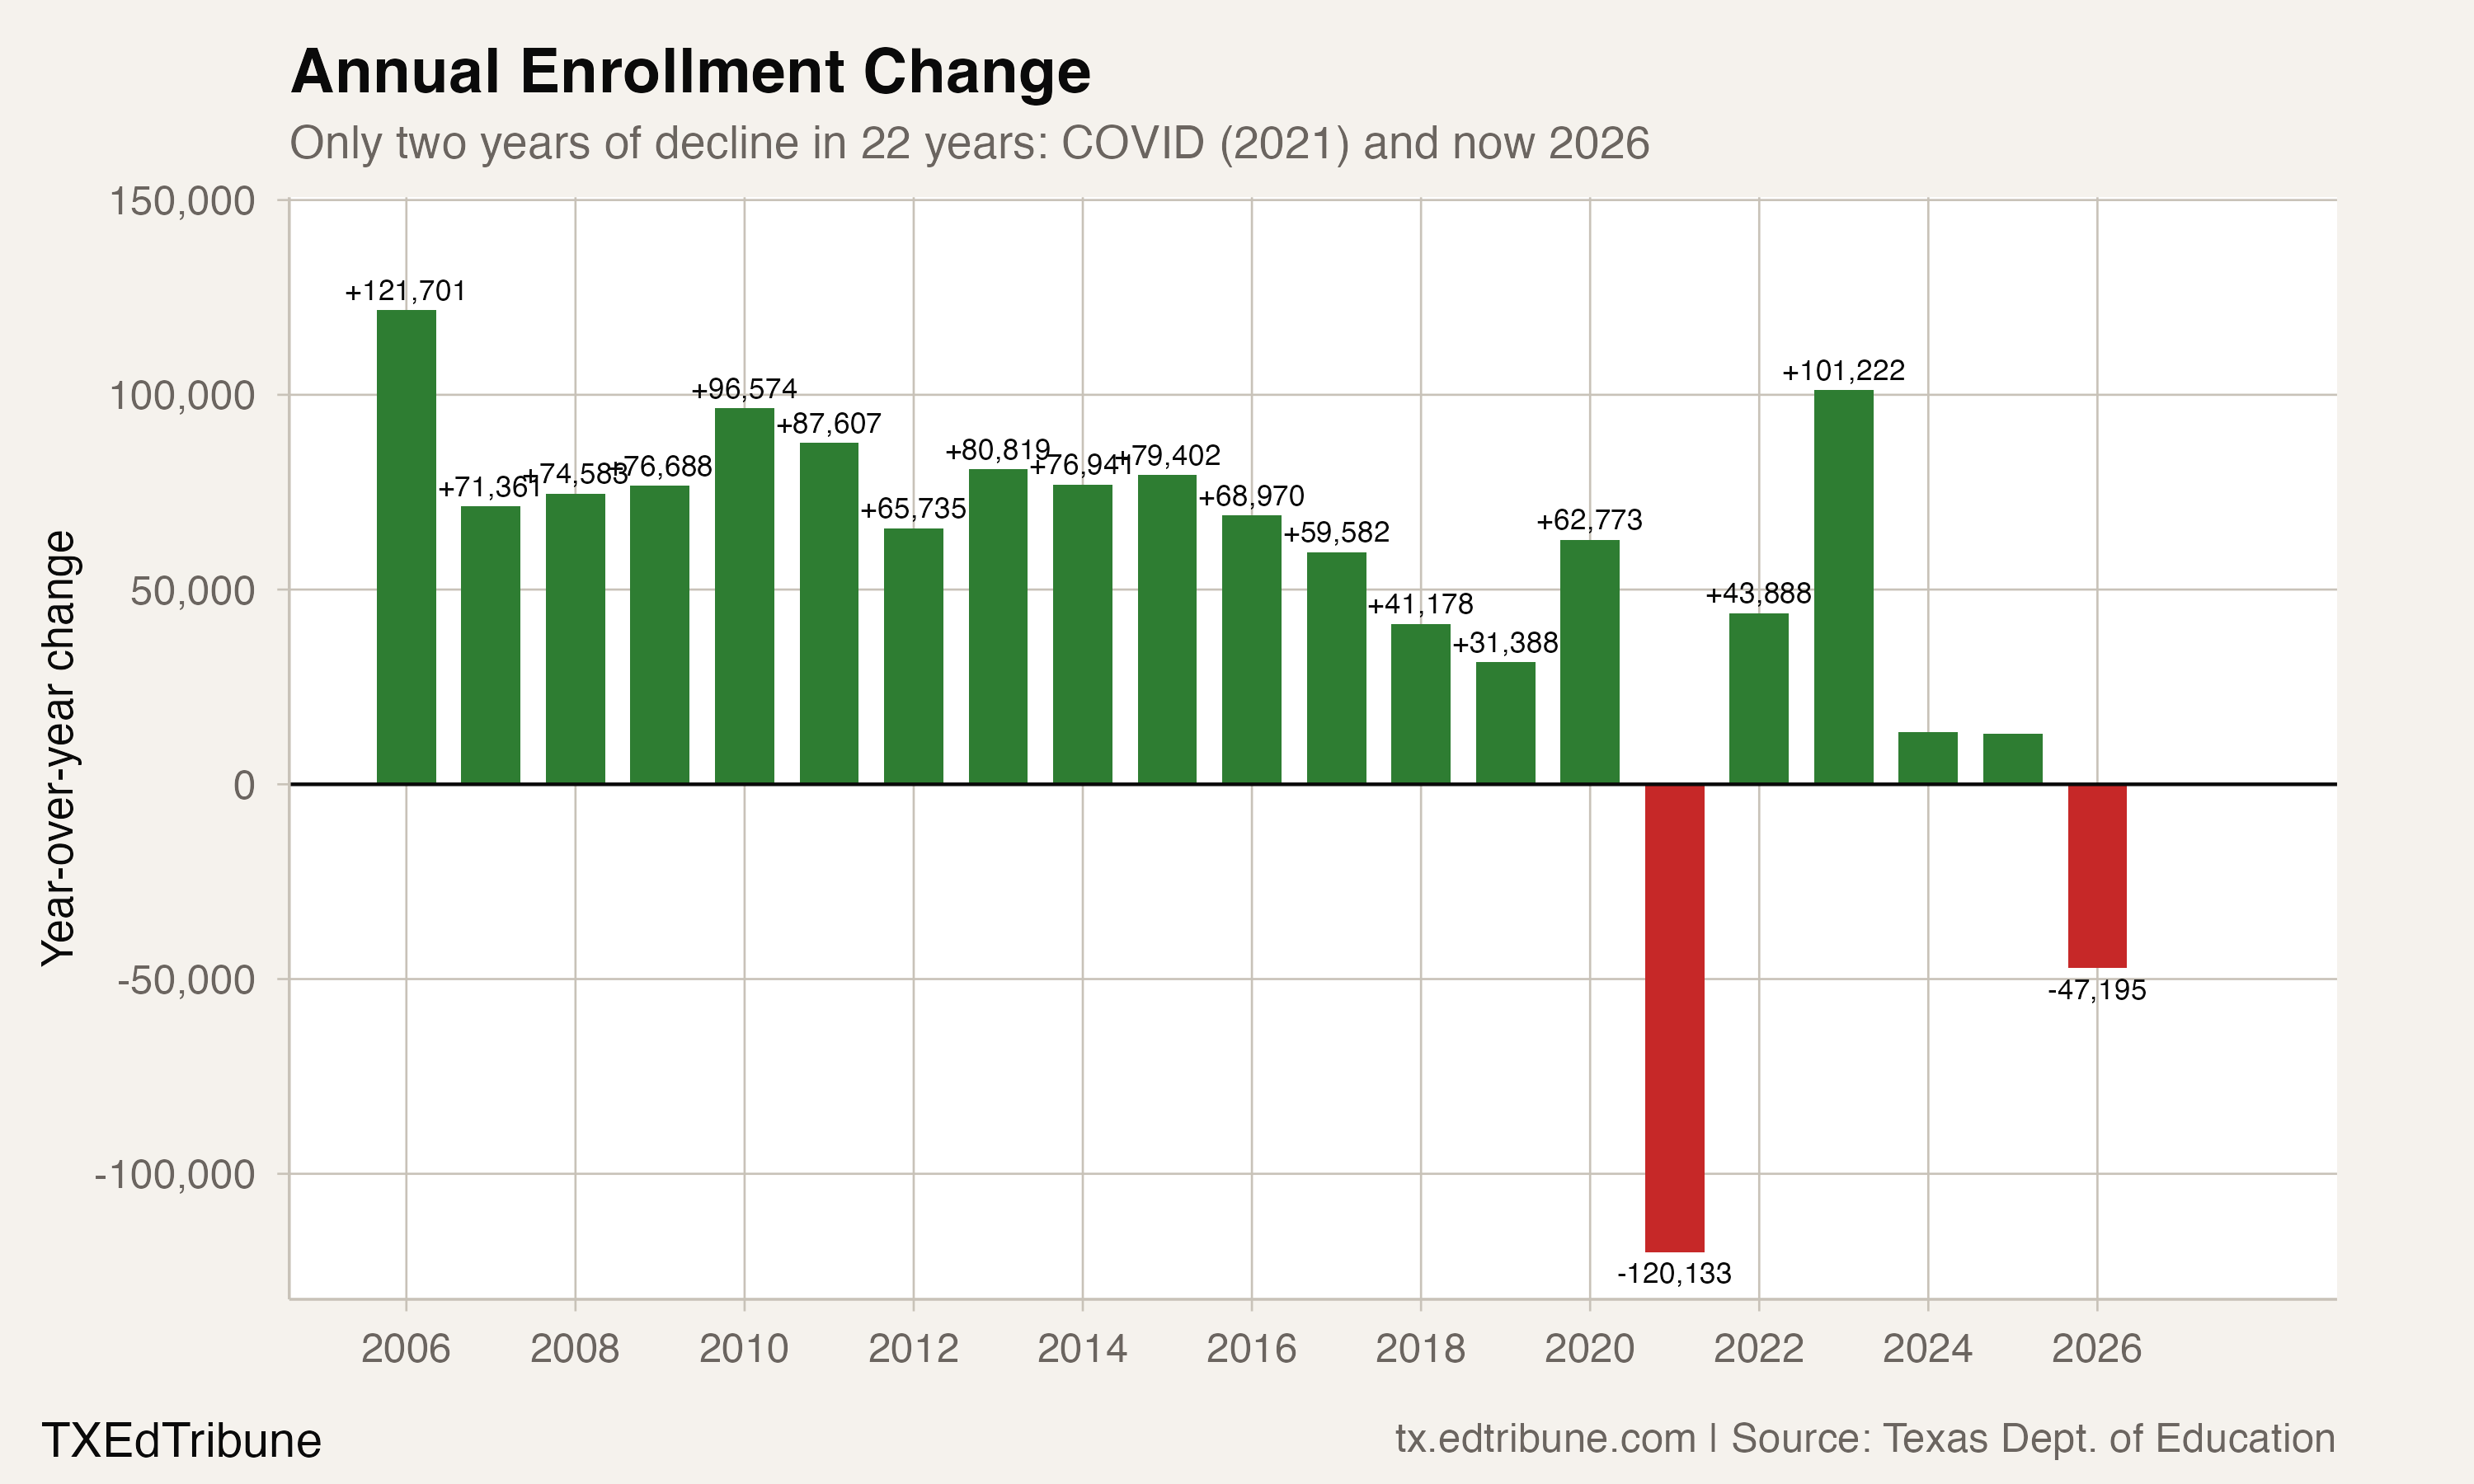
Every annual change from 2005-06 through 2019-20 was positive in the historical reports: 15 consecutive gains totaling 1,095,302 students. The next year, 2020-21, brought a decline of 120,133.
The historical count subsequently rose. In 2022-23, the increase was 101,222. The following two years added 13,314 and 13,035 students. That final gain was well below the 96,574 added in 2009-10. This is a comparison of annual changes, rather than a claim that growth fell without interruption in every intervening year.
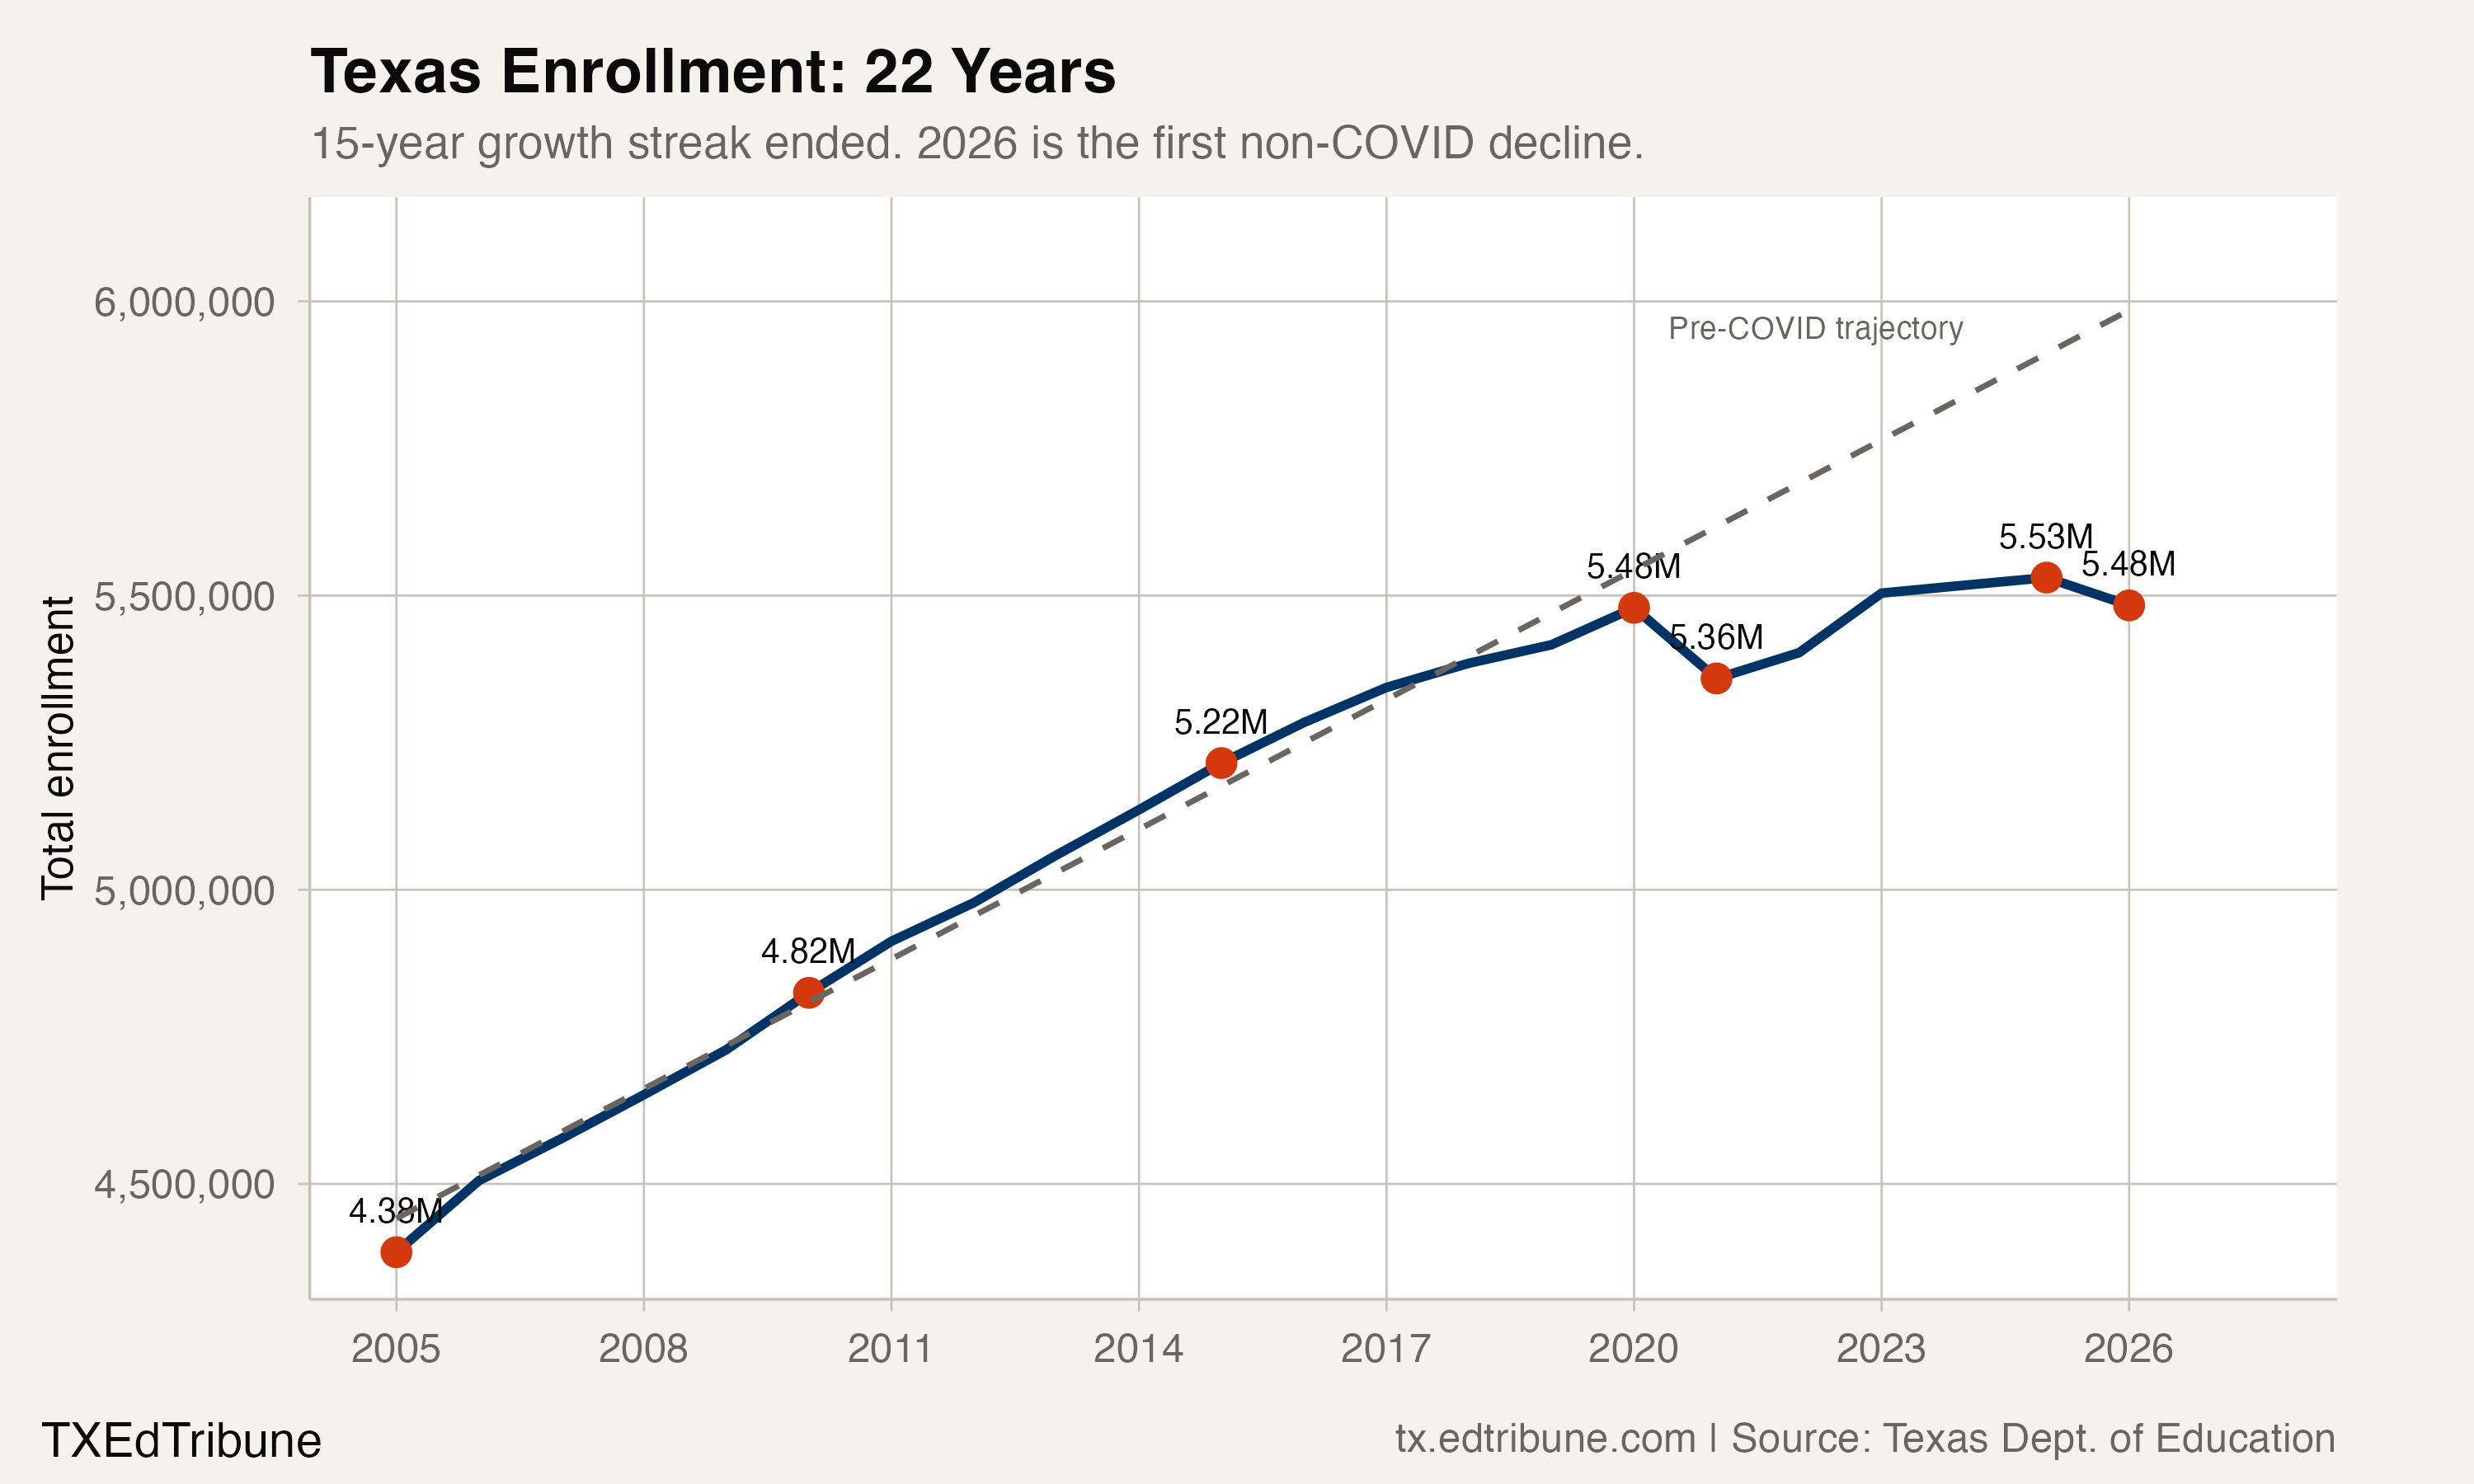
The historical series reached its highest count in the complete window in 2024-25, at 5,530,499. The newer reports' decline describes their own two-year comparison. It does not extend the historical record or establish a first decline outside a particular cause.
Five large districts, two separate comparisons
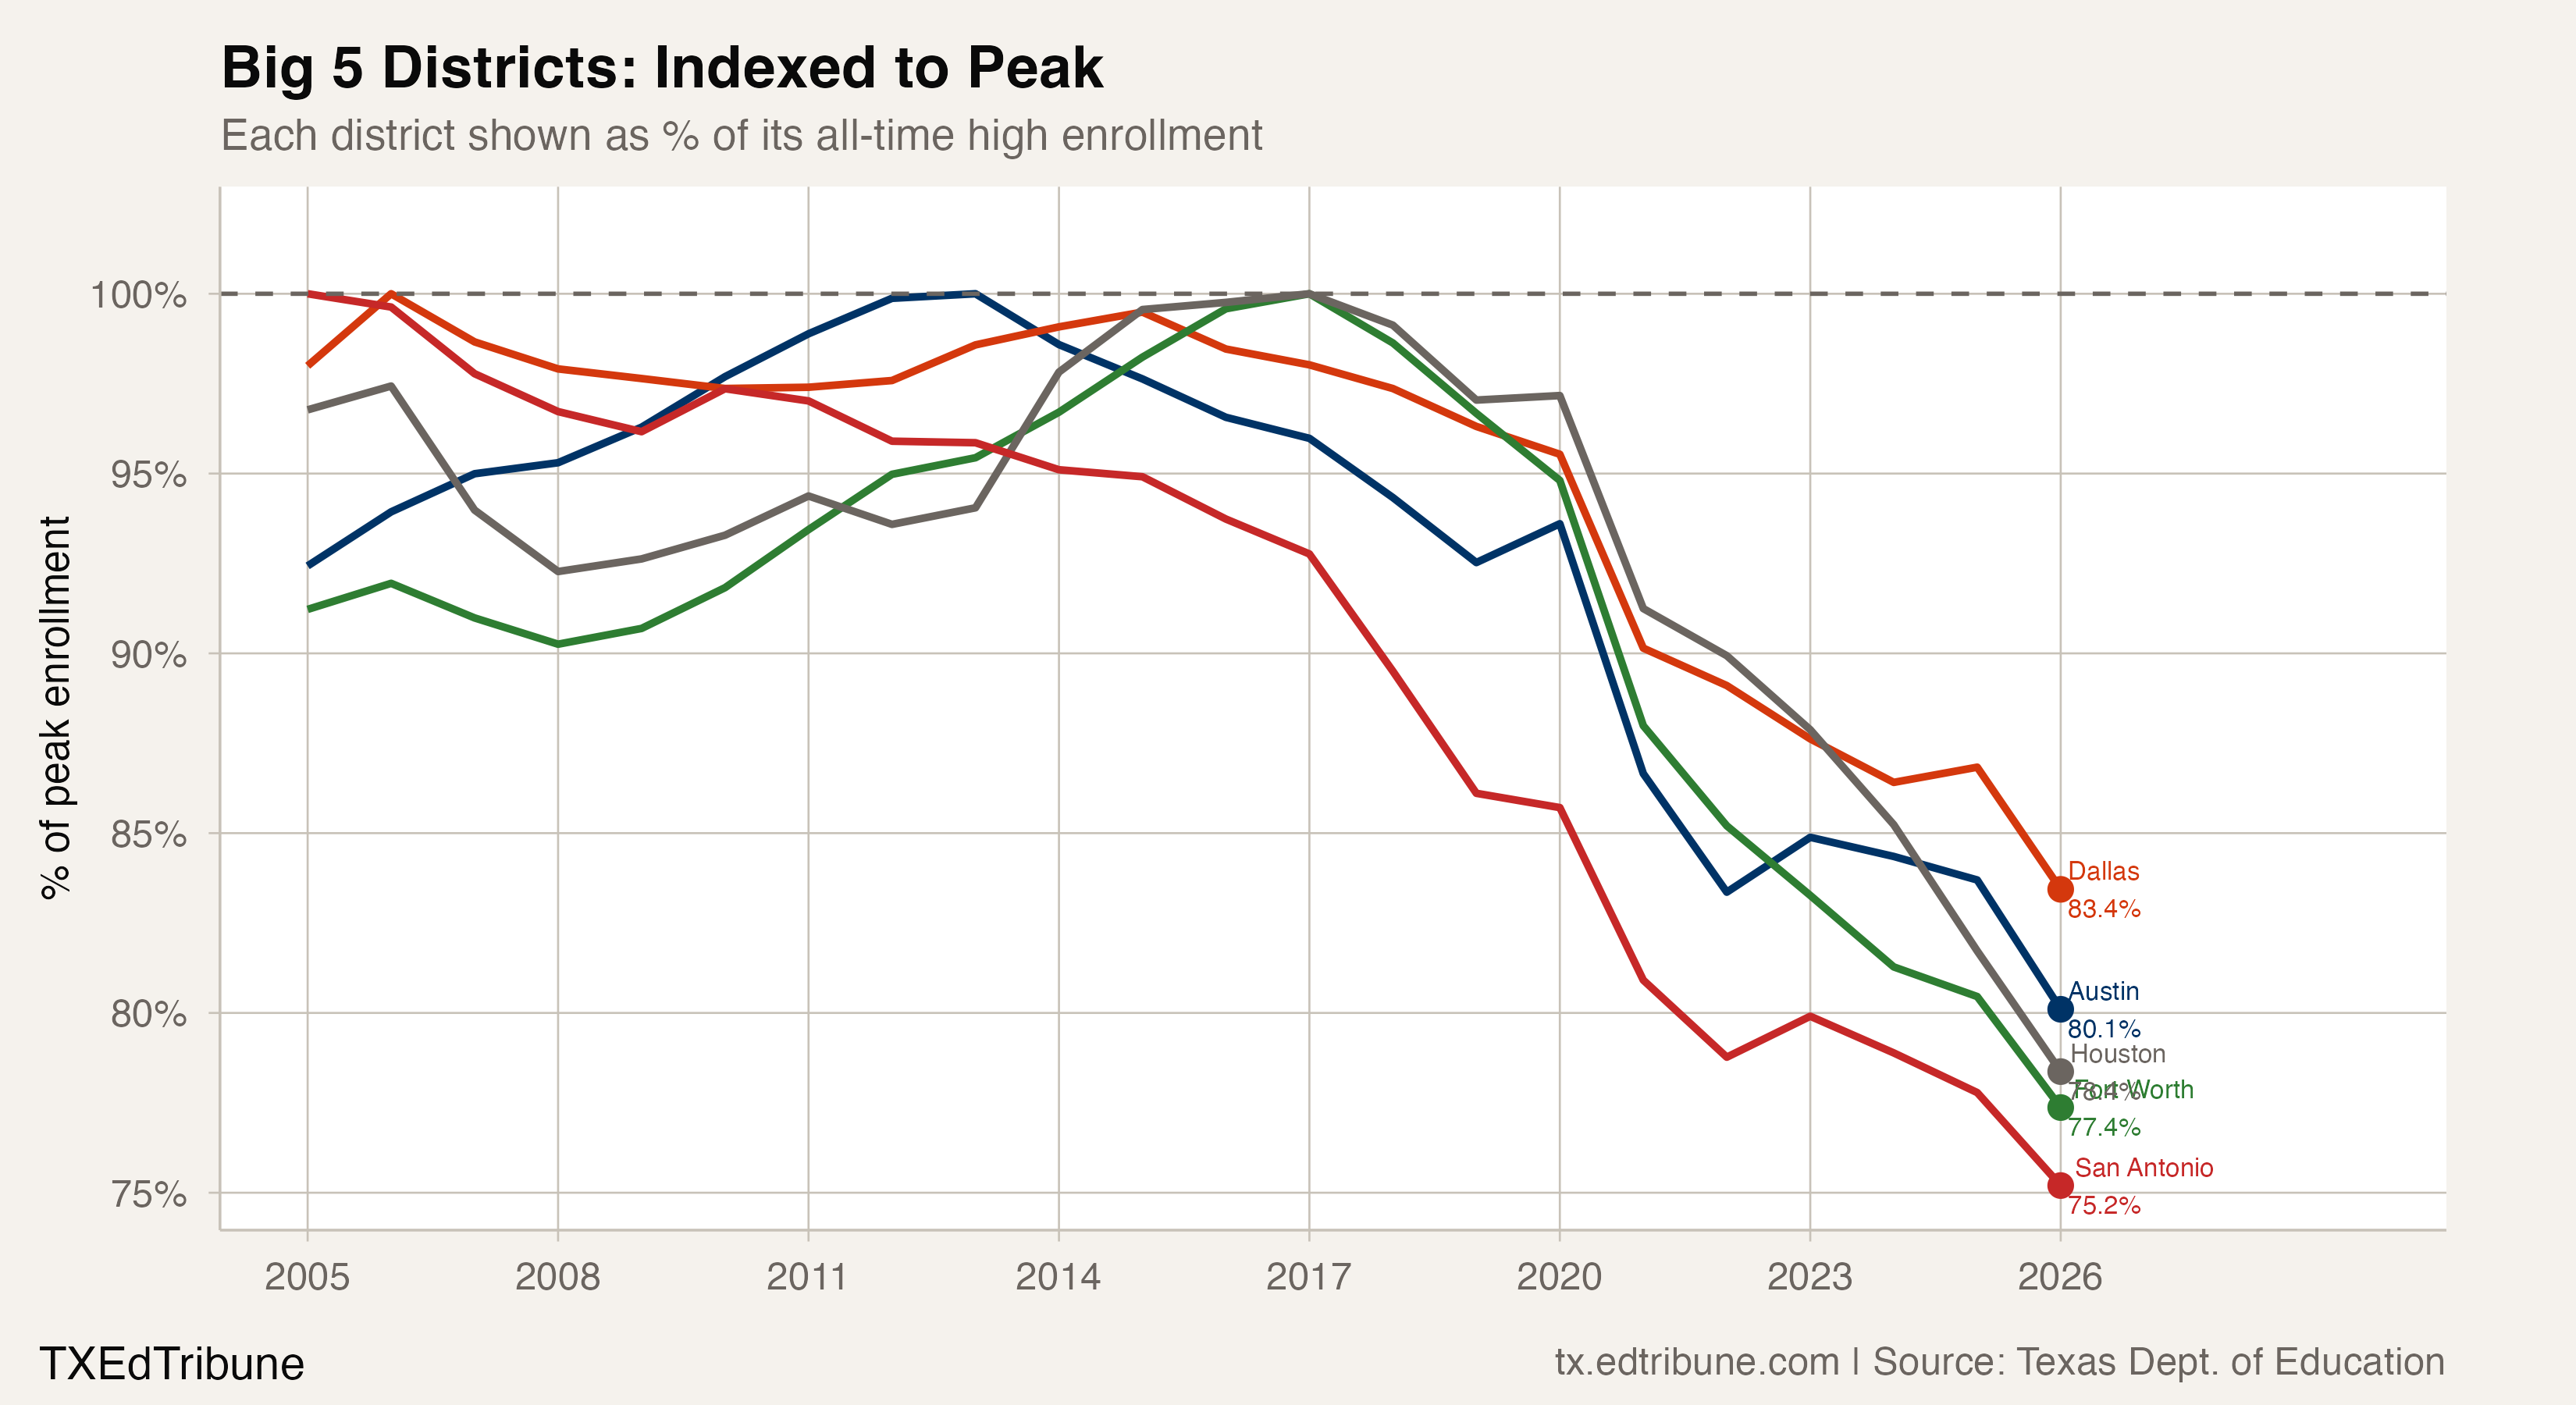
Houston ISD↗ET reported 176,039 students in the historical 2024-25 report, below its window's peak of 215,408 in 2016-17. That historical decline was 39,369 students, or 18.3%.
The same historical comparison placed Dallas ISD↗ET 13.2% below its peak, San Antonio ISD↗ET 22.2% below, Fort Worth ISD↗ET 19.5% below, and Austin ISD↗ET 16.3% below. Each peak is tested within the full historical window through 2024-25.
All five also declined in the separate newer enrollment-report pair. Houston's 2025-26 count was 168,812, down 7,915 students, or 4.5%, from that report's preceding year. Dallas counted 134,308, a loss of 5,494 or 3.9%.
San Antonio counted 42,548, down 1,499; Fort Worth counted 67,491, down 2,914; and Austin counted 69,074, down 3,198. Those are same-report annual losses. They are not subtracted from the historical peaks to create a longer mixed-series decline.
The enrollment totals do not establish whether a takeover, school choice, housing change, or another mechanism caused any district's loss. A falling count also does not identify which students moved or where they went.
More matched districts declined than grew
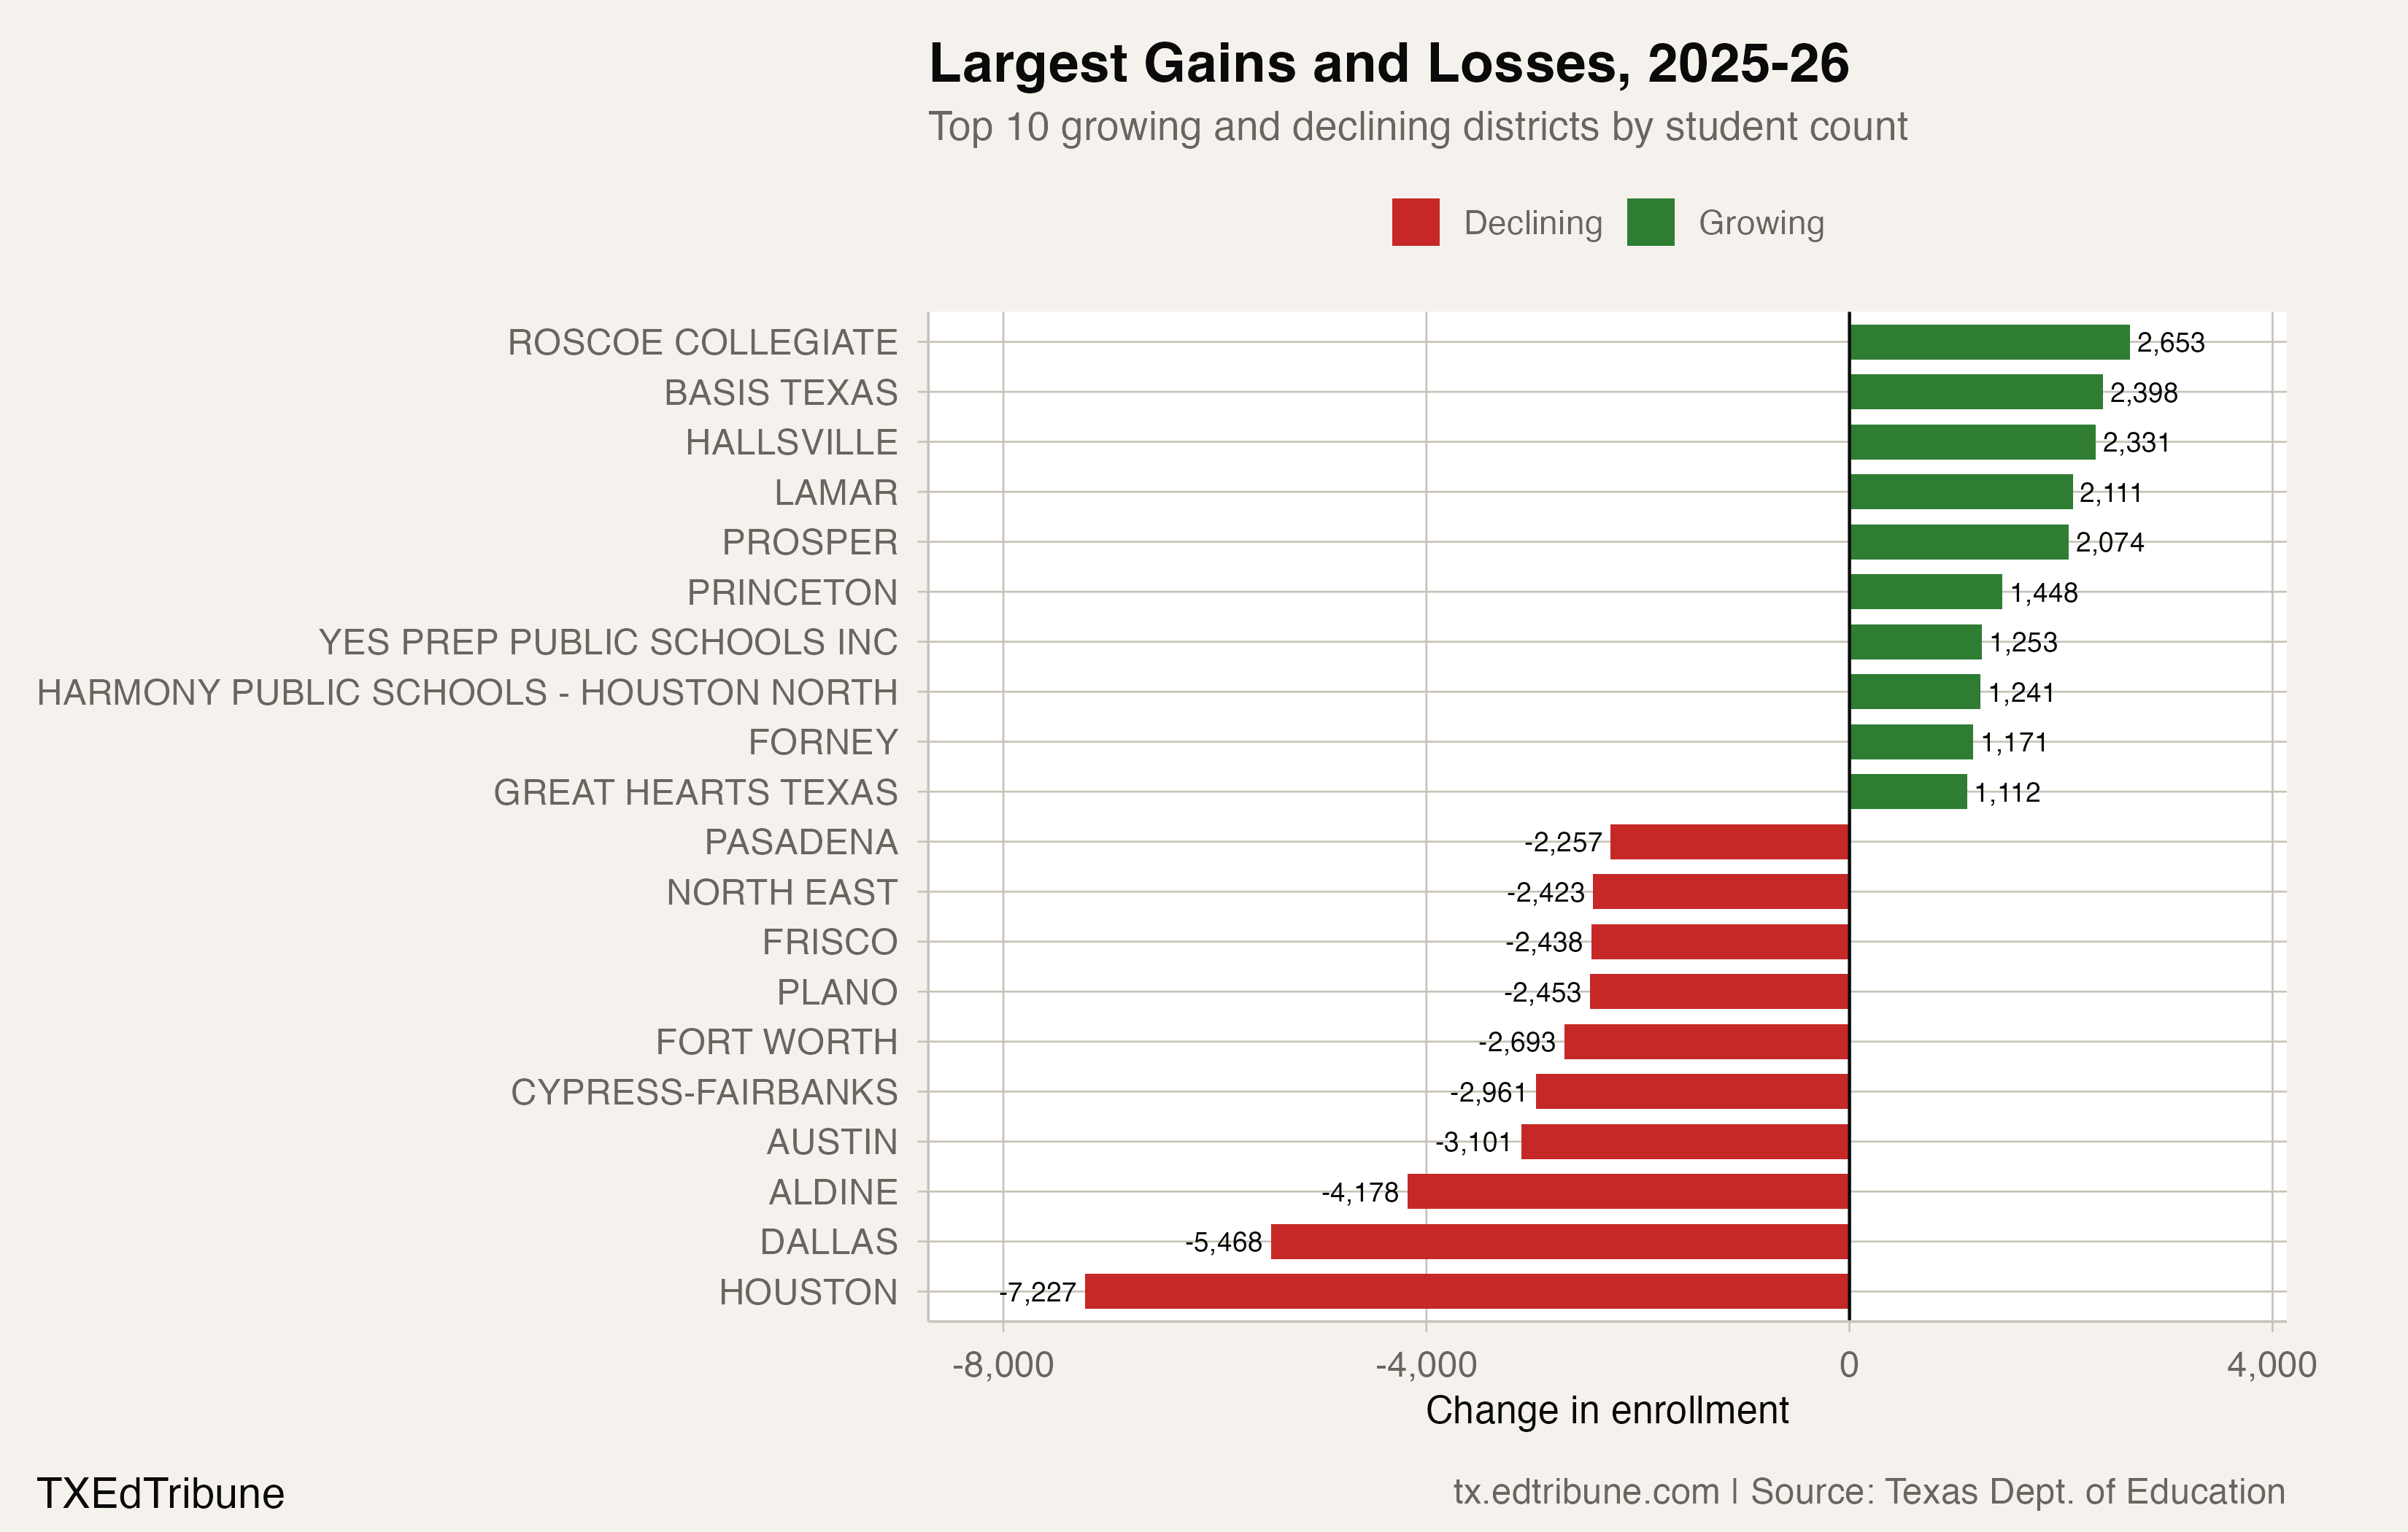
The newer 2025-26 report contains 1,200 published district total rows. Across both years, the union contains 1,211 district identifiers. Annual changes can be compared for 1,194 districts with a finite count in both years and a positive baseline; the remaining 17 identifiers are excluded for an absent count or unusable baseline.
Within those matched pairs, 751 districts declined, 434 grew and 9 were unchanged. That is the comparison universe, rather than a classification of every unmatched district.
The largest ten matched district losses totaled 37,251 students. The largest twenty-five totaled 63,131. Gains elsewhere offset part of those losses: the net decline across all matched pairs was 74,511. These sums describe the matched district rows and do not replace the published state total or explain its decline.
Smaller kindergarten counts than grade 12
The historical grade snapshots show another change. Twelfth grade first exceeded kindergarten in 2020-21 within the complete historical window. In 2024-25, the historical report counted 386,543 twelfth-graders and 359,286 kindergartners, a gap of 27,257.
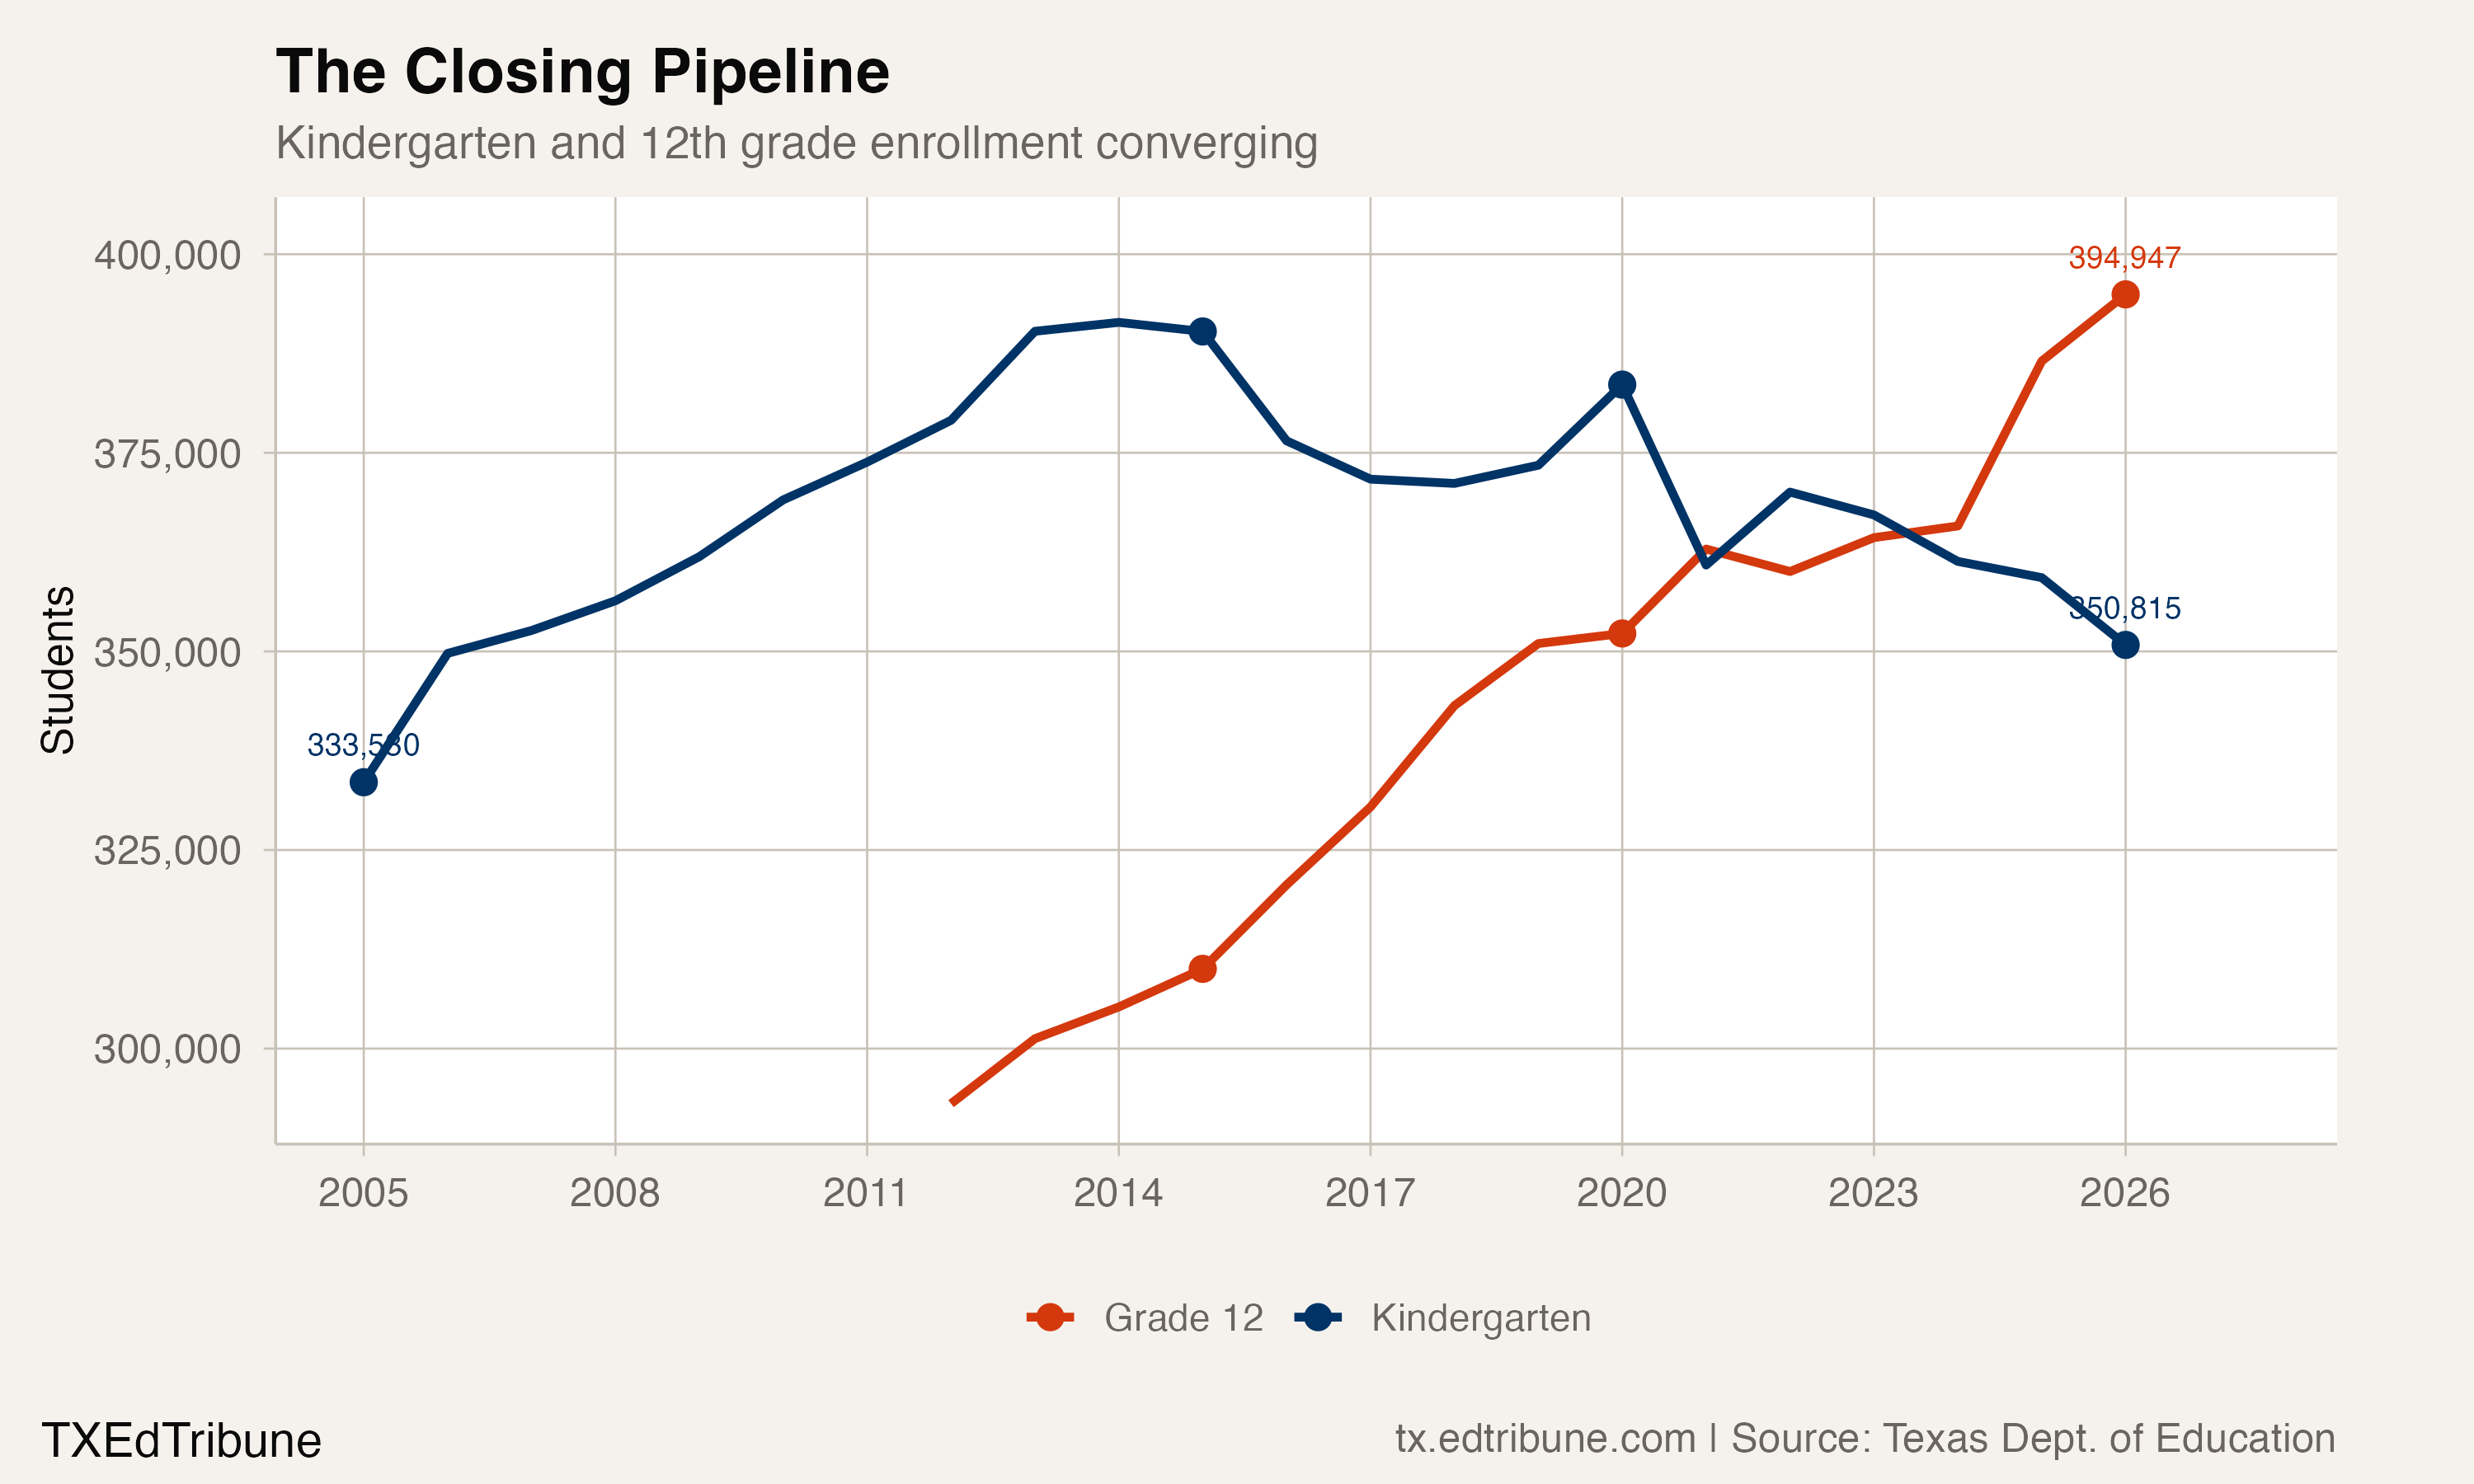
Those counts refer to different groups of students. Twelfth-grade enrollment is not a graduation count, and kindergarten enrollment is not a measure of every new entrant to public education. Their difference cannot be treated as a count of students the system will lose next year.
The historical growth streak, smaller gains near the end of that window, and the newer report's annual loss are each visible in the reported counts. They do not supply a forecast. The 2026-27 school year is underway; these figures describe earlier school years rather than a live count of today's students.
Sources: Texas Education Agency annual performance reports, including earlier AEIS reports, and the separate Student Enrollment Reports.
Detailed code that reproduces the analysis and figures in this article is available exclusively to EdTribune subscribers.
Discussion
Sign in to join the discussion.
Loading comments...