In this series: Texas 2025-26 Enrollment.
Houston ISD↗ET reached the lowest count in its complete historical reporting window in 2024-25: 176,039 students. The separate newer enrollment reports counted 168,812 in 2025-26, last school year, down 7,915 students, or 4.5%, from their own preceding-year total of 176,727.
Those are two comparisons. The historical series covers 2004-05 through 2024-25, and its overlapping endpoint differs from the newer report. Their comparability has not been established here. The newer count is therefore not attached to the historical line to declare a longer enrollment record.
The historical low is a window-specific finding
Houston's historical report counted 208,454 students in 2004-05. By 2024-25, that count was lower by 32,415, or 15.6%. Every year in that historical window is included in the minimum test.
The district's highest count within the same window was 215,408 in 2016-17. Its later historical endpoint was below that peak as well as below the opening year's count.
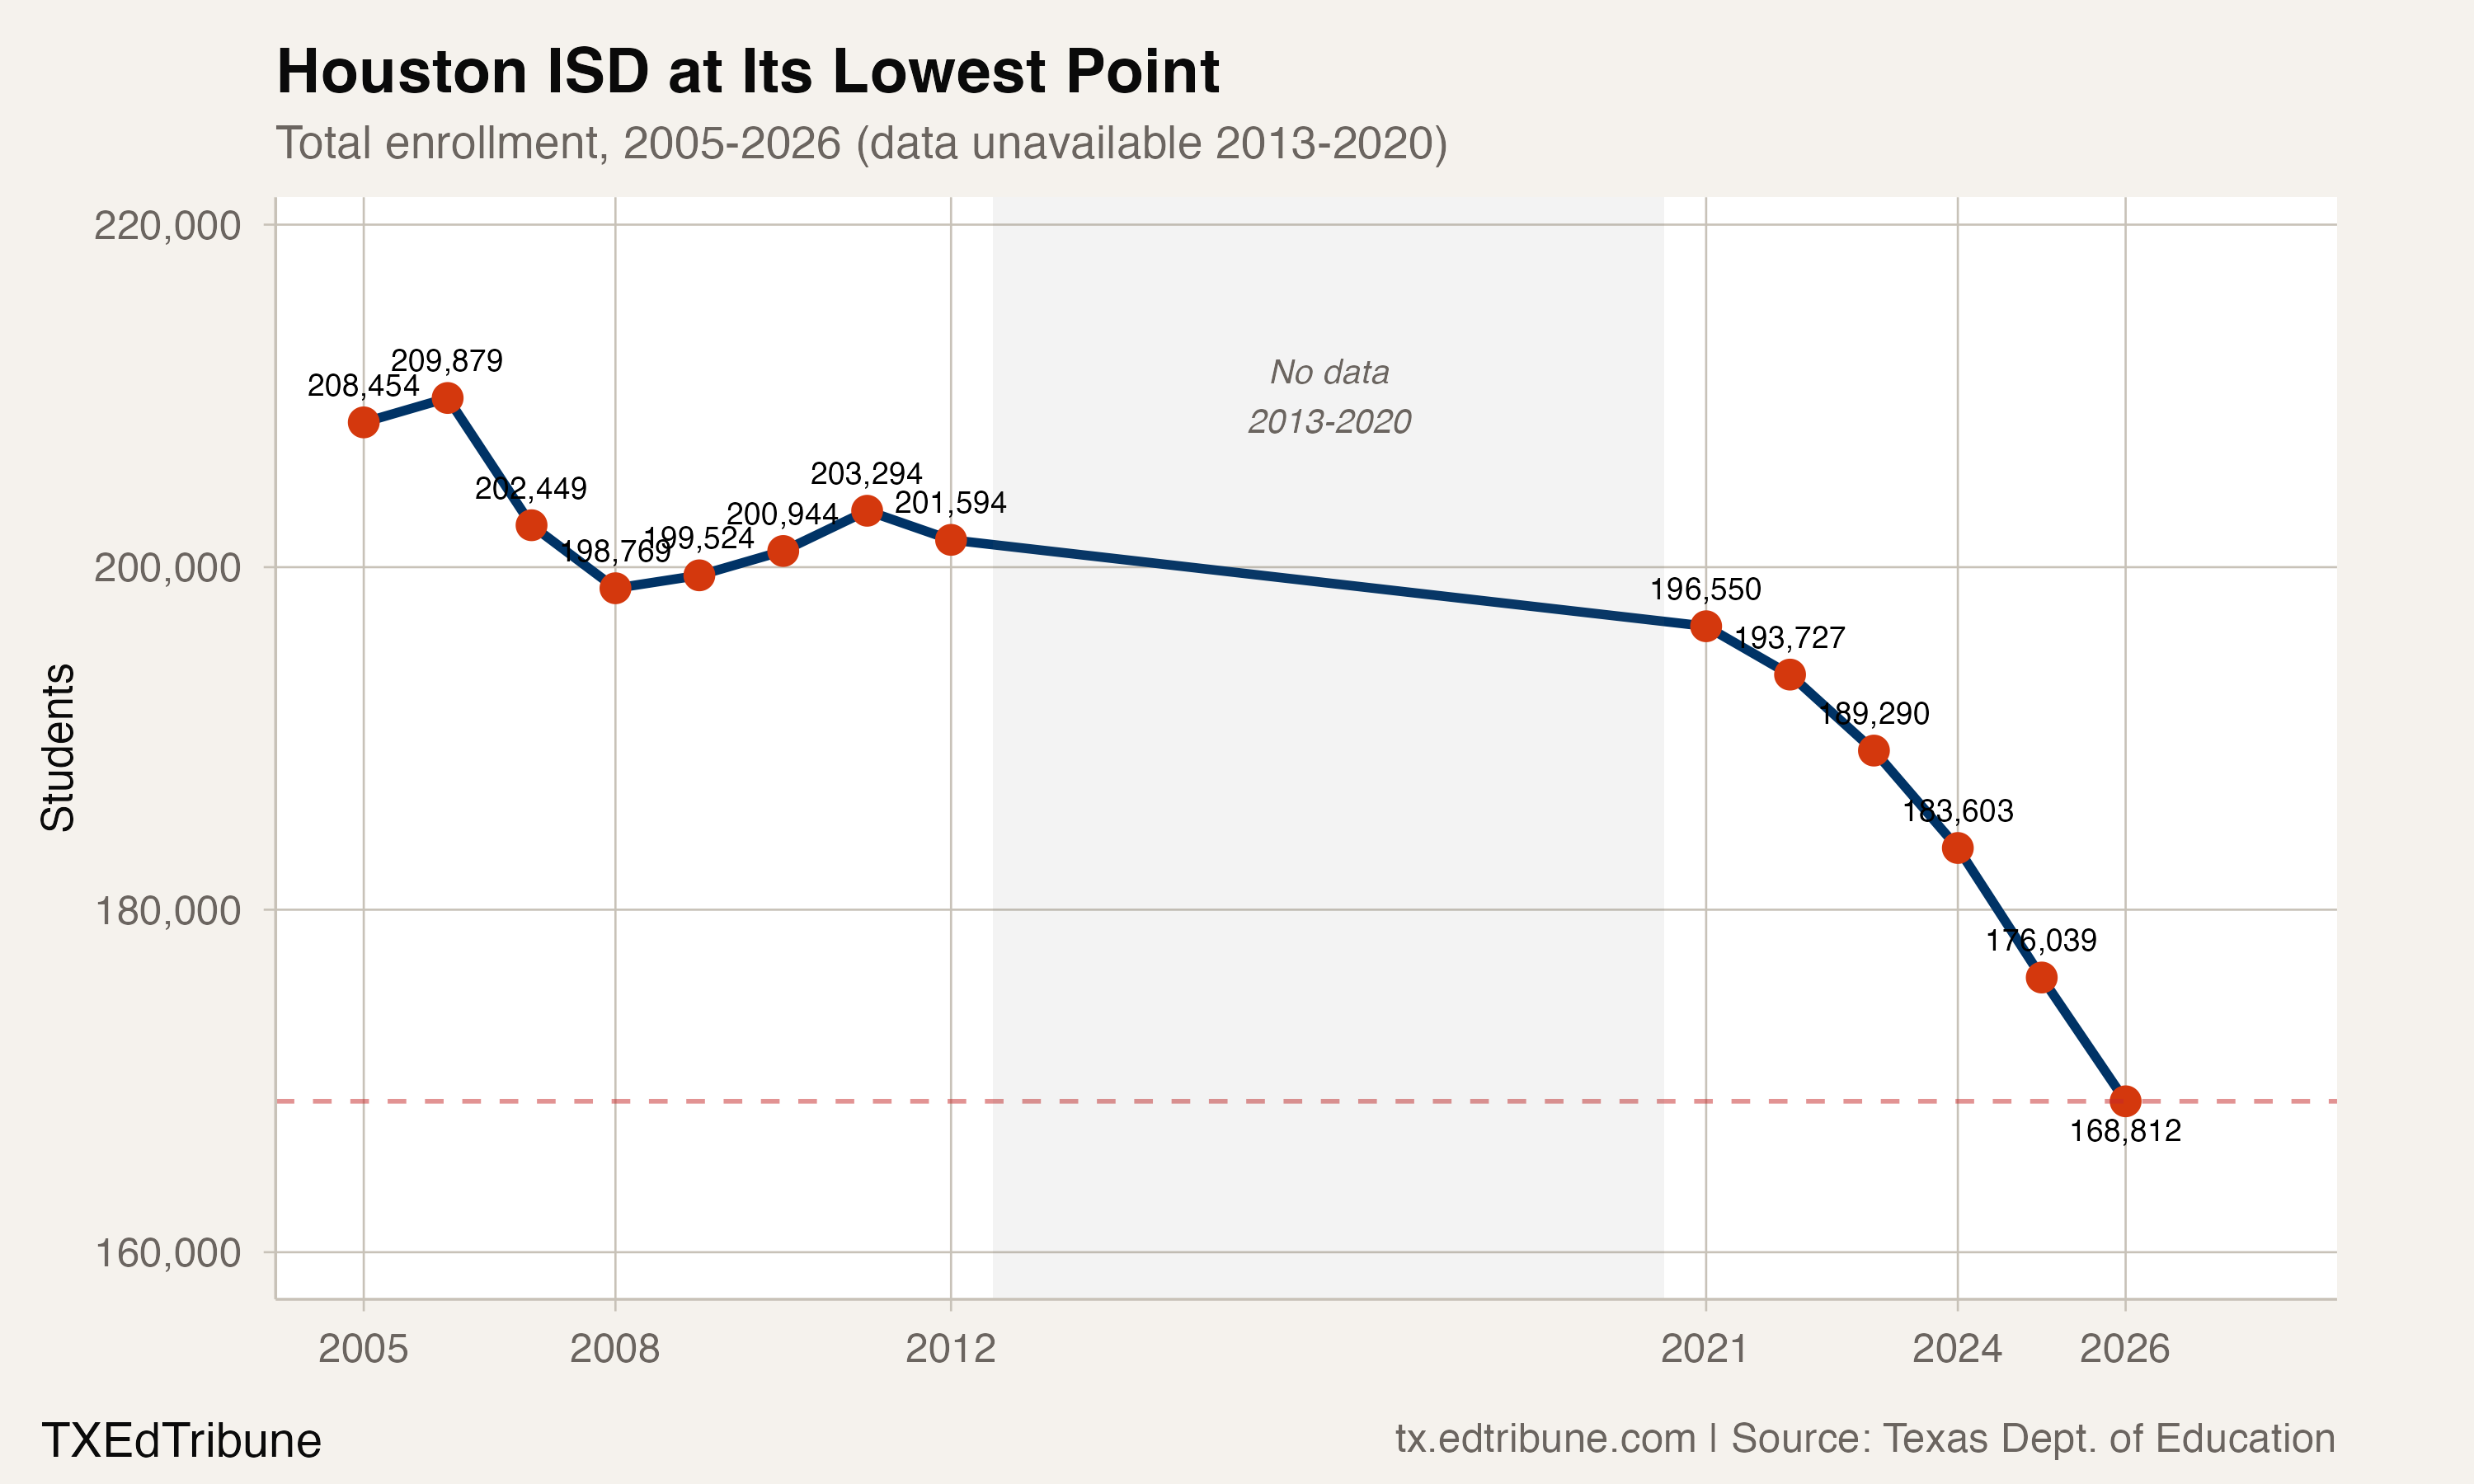
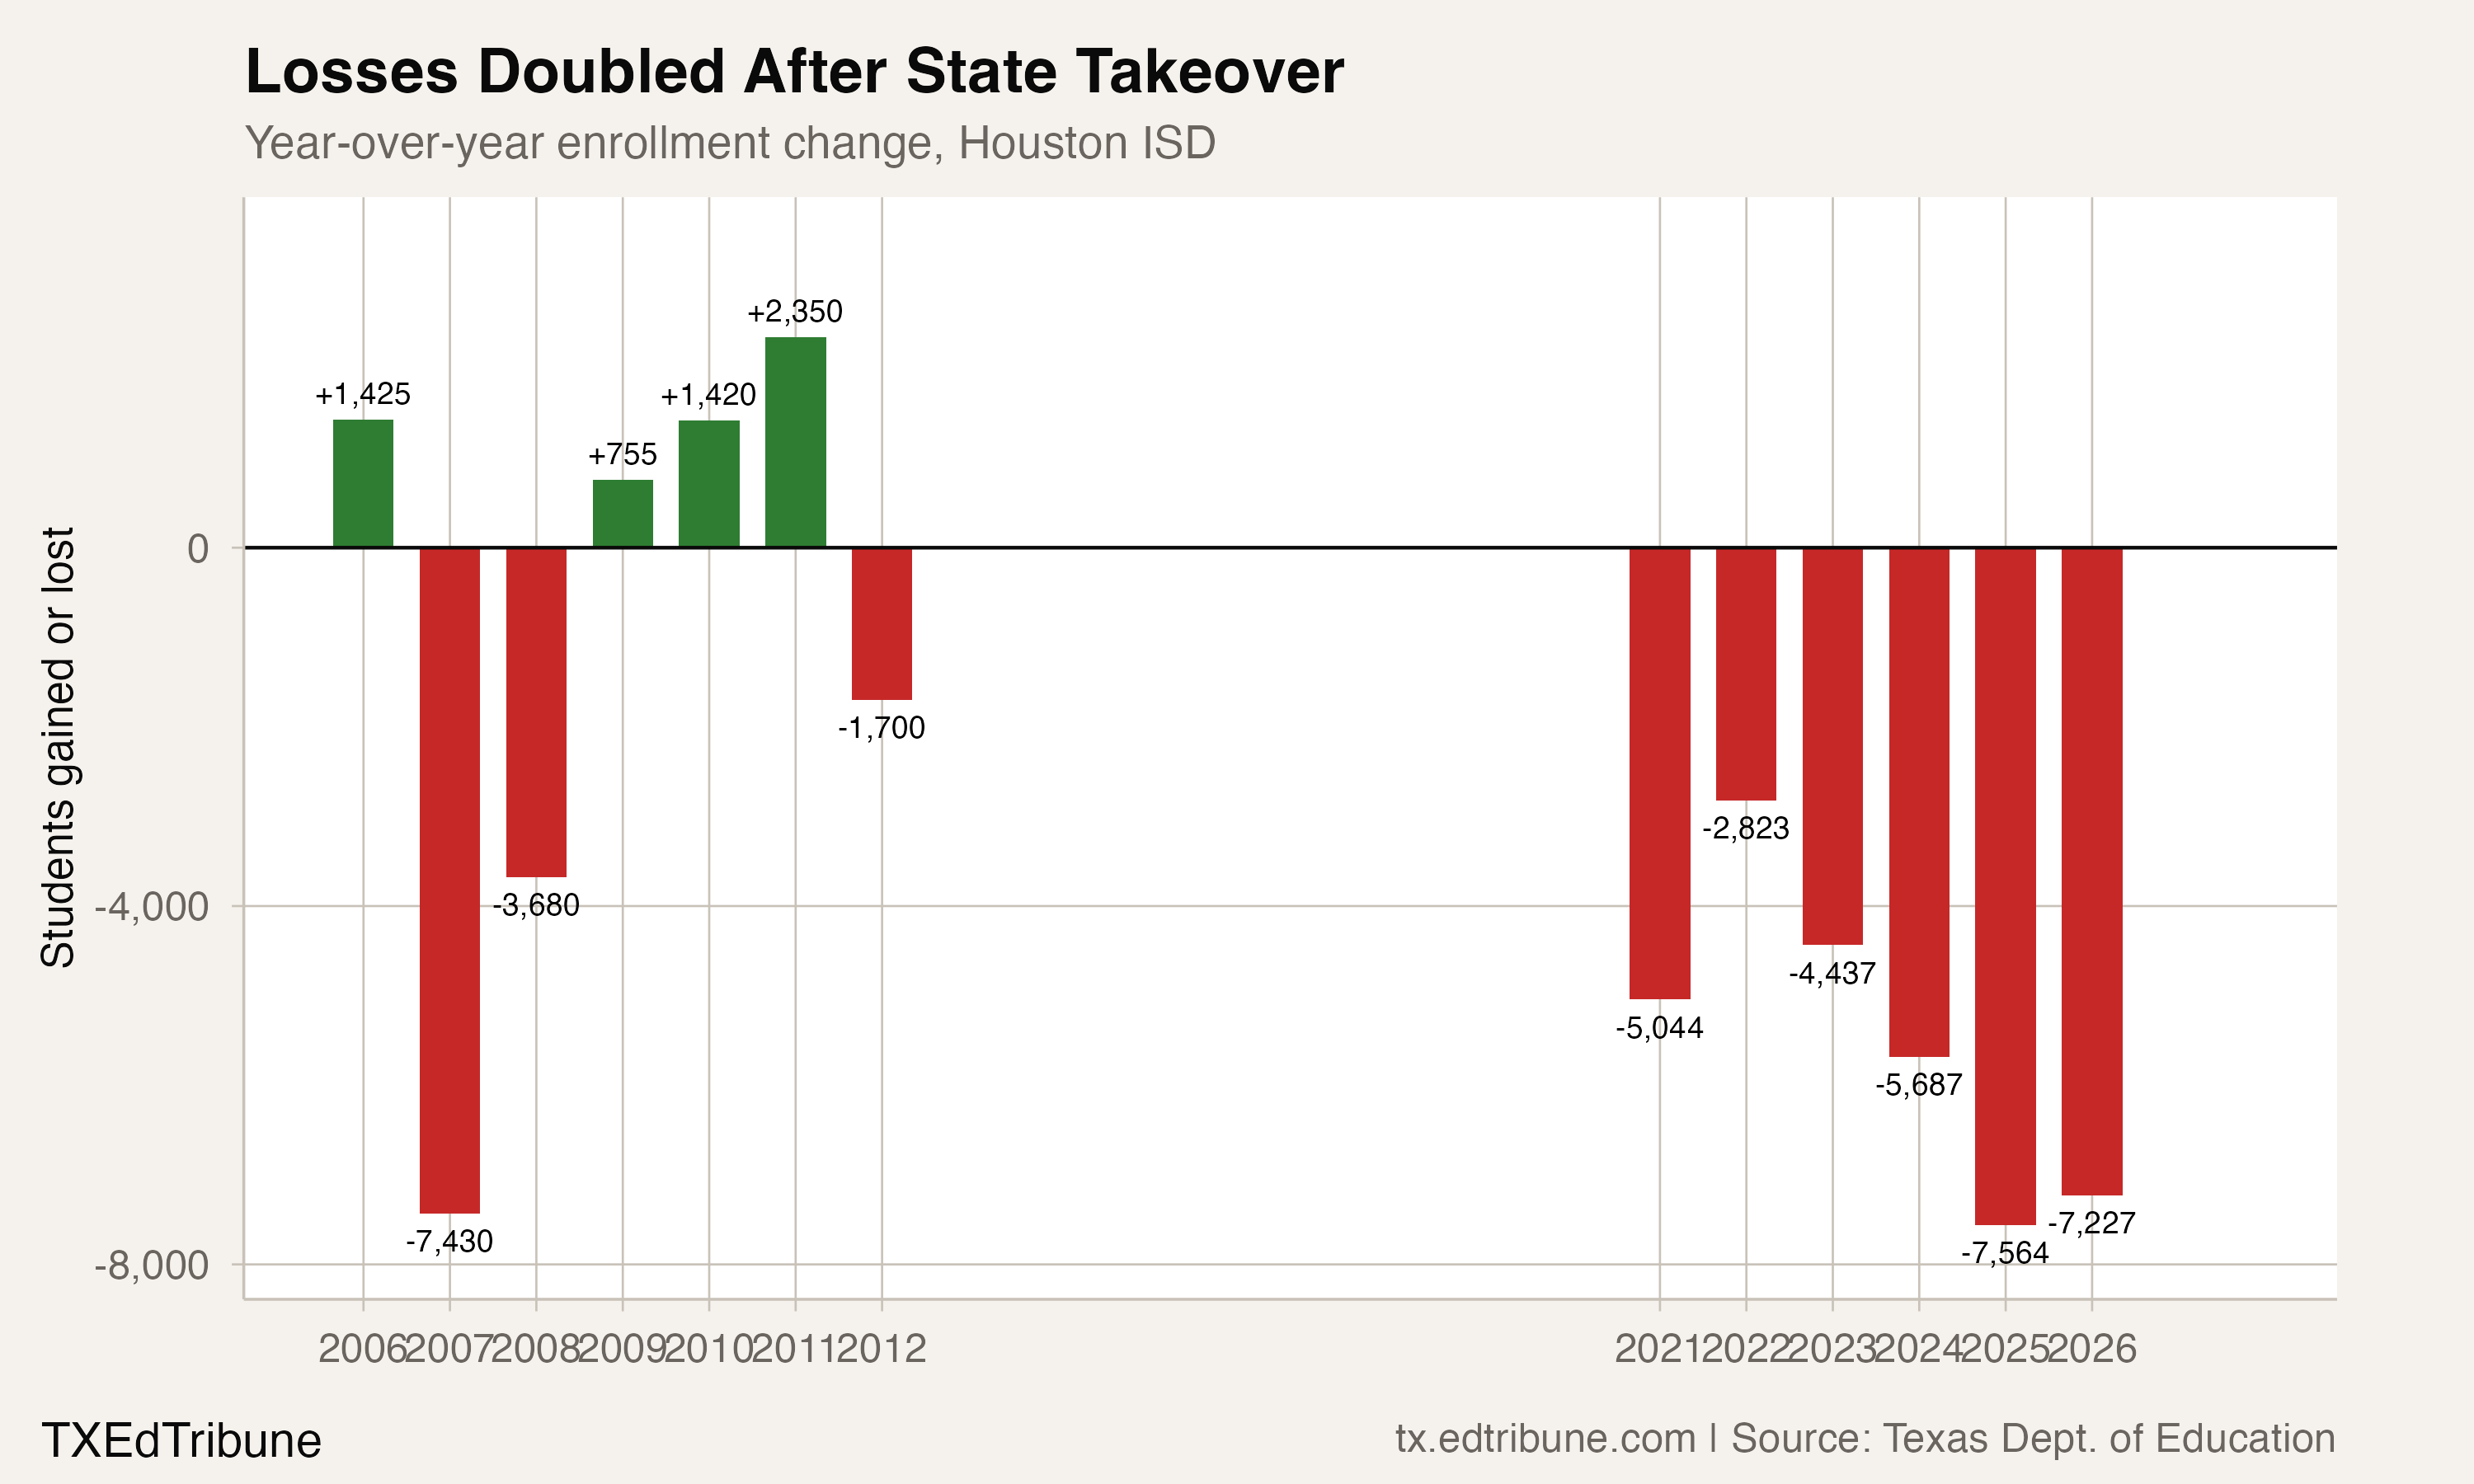
The annual changes below show the path through 2024-25. They do not include a mixed-report change to 2025-26, and they do not identify why a particular year's count rose or fell. The enrollment totals alone cannot attribute the pattern to a state takeover, housing change, private schooling, or another mechanism.
Selected neighboring districts show a different pattern
Katy ISD↗ET counted 44,212 students in 2004-05 and 95,919 in the historical 2024-25 report, an increase of 51,707, or 117%. Over those same historical endpoints, Houston's count was 4.71 times Katy's at the start and 1.84 times Katy's at the end.
Lamar CISD↗ET went from 18,440 to 46,676, a gain of 28,236. Tomball ISD↗ET went from 8,730 to 22,829, adding 14,099. Conroe ISD↗ET added 32,070 students over the same window.
The selected outer group also includes Cypress-Fairbanks, Humble and Fort Bend ISDs. All seven selected districts grew between those historical endpoints; together their reported counts increased by 201,782.
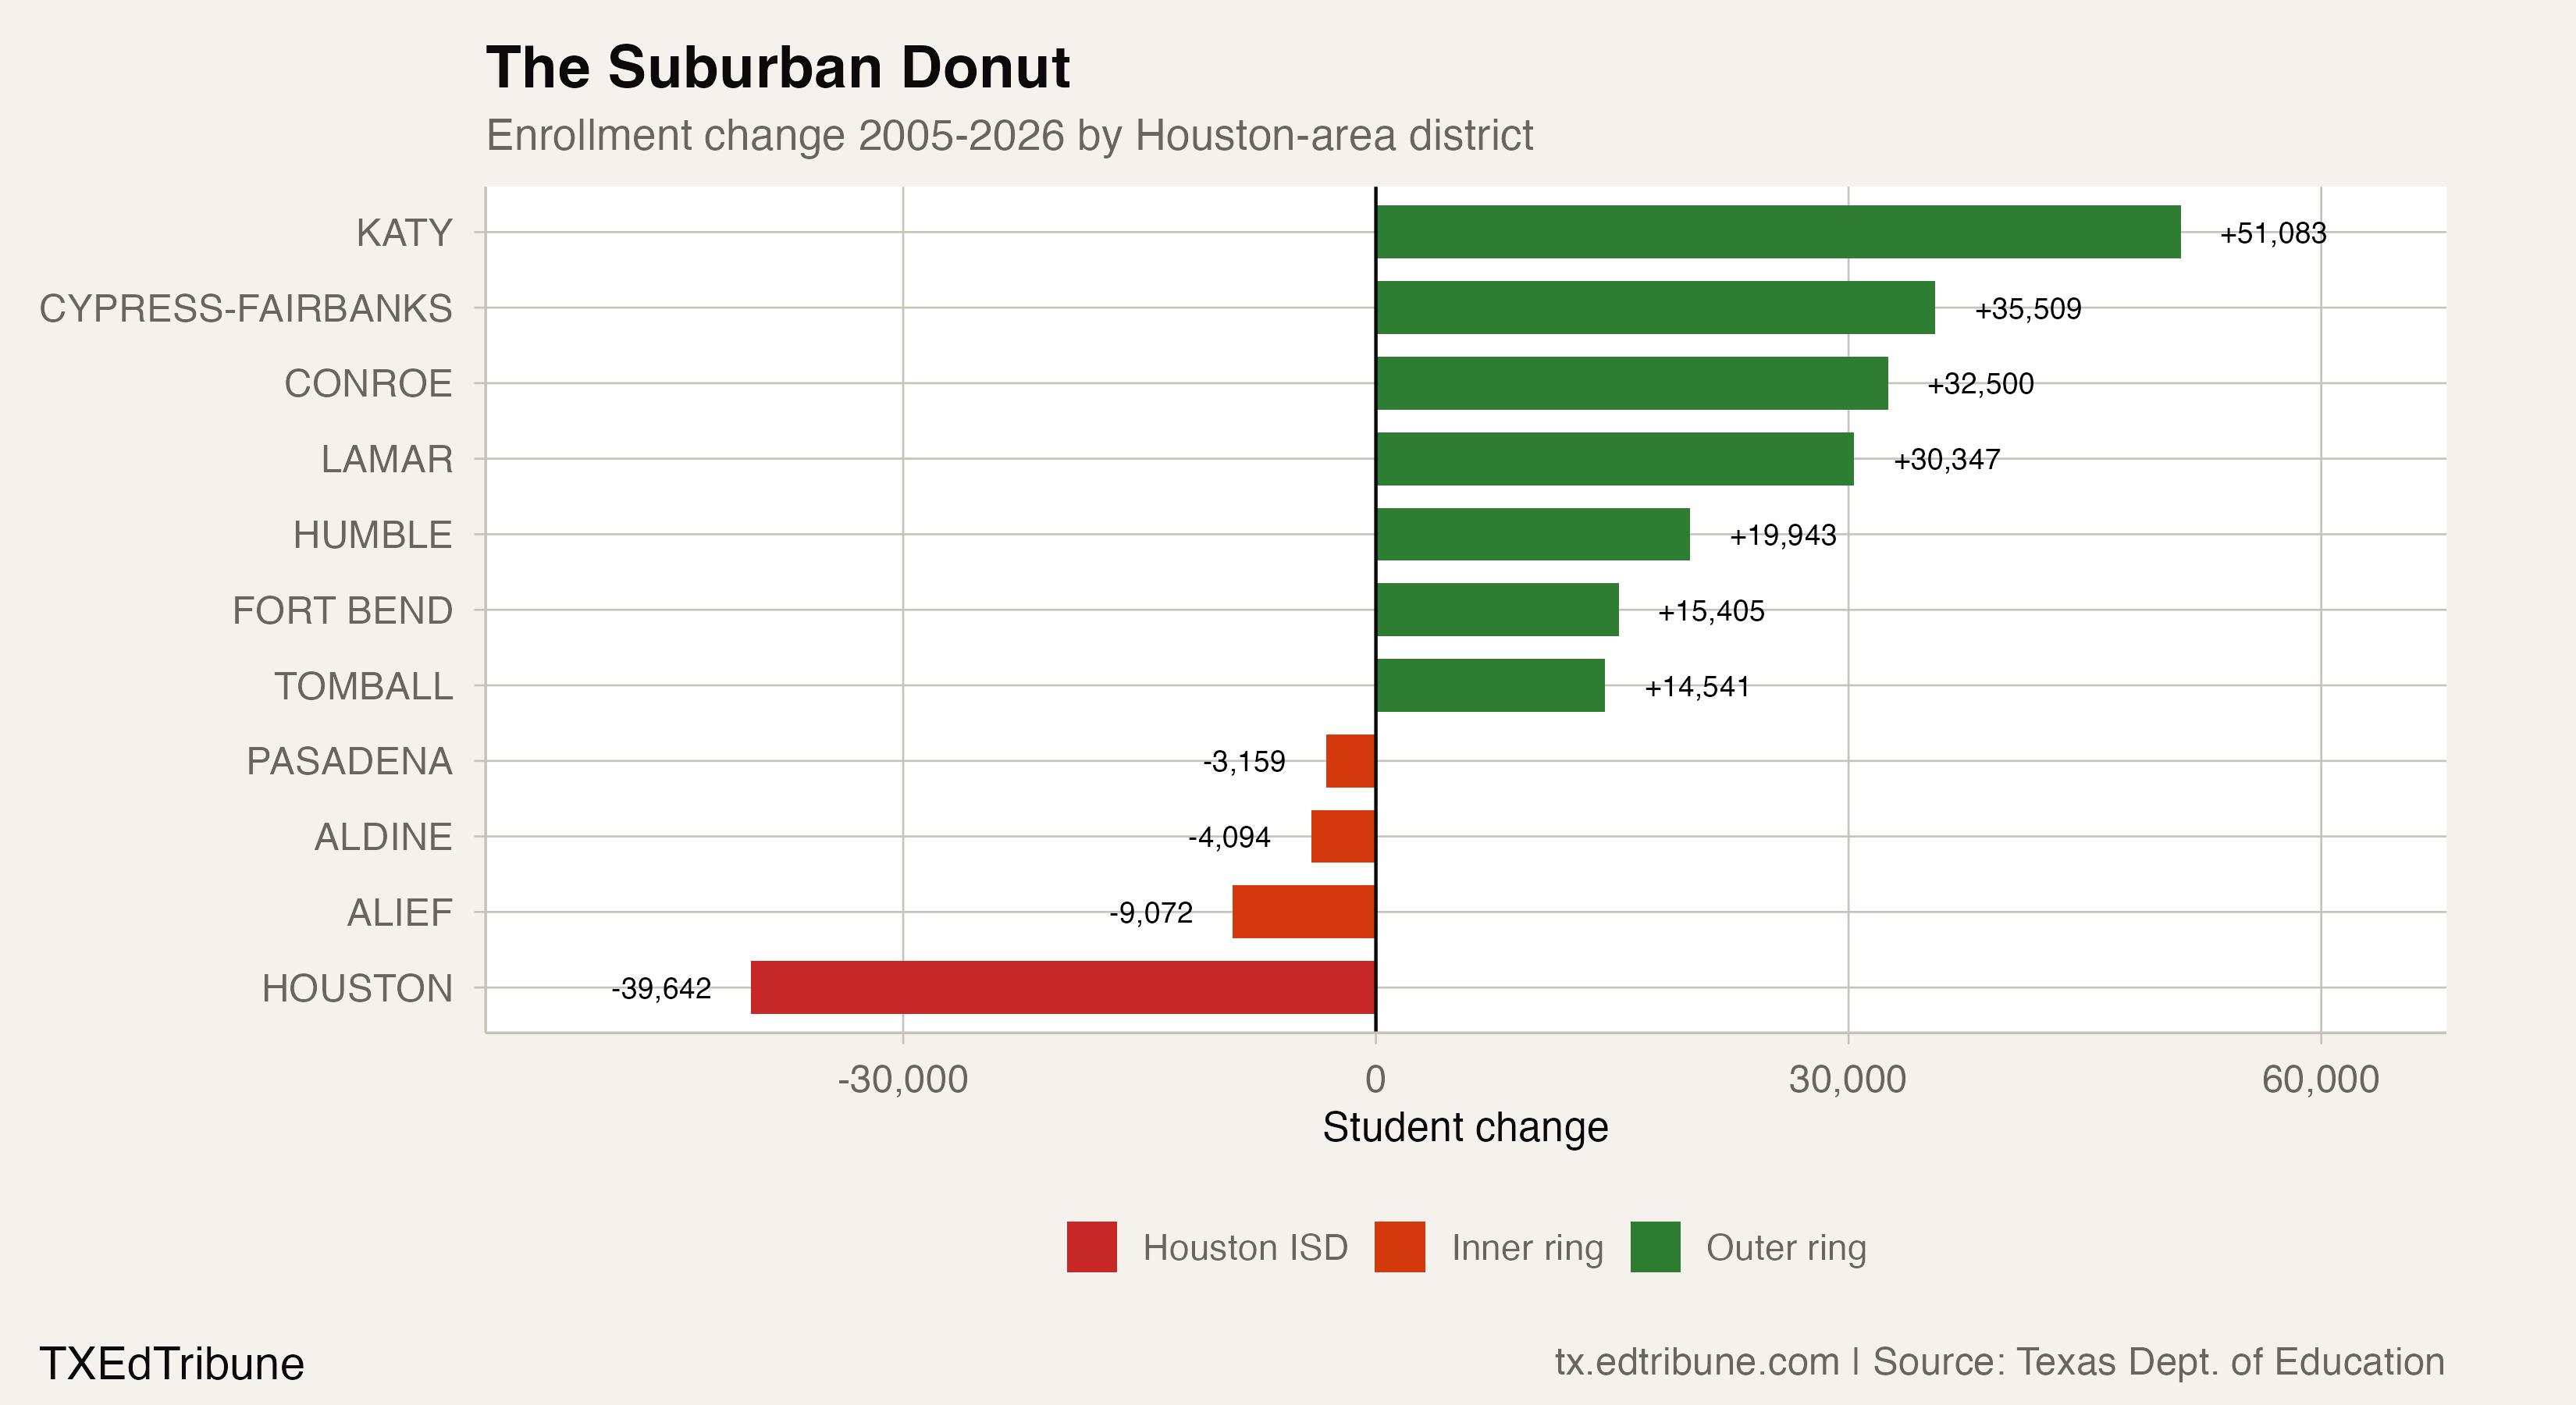
The comparison group containing Houston, Aldine↗ET, Alief↗ET and Pasadena↗ET had a net loss of 40,190. That combined result does not mean each district declined. Aldine's count was 56,255 at the start and 56,339 at the end, a gain of 84.
Alief went from 45,513 to 38,556, while Pasadena went from 47,305 to 46,403. Houston accounts for the largest historical count loss among these four selected districts.
These are explicitly selected comparisons, not a total for the Houston metro area. They establish divergent district counts. They do not track households or show that Houston ISD's former students became students in the growing districts.
Kindergarten and first grade are smaller historical snapshots
Houston's historical kindergarten count went from 16,239 in 2004-05 to 12,097 in 2024-25. The difference was 4,142 students, or 25.5%.
The historical first-grade count went from 18,176 to 12,881, a decline of 5,295, or 29.1%.
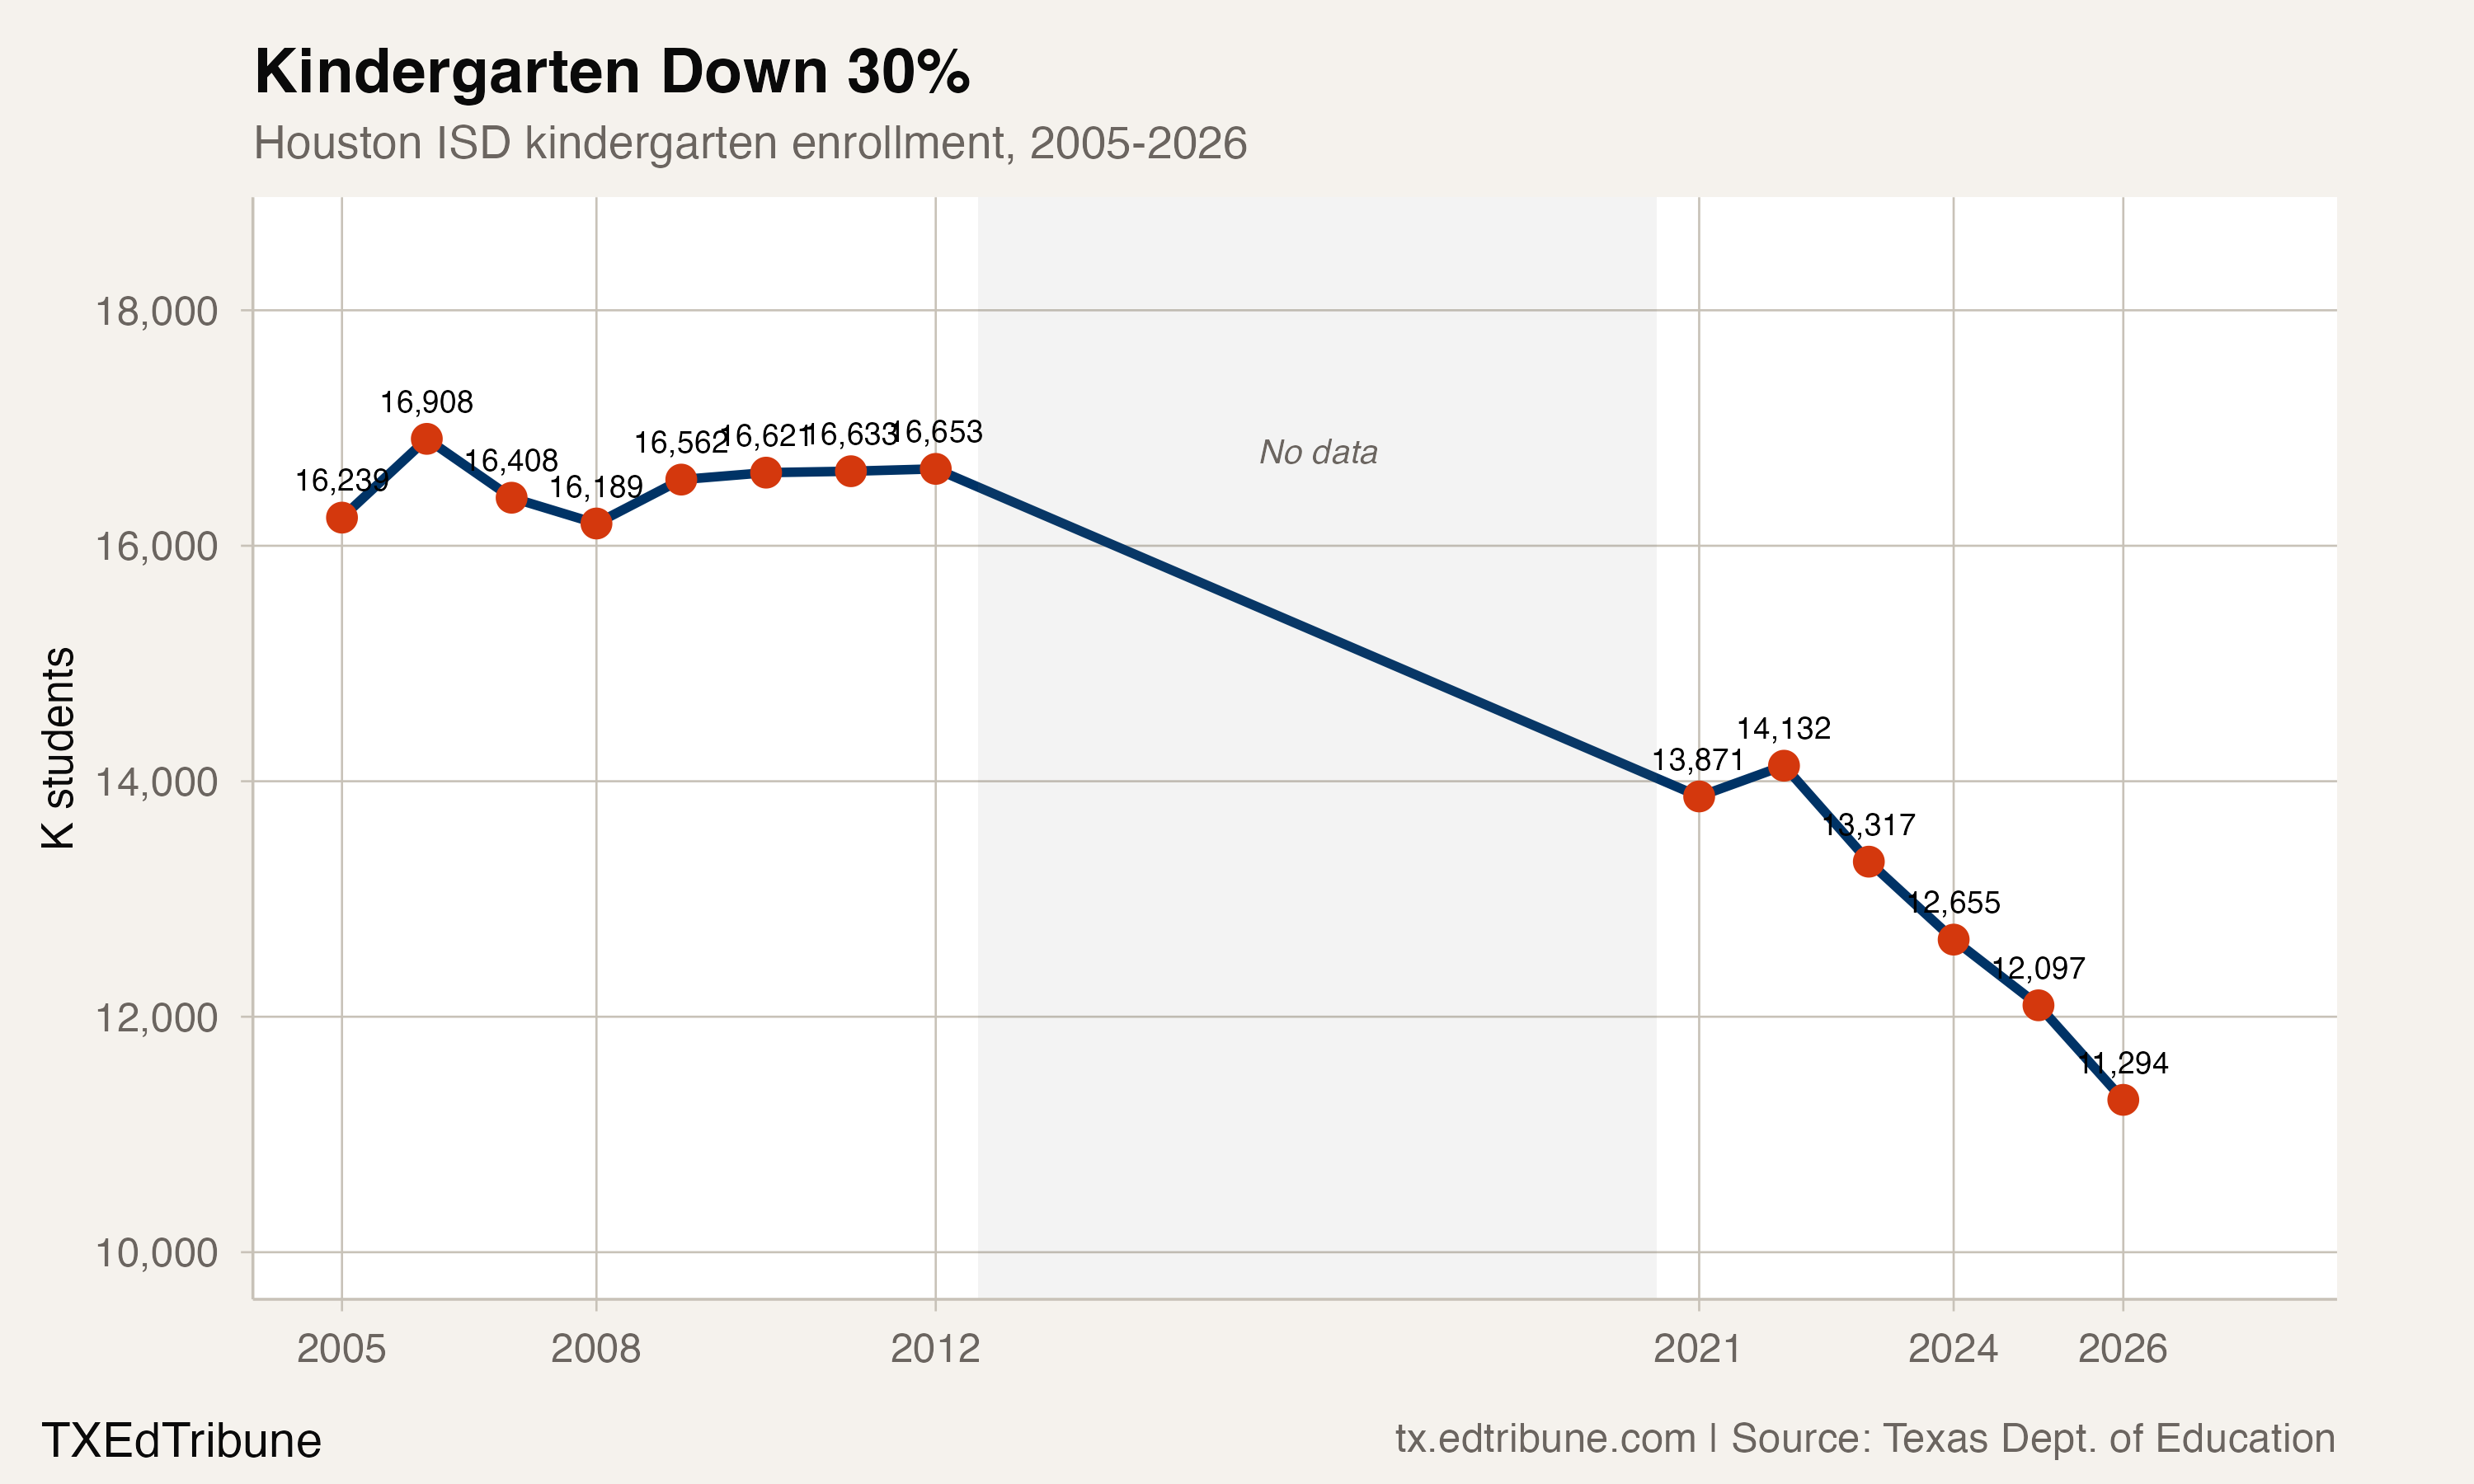
Those counts describe students enrolled in particular grades in particular years. They do not follow the same students forward. This comparison contains no student-level records following those kindergartners forward. It cannot establish a future enrollment ceiling.
Reported race counts and published-total shares
The historical files counted 60,577 Black students at the start and 36,593 at the end, a decline of 23,984, or 39.6%. Their shares of Houston's published total were 29.1% and 20.8%.
Hispanic counts were 123,005 and 108,608, while their published-total shares were 59% and 61.7%. White counts were 18,428 and 17,639, with shares of 8.8% and 10%.
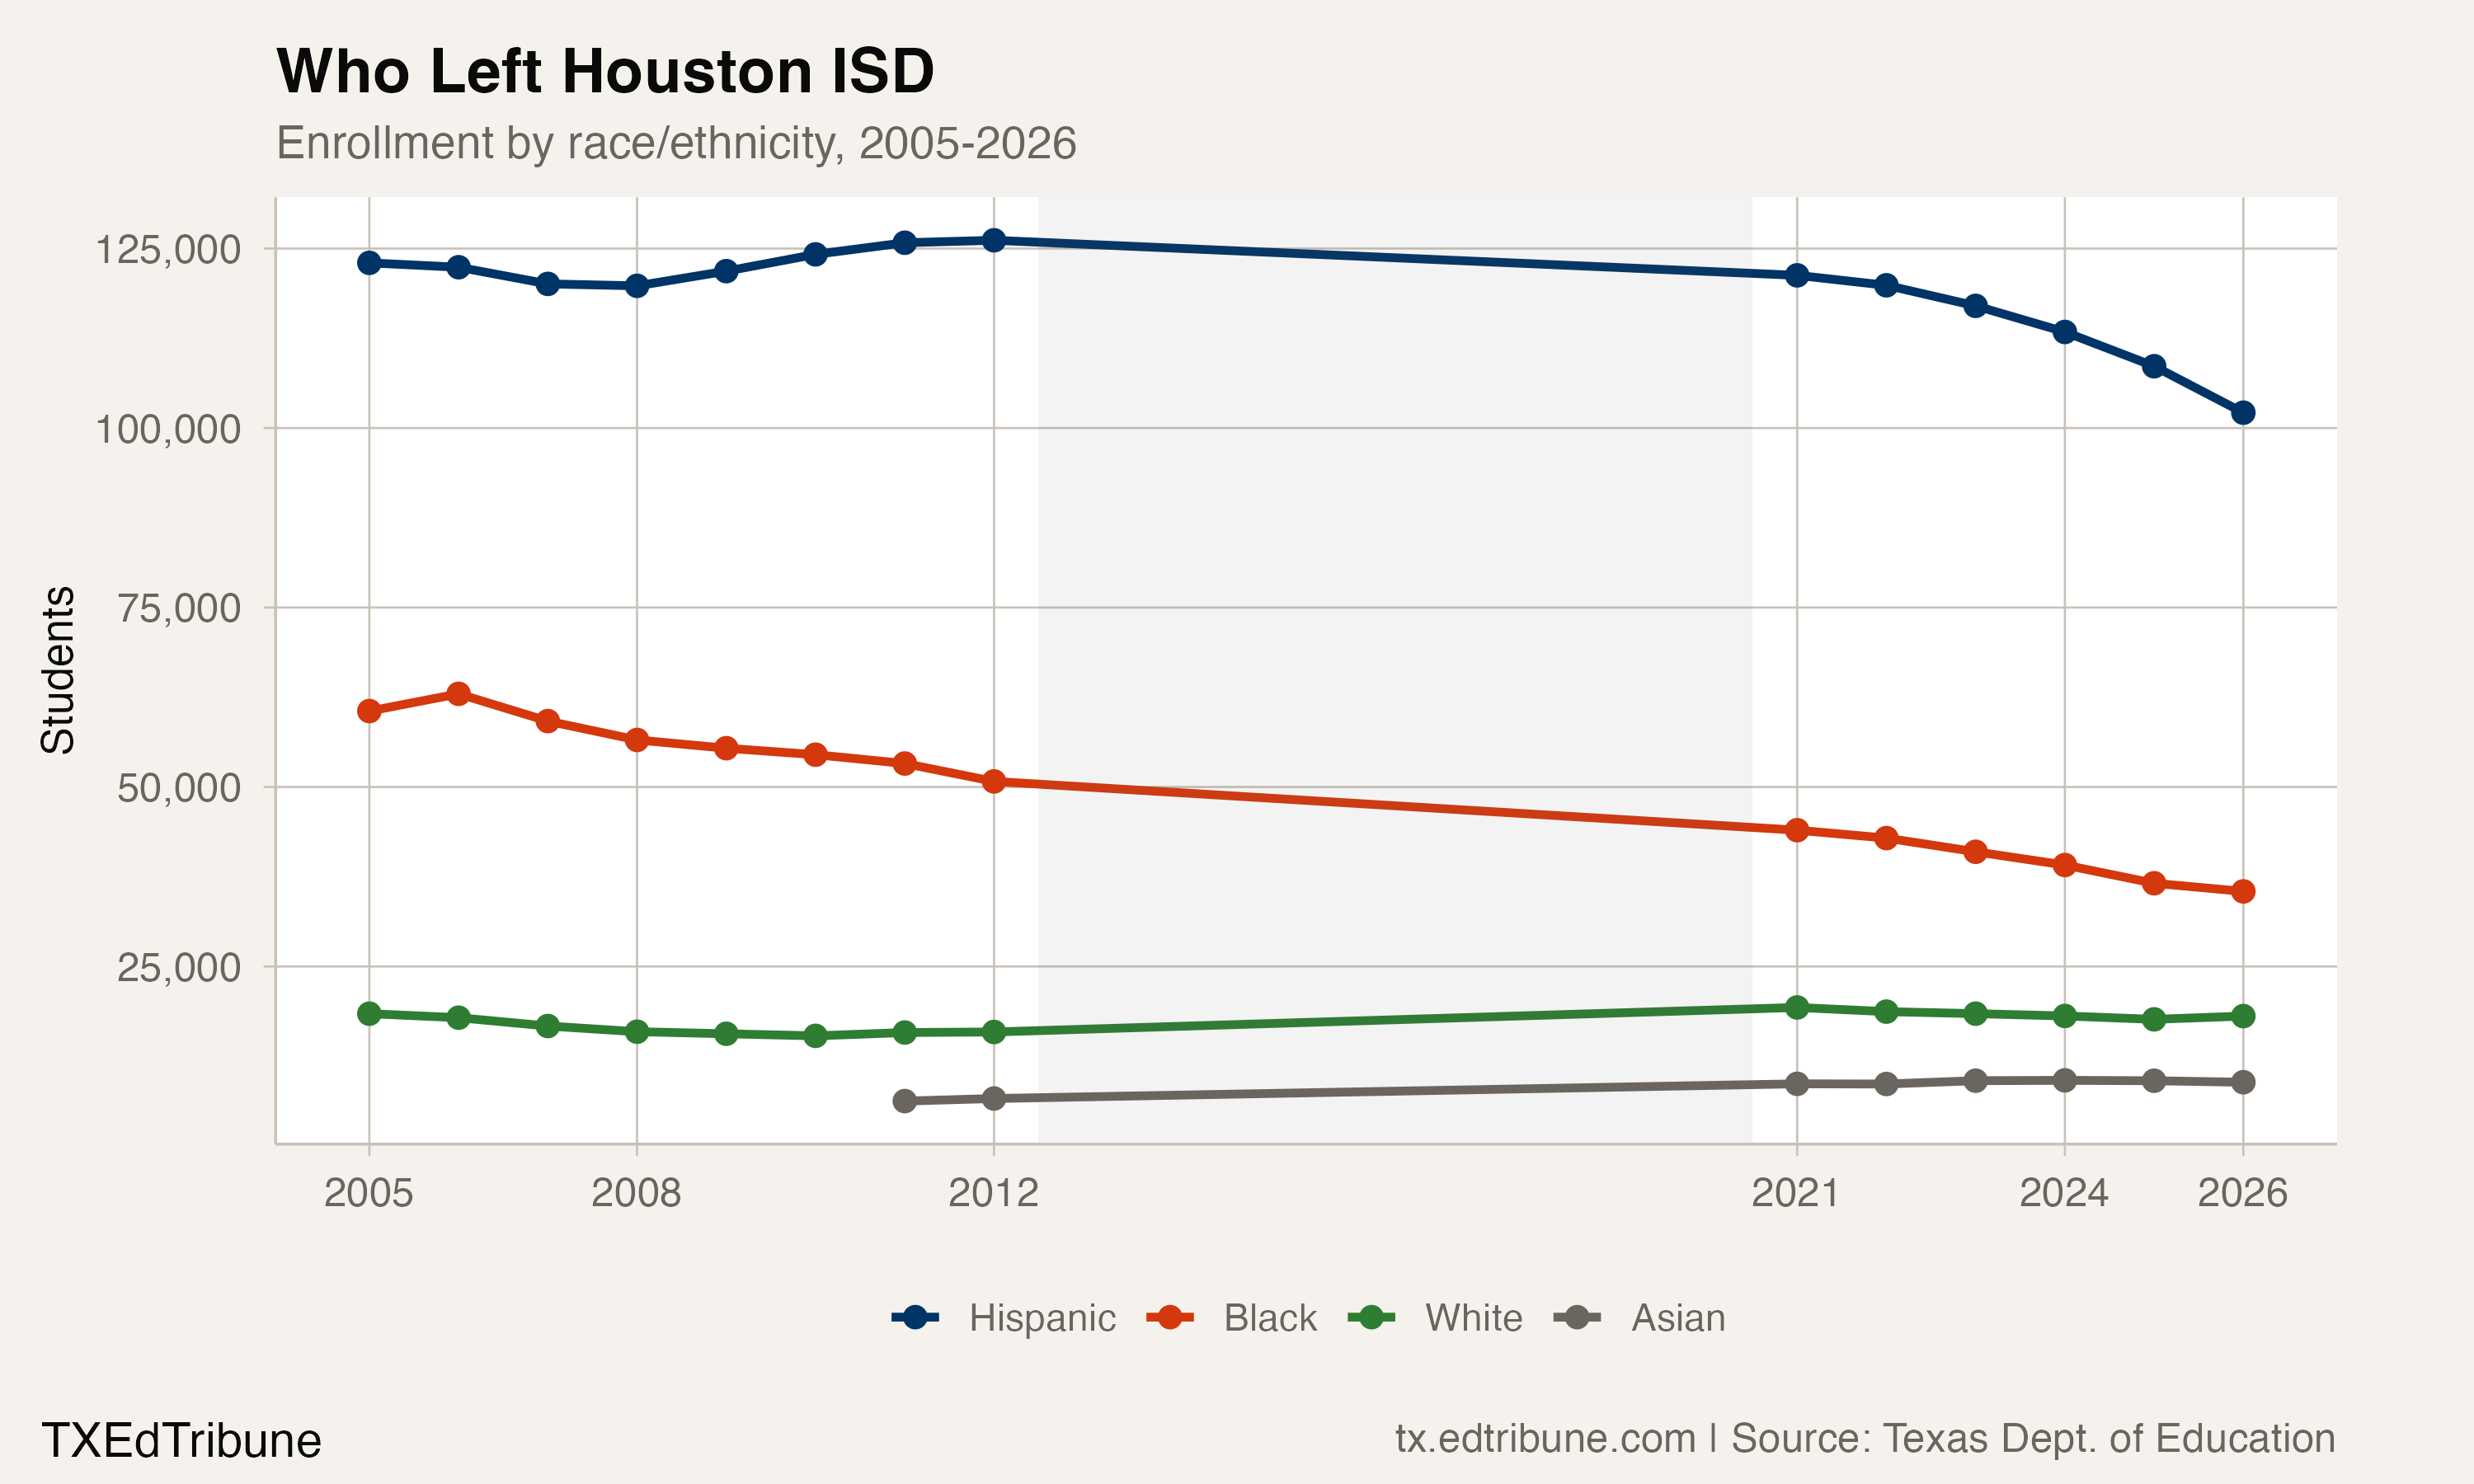
Every share uses the district's published total in the same year. The complete reported categories reconcile to that total throughout the historical window, including the earlier combined Asian/Pacific Islander category. The chart shows the three named categories above; it does not splice a combined category into the later separated categories.
A change in a reported category is not an identified count of families who left. The files do not determine how much of a change reflects transfers, movement, classification, or other circumstances.
Houston's historical low through 2024-25 and its newer report's 2025-26 annual decline are separately established. Neither establishes the district's live 2026-27 enrollment or a forecast for the years ahead.
Sources: Texas Education Agency annual performance reports, including earlier AEIS reports, and separate Student Enrollment Reports.
Detailed code that reproduces the analysis and figures in this article is available exclusively to EdTribune subscribers.
Discussion
Sign in to join the discussion.
Loading comments...