In this series: Texas 2025-26 Enrollment.
White students accounted for 24.3% of Texas public school enrollment in 2025-26, last school year and the most recent published year used here. The state's separate historical annual performance reports show the share falling from 37.7% in 2004-05 to 24.4% in 2024-25.
Those historical files reported 1,653,008 White students at the start and 1,347,596 at the end, a decline of 305,412 students, or 18.5%. That is a comparison within the historical reports; the 2025-26 number is not joined to that line.
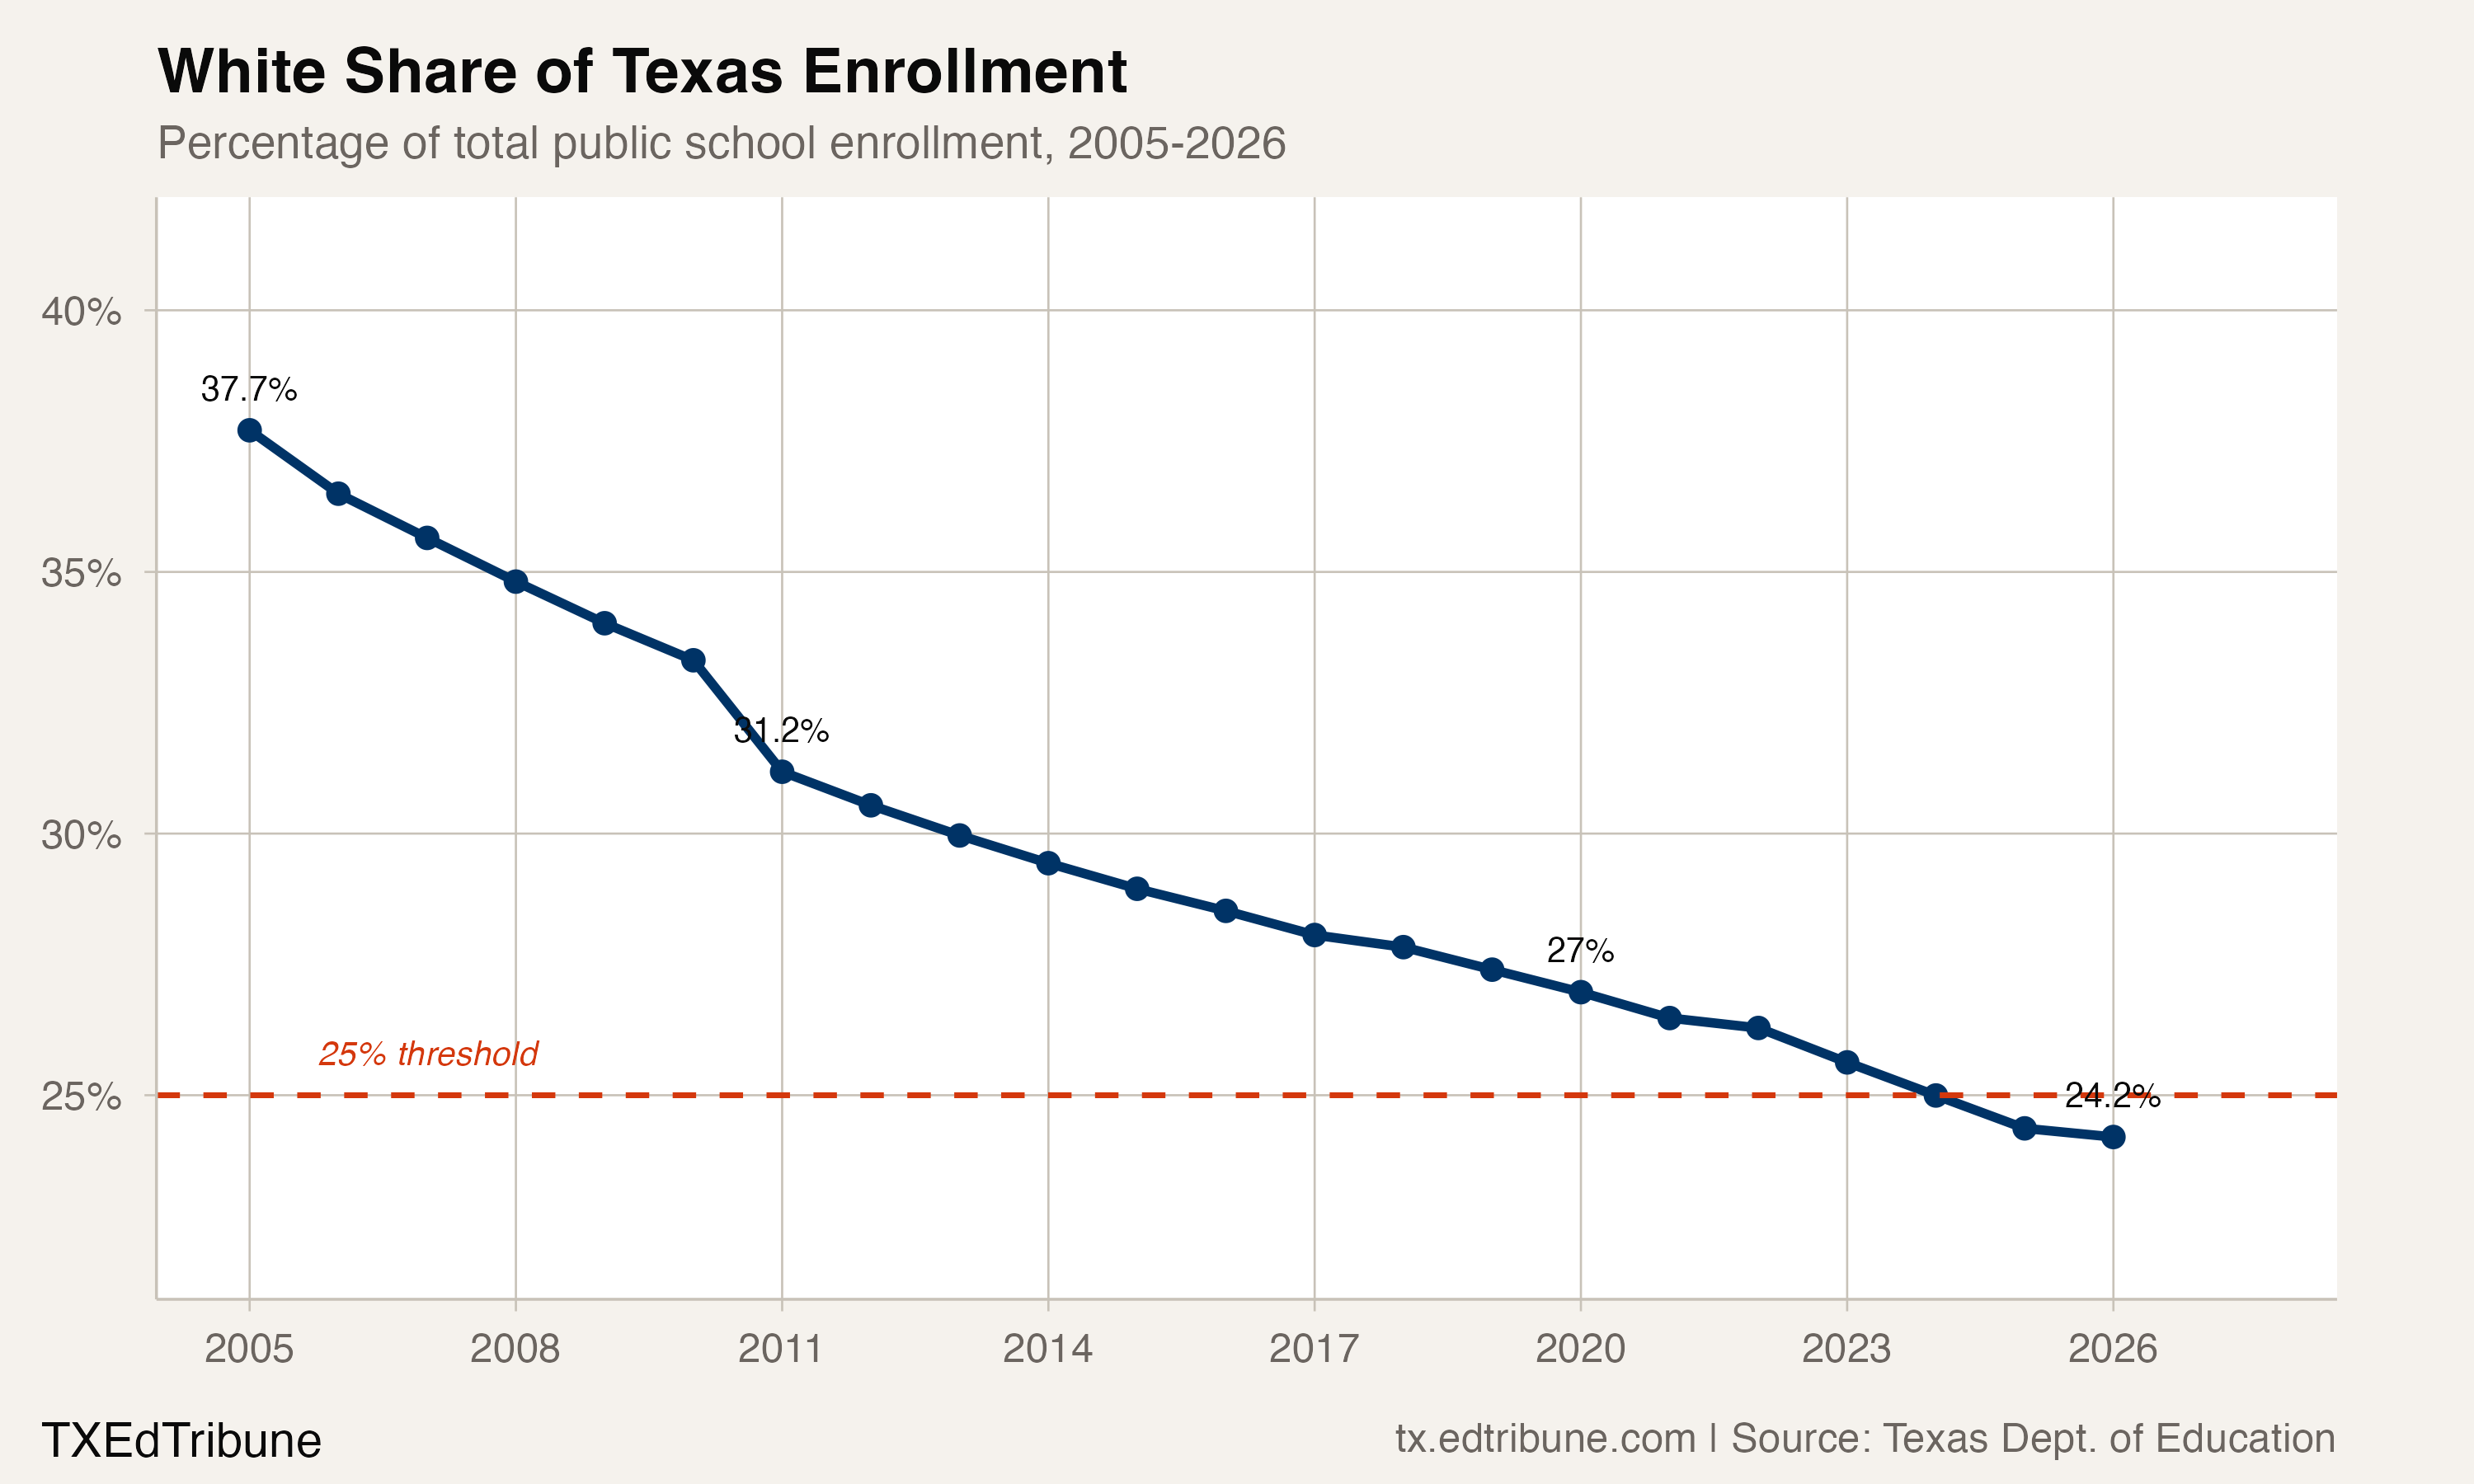
When the historical line crossed a quarter
The first historical report below one-quarter was 2023-24. It counted 1,379,090 White students out of 5,517,464 statewide, or 24.995%. That share rounds to 25.0% at one decimal place, so the threshold test uses the unrounded ratio. Every earlier year in the historical window was at or above one-quarter.
The more recent Student Enrollment Reports provide their own comparison. They counted 1,352,852 White students in 2024-25 and 1,326,643 in 2025-26, a decline of 26,209 students, or 1.9%. Their White shares were 24.4% and 24.3%; both were below one-quarter.
The overlapping year has different counts in the two reports. Each annual comparison here stays within its own report series.
What the reported categories can tell us
The historical earlier report format combined Asian and Pacific Islander students. The later glossary lists separate Asian and Pacific Islander categories and a category for two or more races. These are reported categories, rather than a record of how individual students' classifications changed.
The composition chart below begins in the later reporting era. Its published race counts reconcile to the statewide total in every year shown, and every share divides by that published total. The latest enrollment report's race categories also reconcile to its published state total of 5,467,642 students.
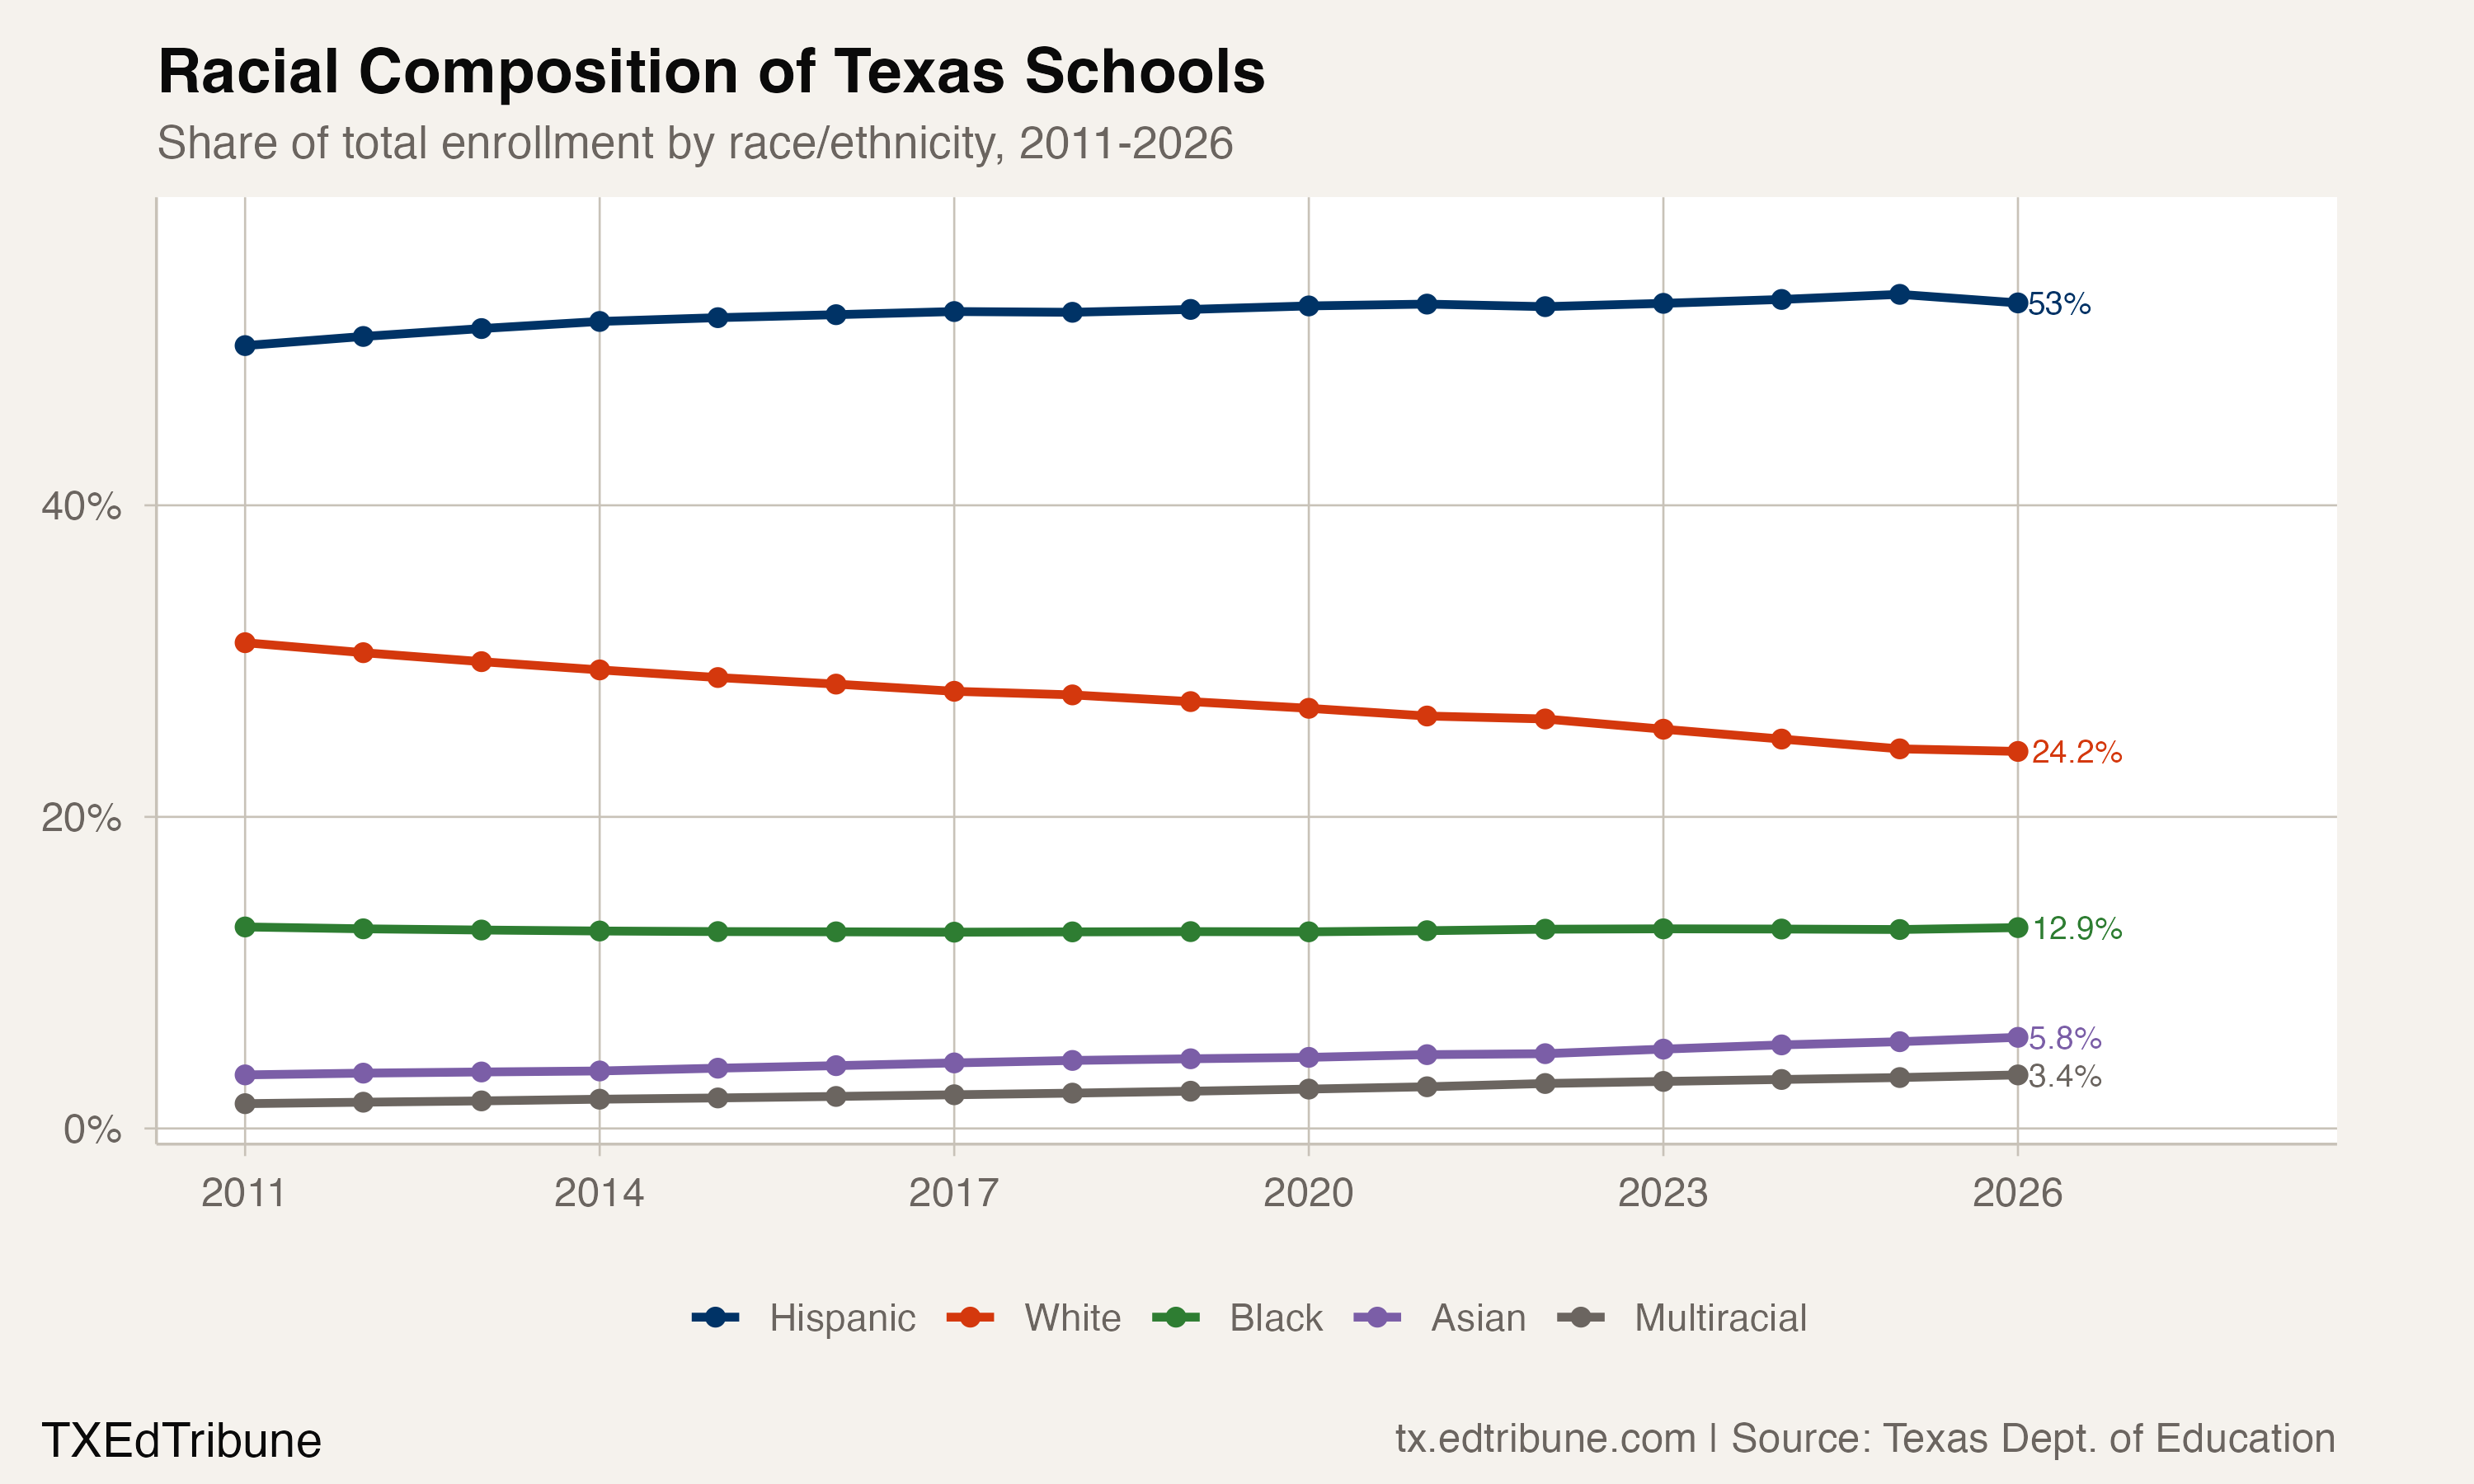
None of those totals identifies individual student departures. A change in reported White enrollment is not a count of White families who moved away, changed schools, or changed how a child was identified. The numbers establish the reported enrollment pattern, not its cause.
Selected districts show different combinations of growth and share
Cypress-Fairbanks ISD↗ET reported a White share of 48.7% in 2004-05 and 18.8% in 2024-25. Across those historical reports, its total enrollment grew by 38,470 while its reported White count fell by 16,405.
Katy ISD↗ET went from 60.6% to 25.4% over the same window. Its total grew by 51,707, while its White count fell by 2,420.
A declining share can accompany a growing count. Frisco ISD↗ET reported 6,410 more White students at the end of that historical window, but its share fell from 69.6% to 27.1%. Its total enrollment grew more than its White count.
Plano ISD↗ET moved from 59.7% to 28.4%. Forney ISD↗ET went from 78.6% to 21.7%, and Prosper ISD↗ET from 78.9% to 37.5%. All of these are historical comparisons through 2024-25, rather than bridges to the newer enrollment report.
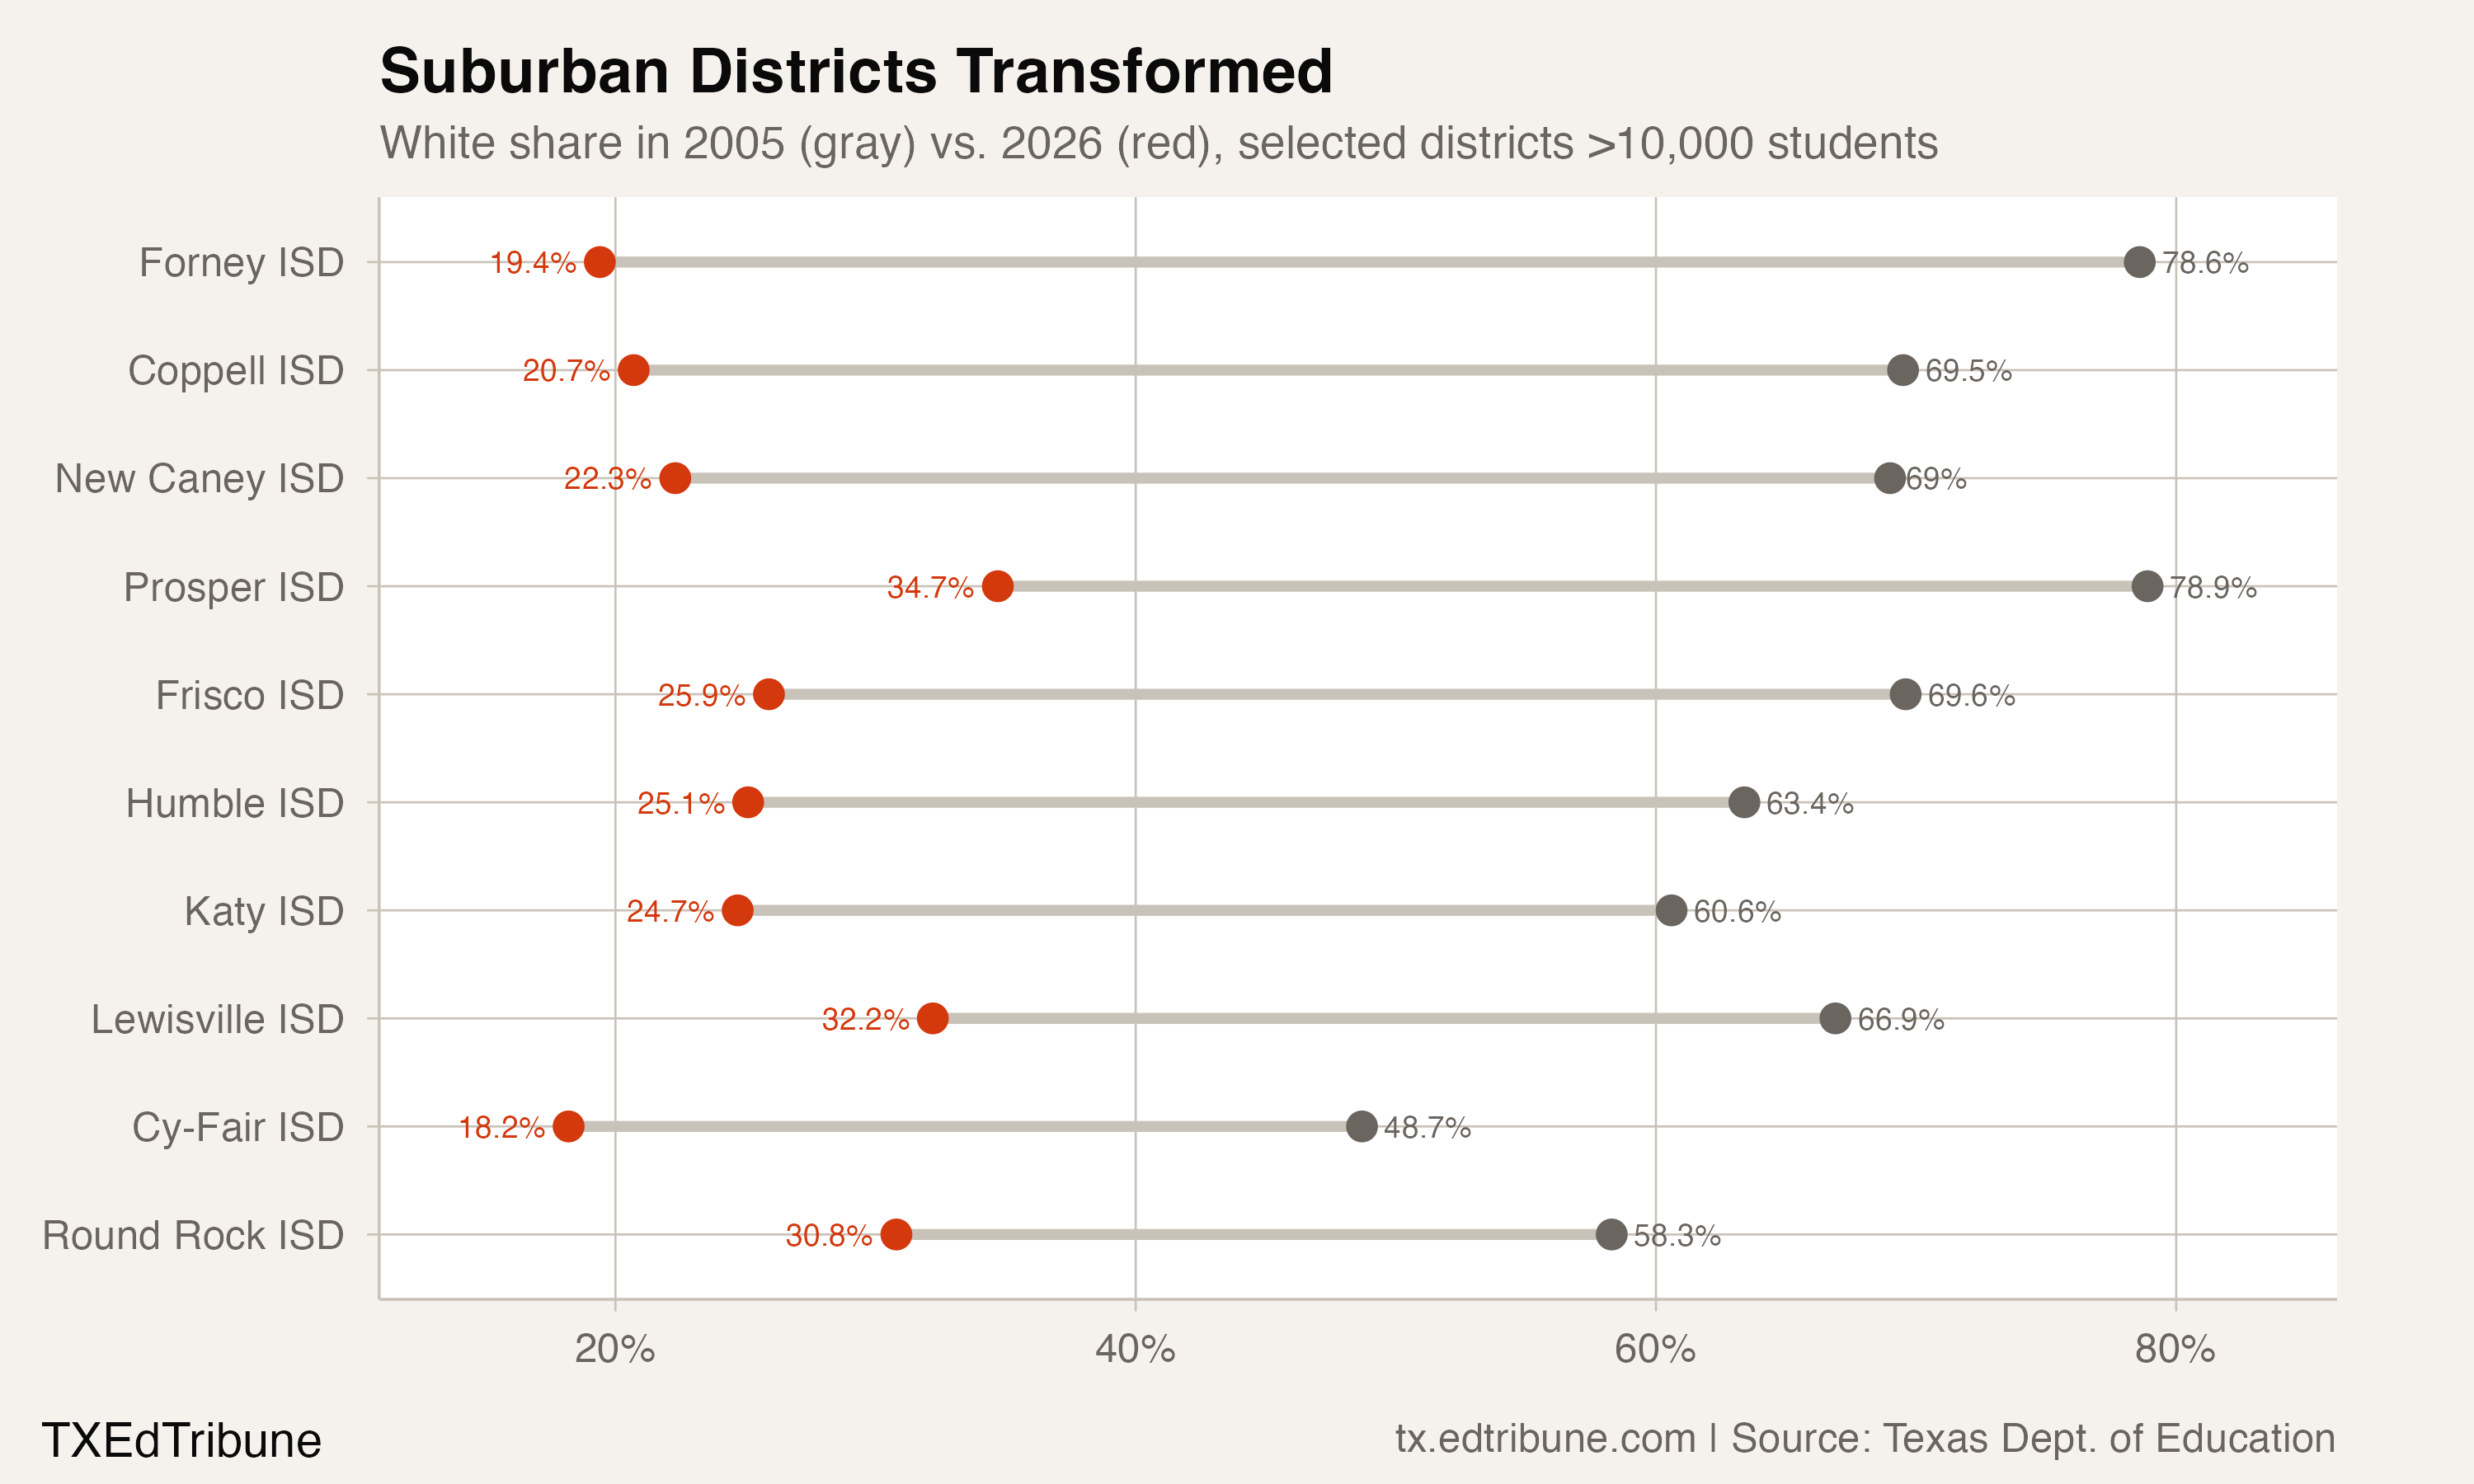
The published race categories reconcile to the district total at both endpoints for every selected district. These six examples do not stand in for every district in Texas.
A narrower statewide district comparison
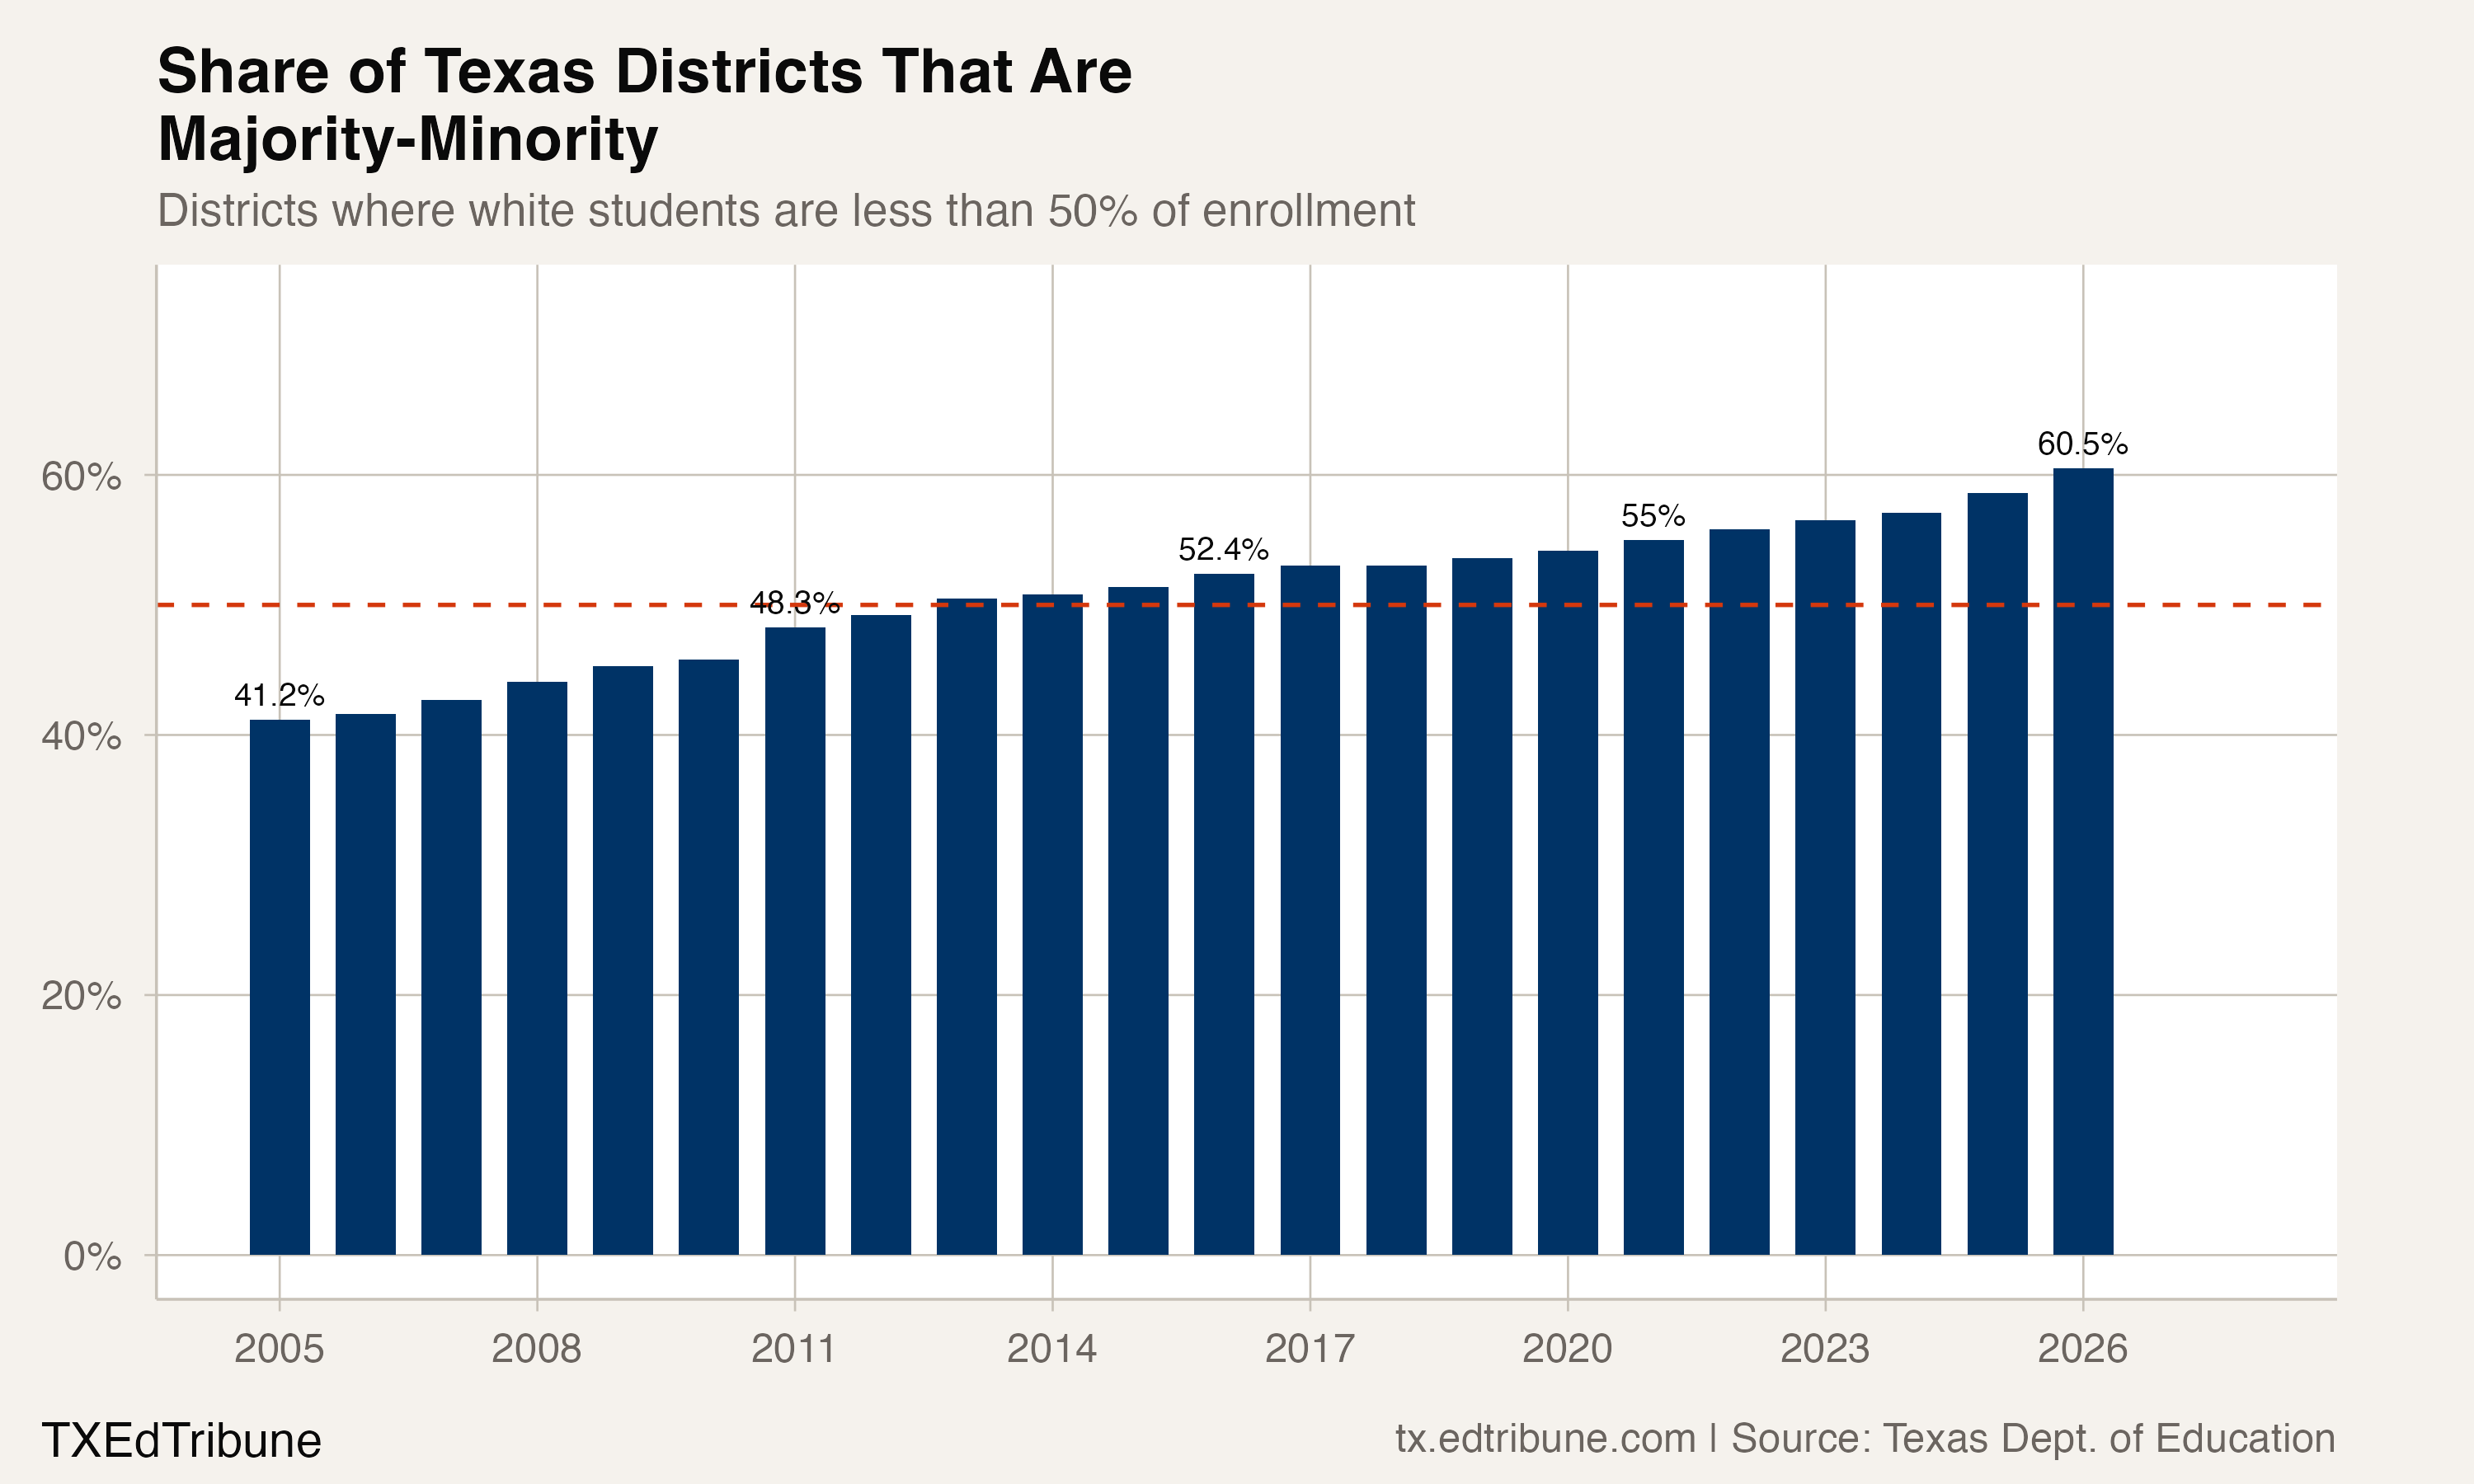
The 2025-26 enrollment report supplies 1,200 district total rows. A comparison of White shares can use 422 of them: those with a positive published total, a finite published White count, and reported categories covering at least 99.5% of that total. The other 778 are excluded for missing counts, zero totals, or inadequate category coverage.
Within that adequately reported group, 318 districts had a White share below half, or 75.4% of the eligible districts. That is a share of this comparison group, rather than a claim about all Texas districts. No masked White count is converted to zero or classified as a minority district.
Counts do not supply a forecast
The annual historical changes below describe what the reports counted. They do not test whether birth rates, migration, school choice, or reporting classifications caused an individual year's change. Those explanations would require their own evidence.
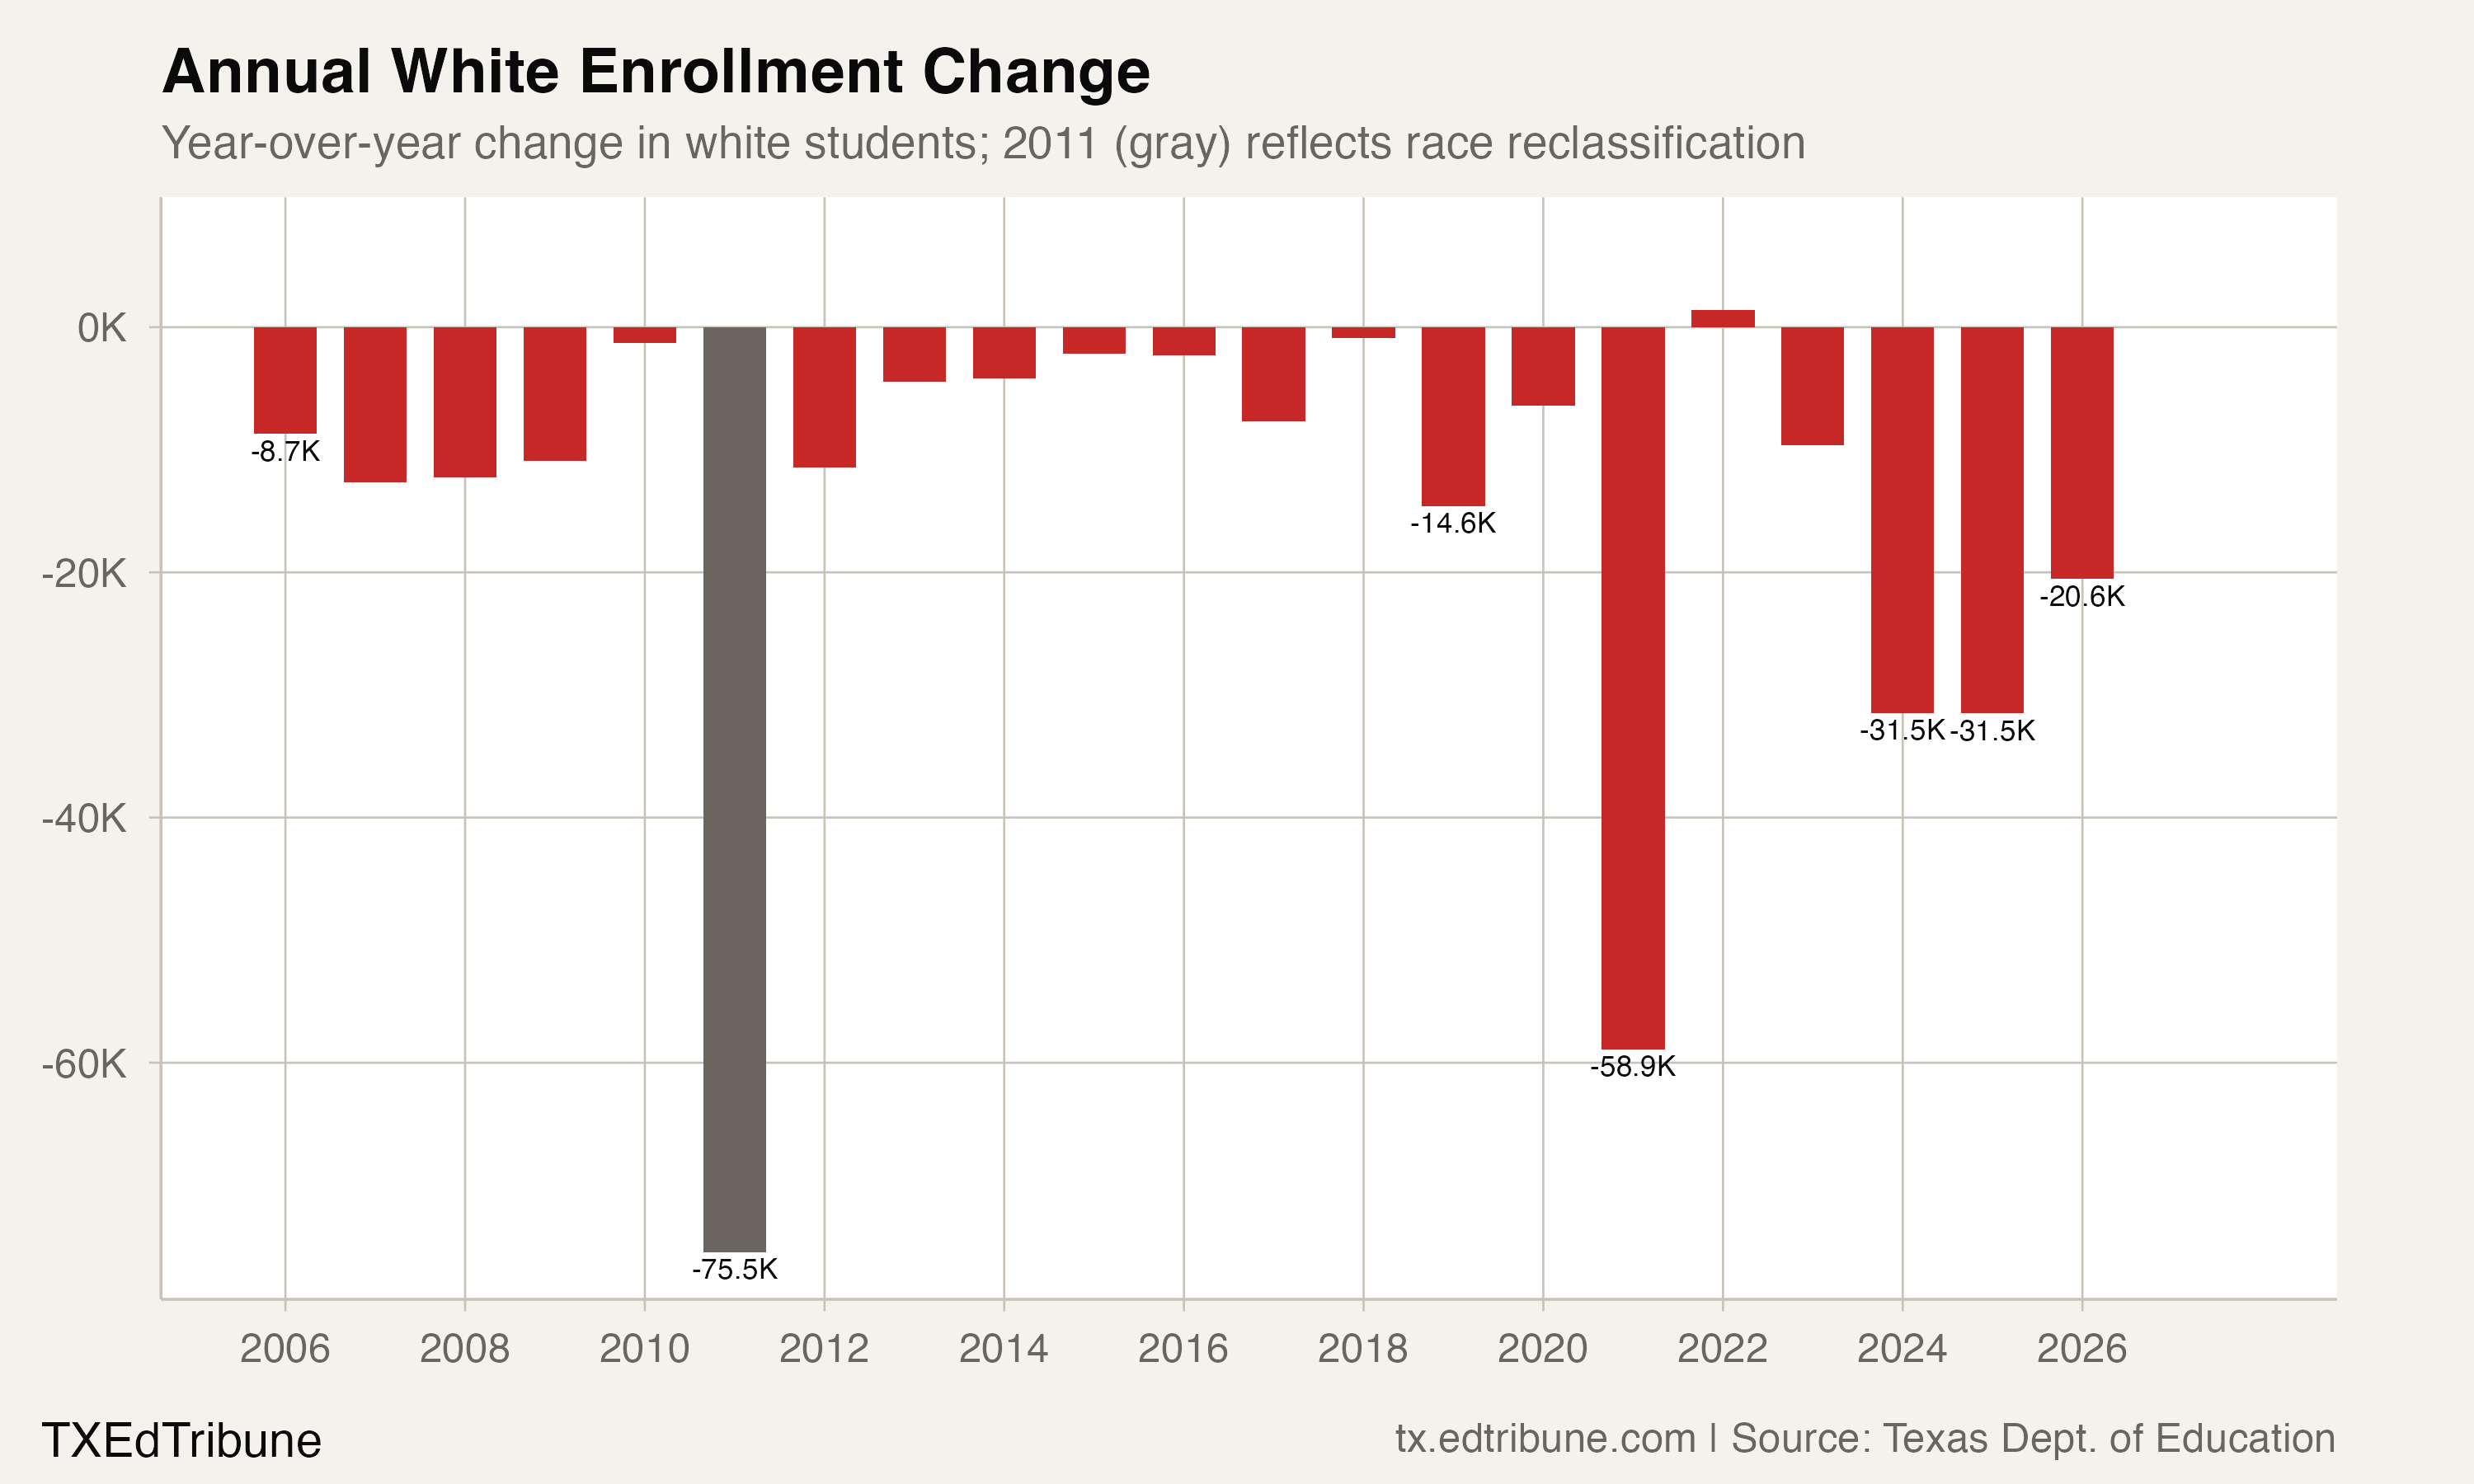
The decline in the historical reported White count and the recent same-report decline are separately established. Neither calculation predicts when enrollment will reach a future threshold.
The 2026-27 school year is now underway. The figures here describe last school year and earlier reports, rather than a live count of today's students.
Sources: Texas Education Agency historical annual performance reports, including AEIS, and its separate Student Enrollment Reports. Historical comparisons cover 2004-05 through 2024-25; recent comparisons cover 2024-25 and 2025-26.
Detailed code that reproduces the analysis and figures in this article is available exclusively to EdTribune subscribers.
Discussion
Sign in to join the discussion.
Loading comments...