In this series: Texas 2025-26 Enrollment.
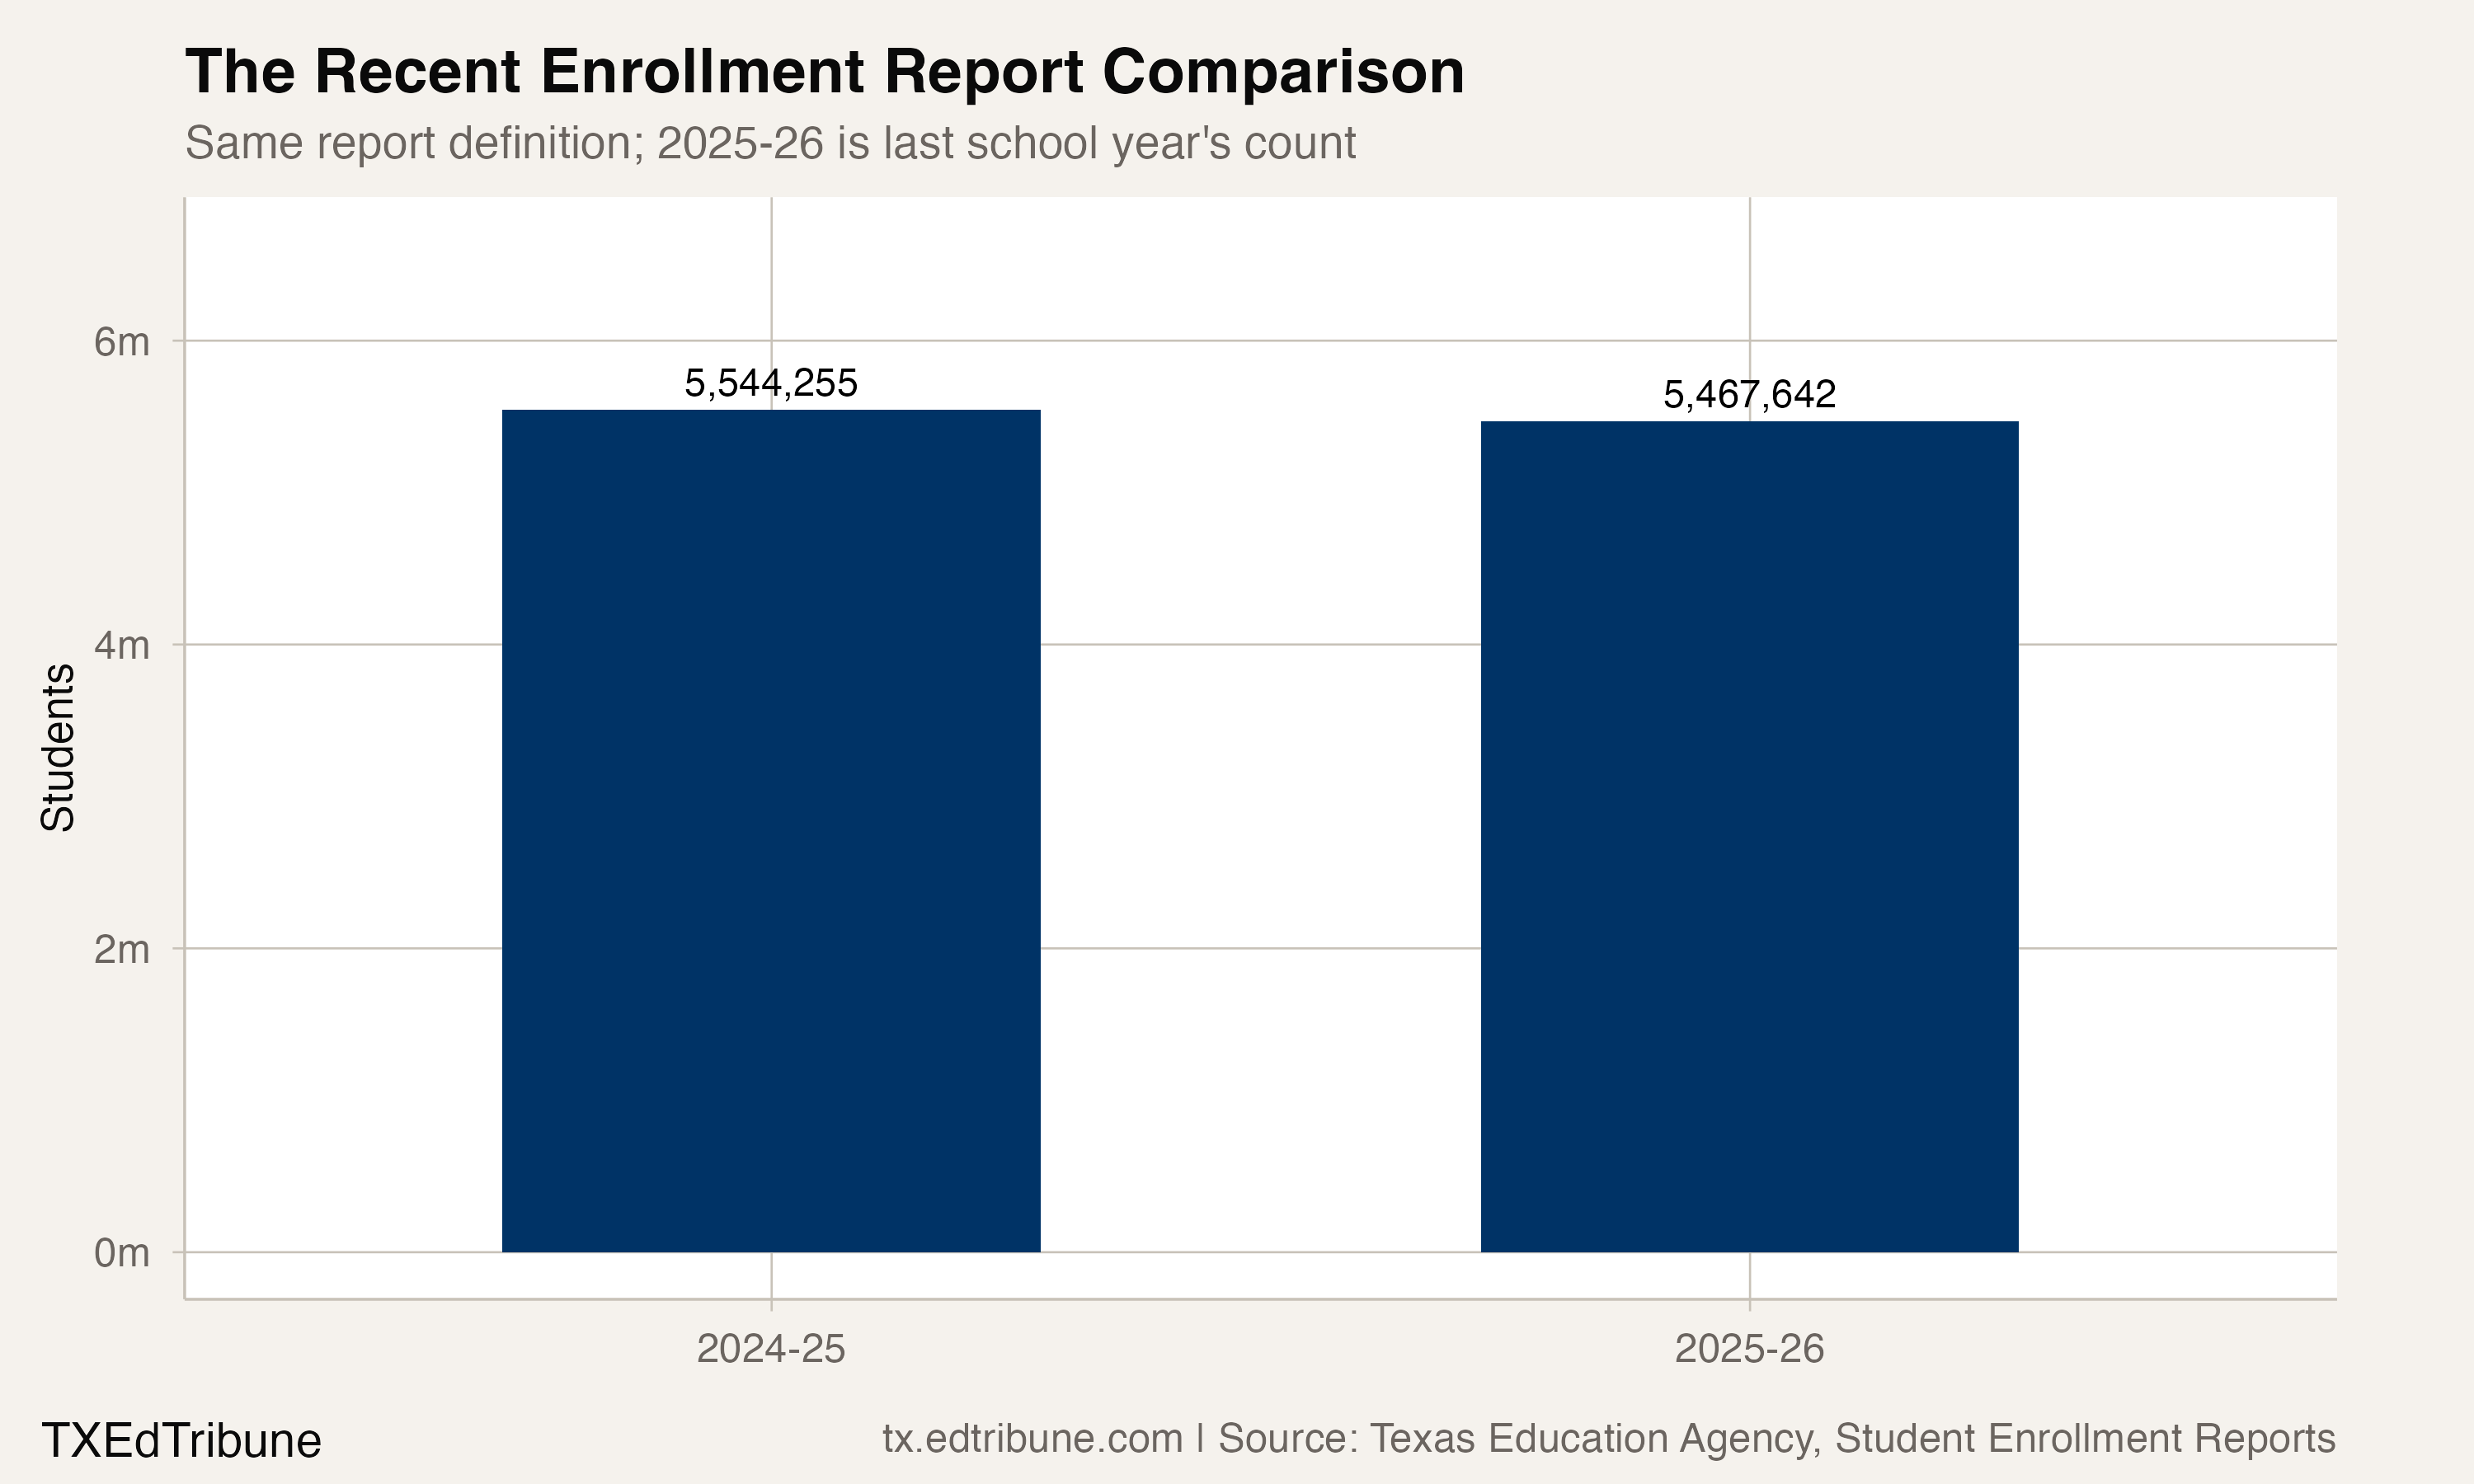
Texas reported 5,467,642 public school students in 2025-26, last school year and the most recent published enrollment year used here. The same state enrollment report counted 5,544,255 students in 2024-25. That is a decline of 76,613 students, or 1.4%.
Those figures come from the Texas Education Agency's Student Enrollment Reports. They establish a statewide decline between those two reporting years. They do not tell us why enrollment changed or which families moved, changed schools, or never enrolled.
Two reports, two comparisons
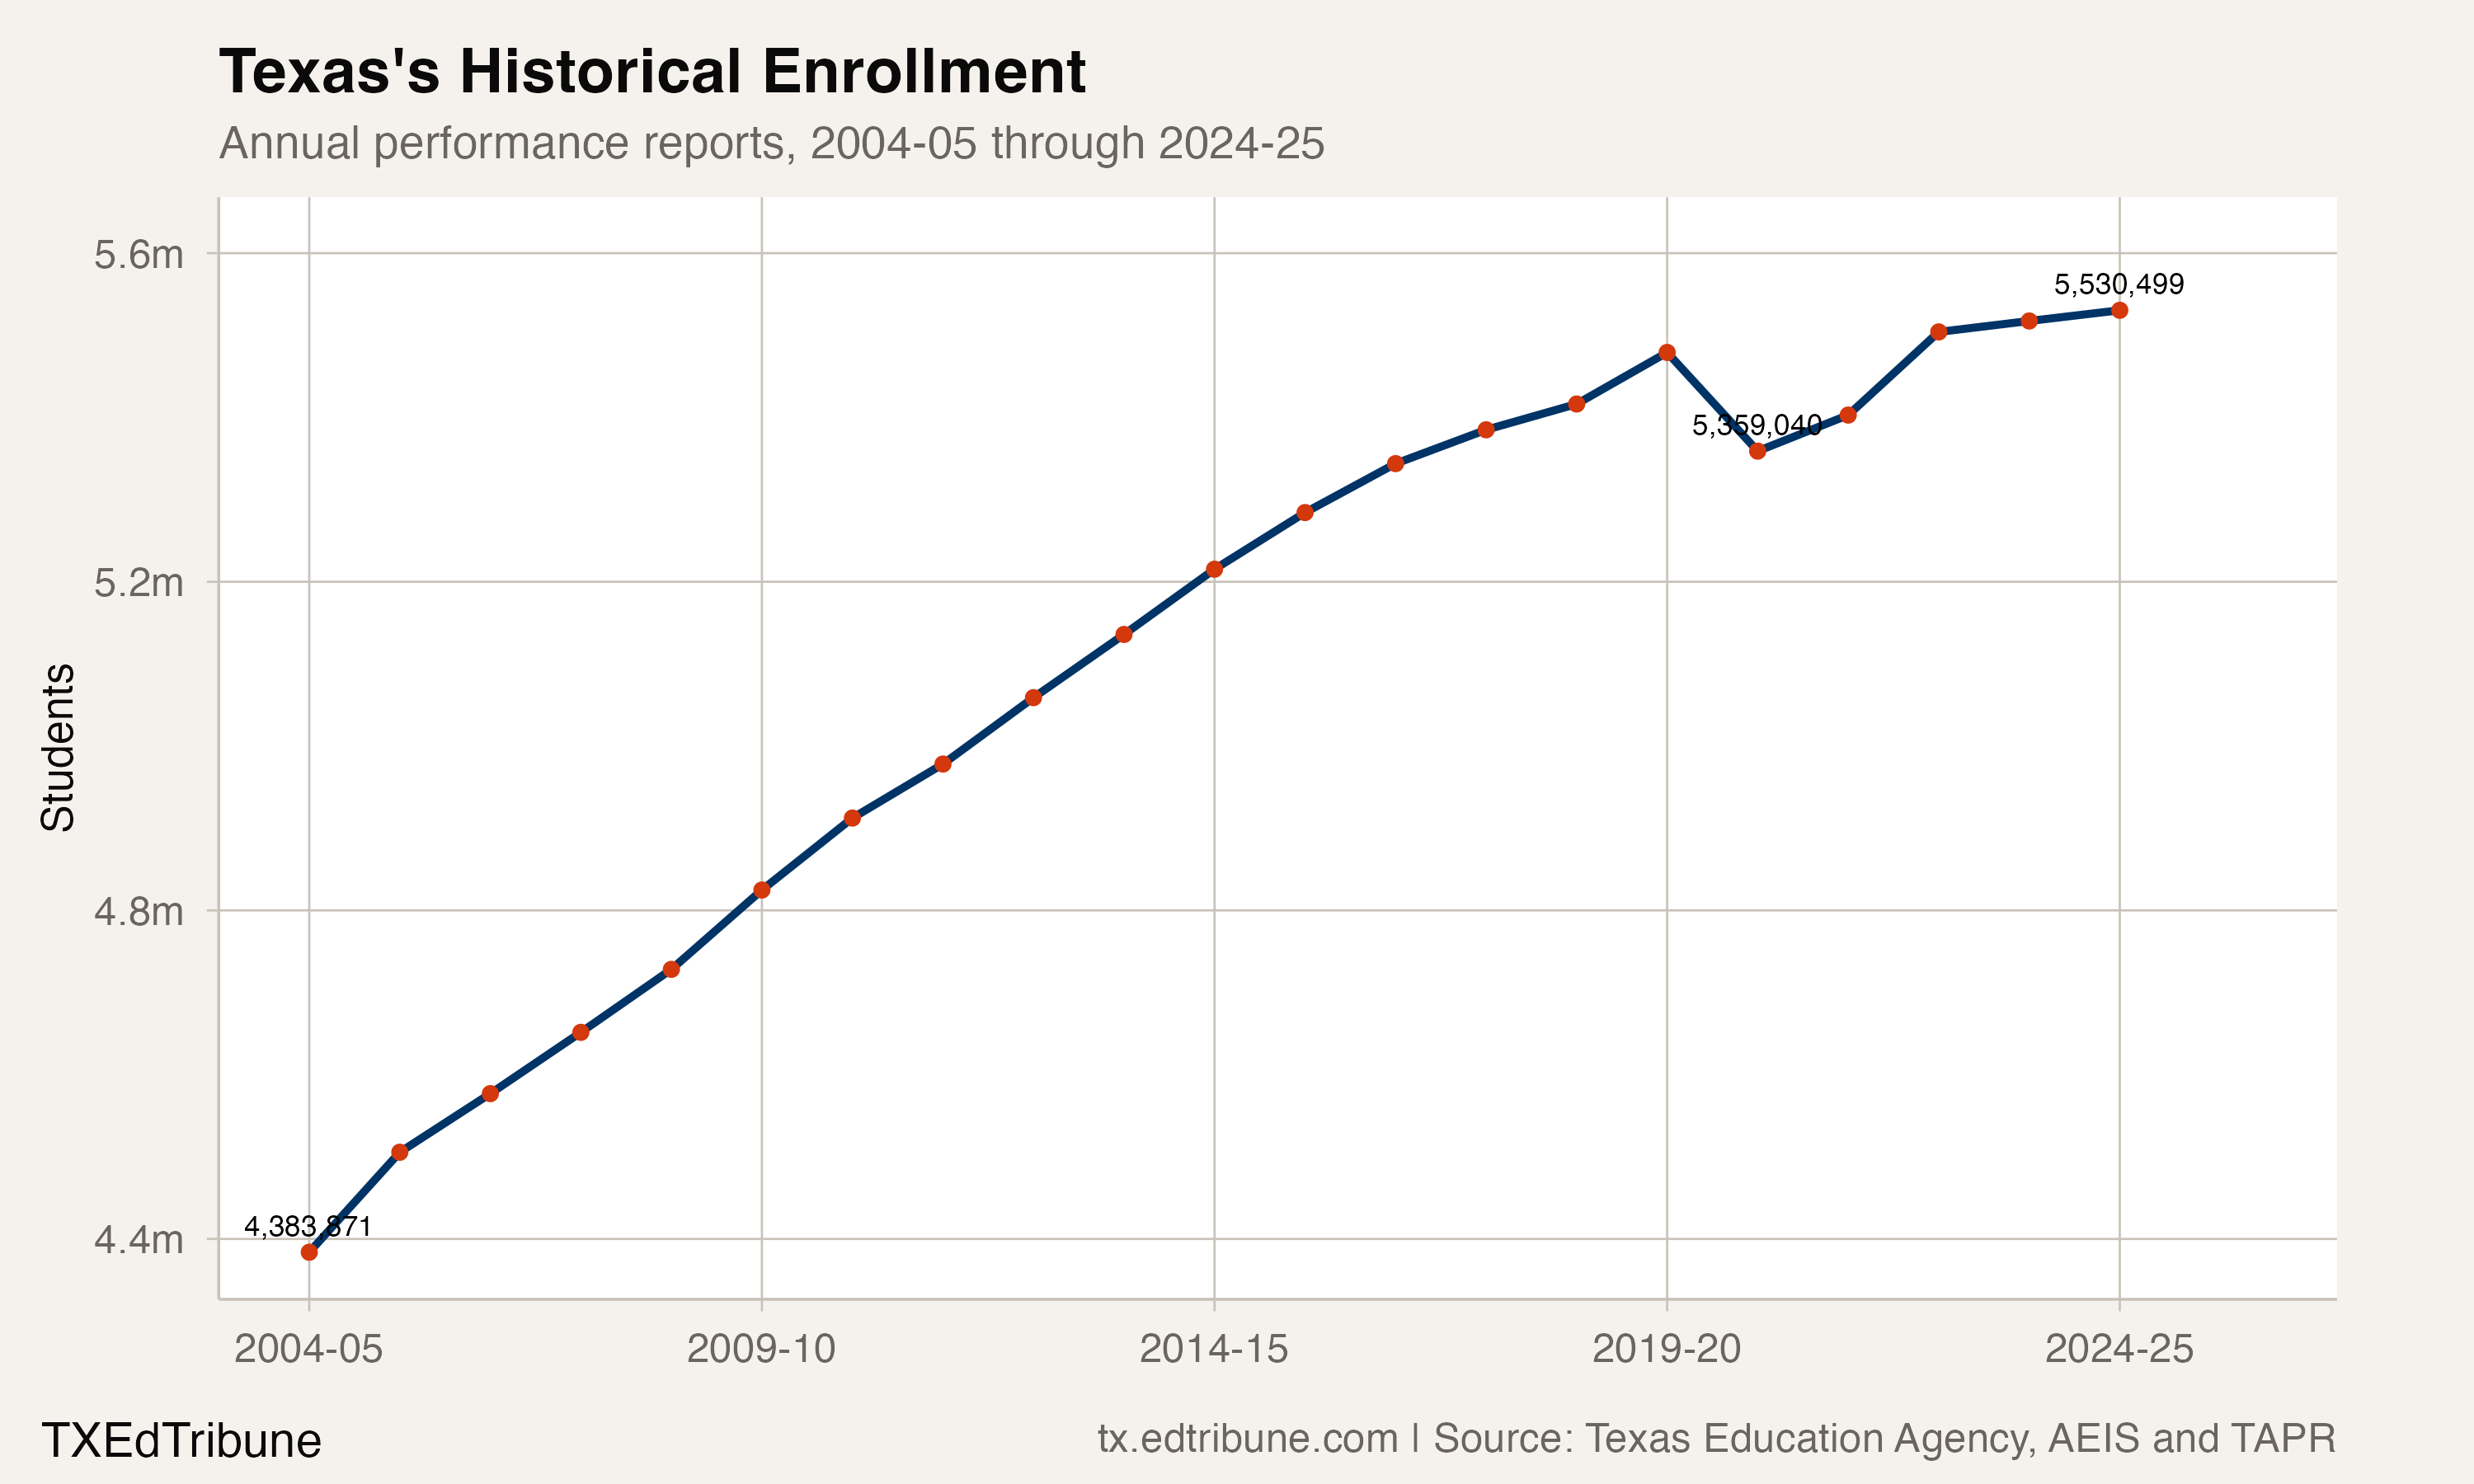
Texas also publishes enrollment in its annual performance reports. Those historical files counted 4,383,871 students in 2004-05 and 5,530,499 in 2024-25, a gain of 1,146,628 students, or 26.2%, across 21 annual reports.
The overlapping year is a reason to keep the series separate. The historical performance report's 2024-25 count is lower than the 2024-25 count in the newer enrollment report. The reports give different totals for that overlapping year. Their comparability has not been established here, so each comparison stays within its own series.
The historical series establishes growth across its own window. The separate recent enrollment reports establish the newer annual decline. Both observations can be reported without treating the different totals as interchangeable.
What the latest counts show
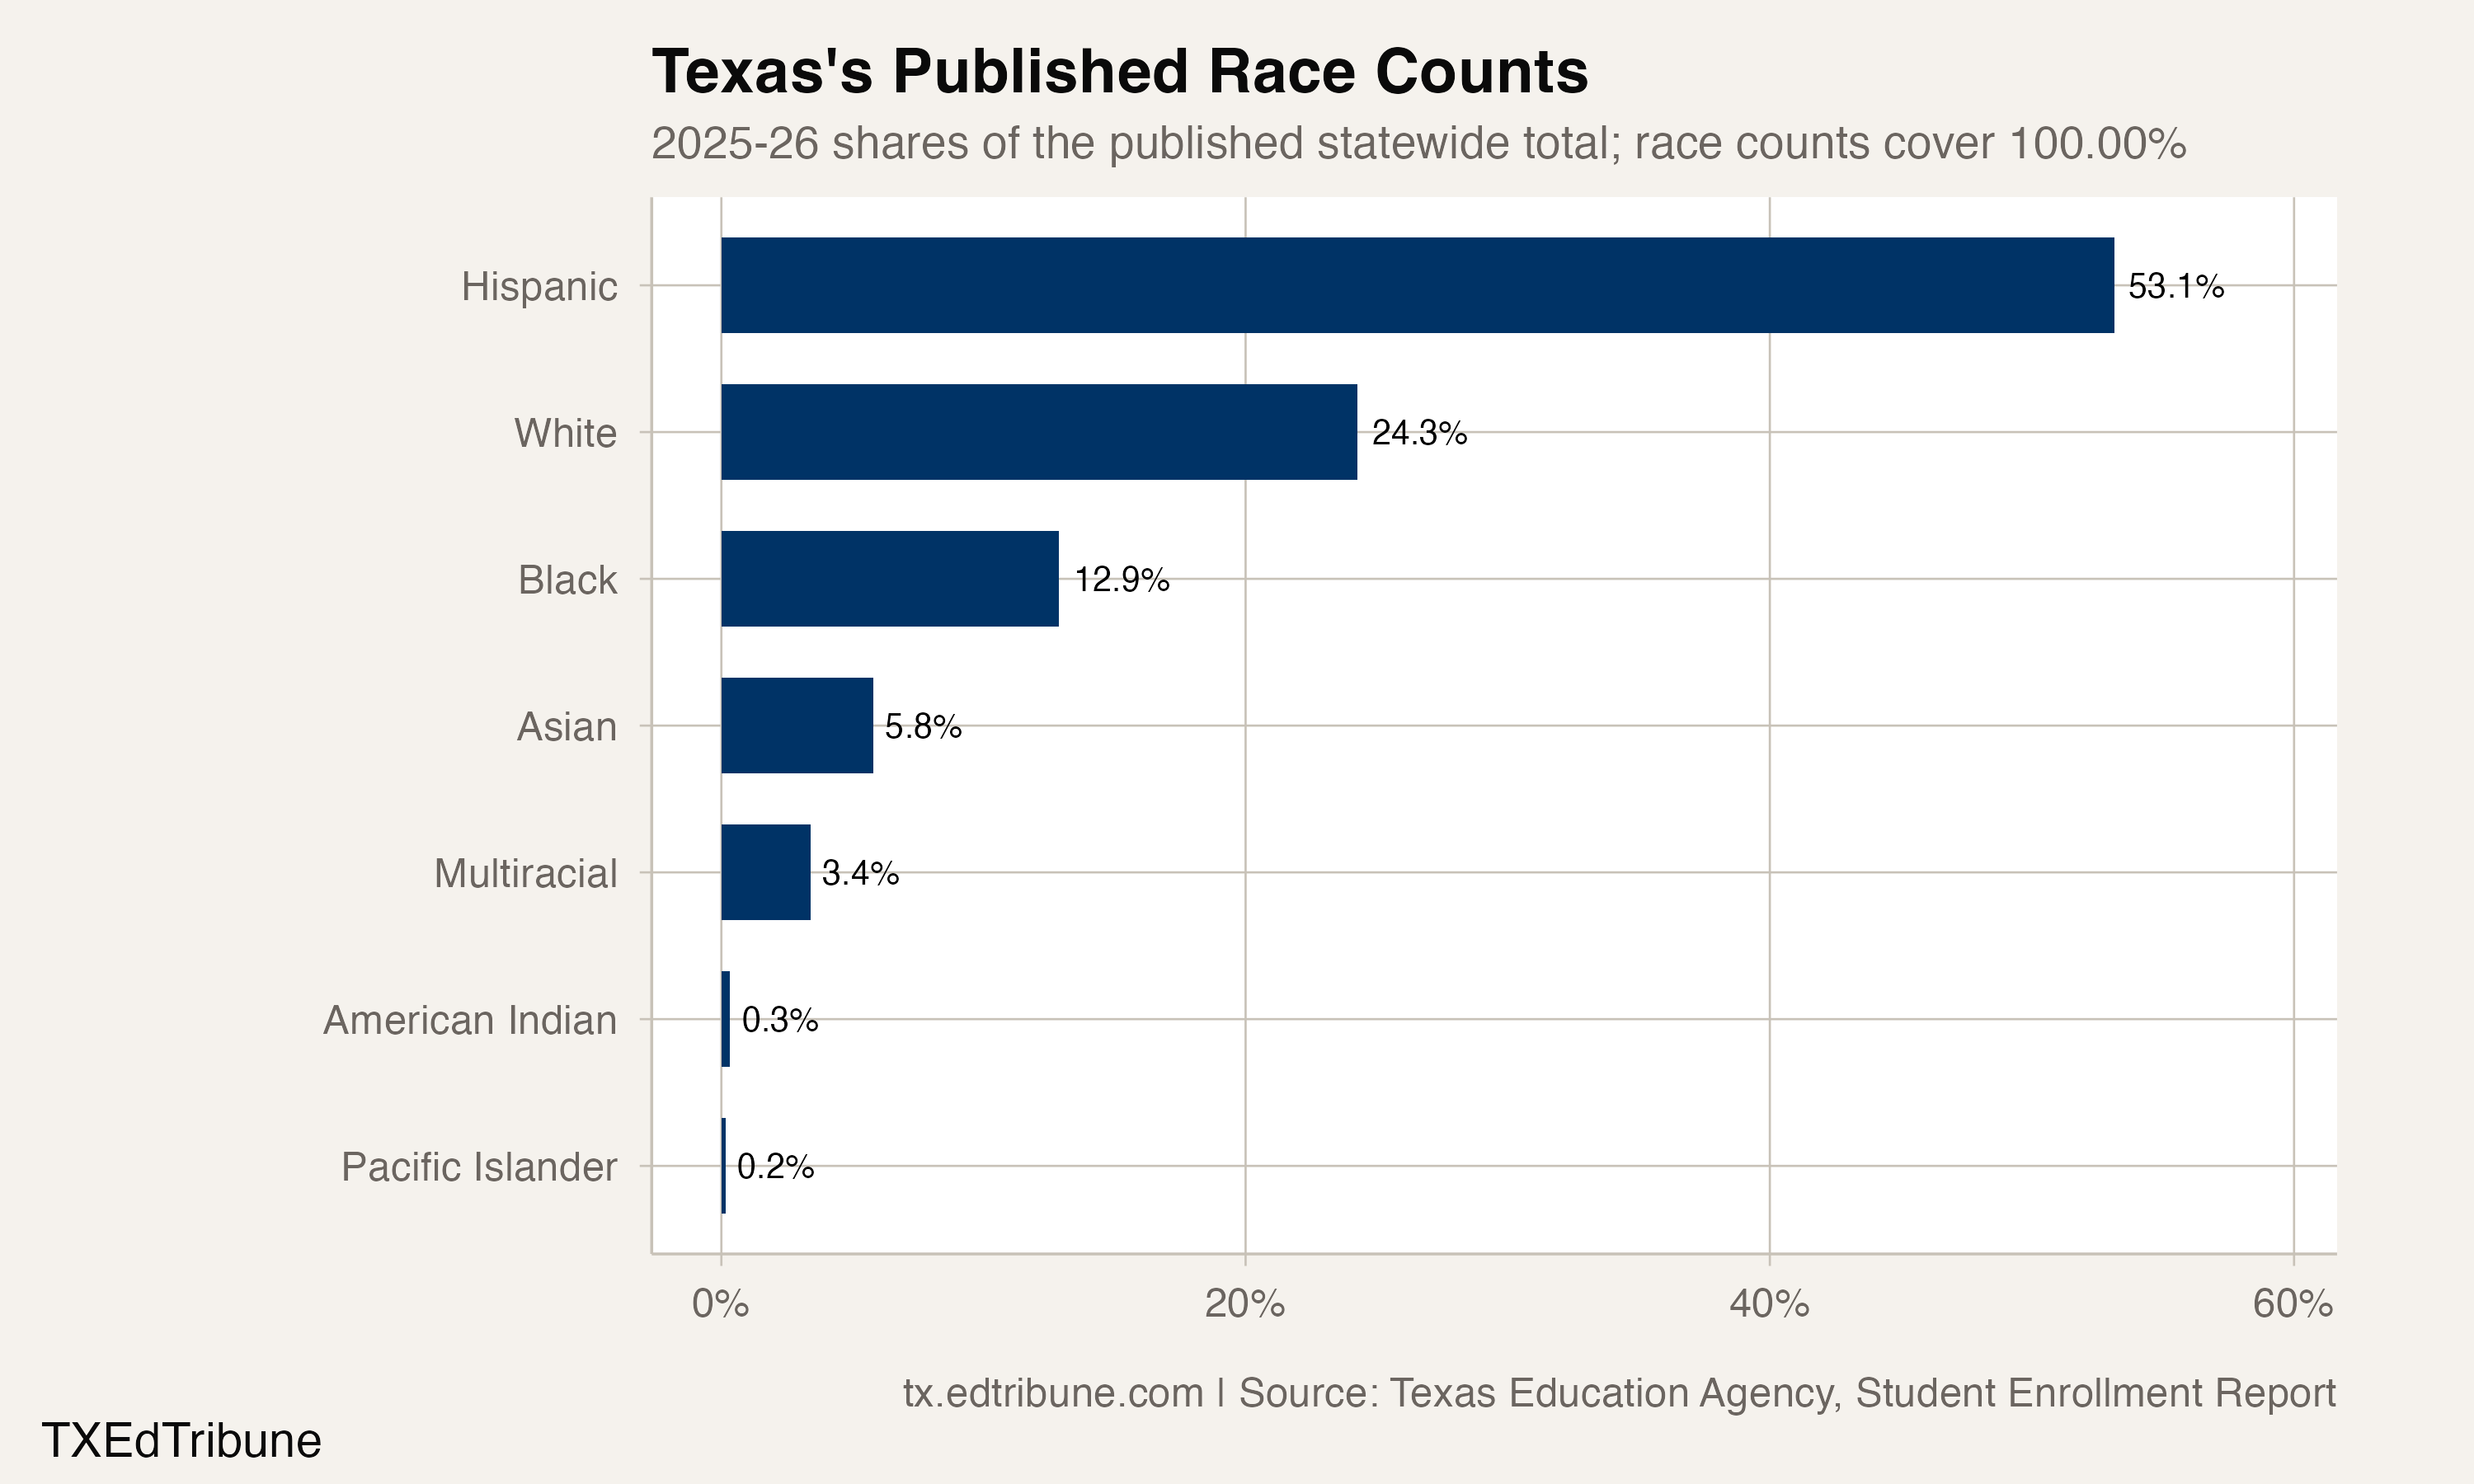
White students numbered 1,326,643 in the 2025-26 enrollment report, or 24.3% of the published state total, below one-quarter. Hispanic students numbered 2,905,406, or 53.1%, a majority of the total.
The published race categories account for all 5,467,642 students in this statewide report. Each share here divides by that published total. That statewide reconciliation does not mean every small district's categories are complete: TEA explains that small values can be masked in these reports.
The current report also supplies 1,200 district total rows. They sum to 5,467,610 students, which is 32 below the published state total. This analysis does not establish the cause of that difference. The state total remains the denominator for statewide rates; a sum of surviving district or category rows is not substituted for it.
Reading the series carefully
This enrollment series examines district scale, changes over time and the students represented in the state's published categories. A statewide decline does not establish that every district declined. A district's lower count does not, by itself, explain its finances, staffing, or academic results.
The historical and recent comparisons remain separate because their overlapping totals differ and their comparability has not been established here. Claims about a first threshold crossing, a historical record, or a district rank require their own complete comparison, rather than borrowing certainty from the statewide headline.
The 2026-27 school year is now underway. These published figures describe last school year and earlier years, rather than a live count of the students in classrooms today.
Sources: Texas Education Agency annual performance reports, including the historical AEIS files, and its separate Student Enrollment Reports. The historical comparison covers 2004-05 through 2024-25; the recent comparison covers 2024-25 and 2025-26.
Detailed code that reproduces the analysis and figures in this article is available exclusively to EdTribune subscribers.
Discussion
Sign in to join the discussion.
Loading comments...