In this series: Texas 2025-26 Enrollment.
Texas districts were reaching opposite ends of their enrollment histories before the newest statewide decline. In the annual performance reports for 2024-25, 224 districts matched their lowest counts in the available historical window, while 218 matched their highest.
Those figures describe a carefully bounded comparison. The most recent historical report contains 1,208 district totals. Of those districts, 1,121 have a positive, finite published enrollment total in every year from 2004-05 through 2024-25. The other 87 are excluded from the record comparison because their available histories do not meet that test. A short history is not treated as evidence of a statewide historical record.
The results also change the picture among the largest districts. Of the fifteen largest districts ranked by their published 2024-25 enrollment, four matched a low within the historical window and three matched a high. These are records within the available annual reports, rather than claims about every year since a district opened.
Highs and lows in the same state
The districts at historical lows accounted for 1,272,681 students, or 23.0% of the published statewide enrollment total. Districts at highs accounted for 1,409,387 students, or 25.5%. The denominator for both shares is the state's published total of 5,530,499 students, rather than a sum of district rows.
That leaves 679 eligible districts between their historical floors and peaks. No eligible district had exactly the same enrollment throughout the entire window. Ties with an earlier high or low count as records; this comparison does not require the latest year to set a new record by itself.
The state total was still rising in 2024-25, when the native historical series added 13,035 students. Its largest recent interruption came in 2020-21, when enrollment fell 120,133. A statewide gain does not imply that every district grew, just as a statewide loss does not imply that every district declined.
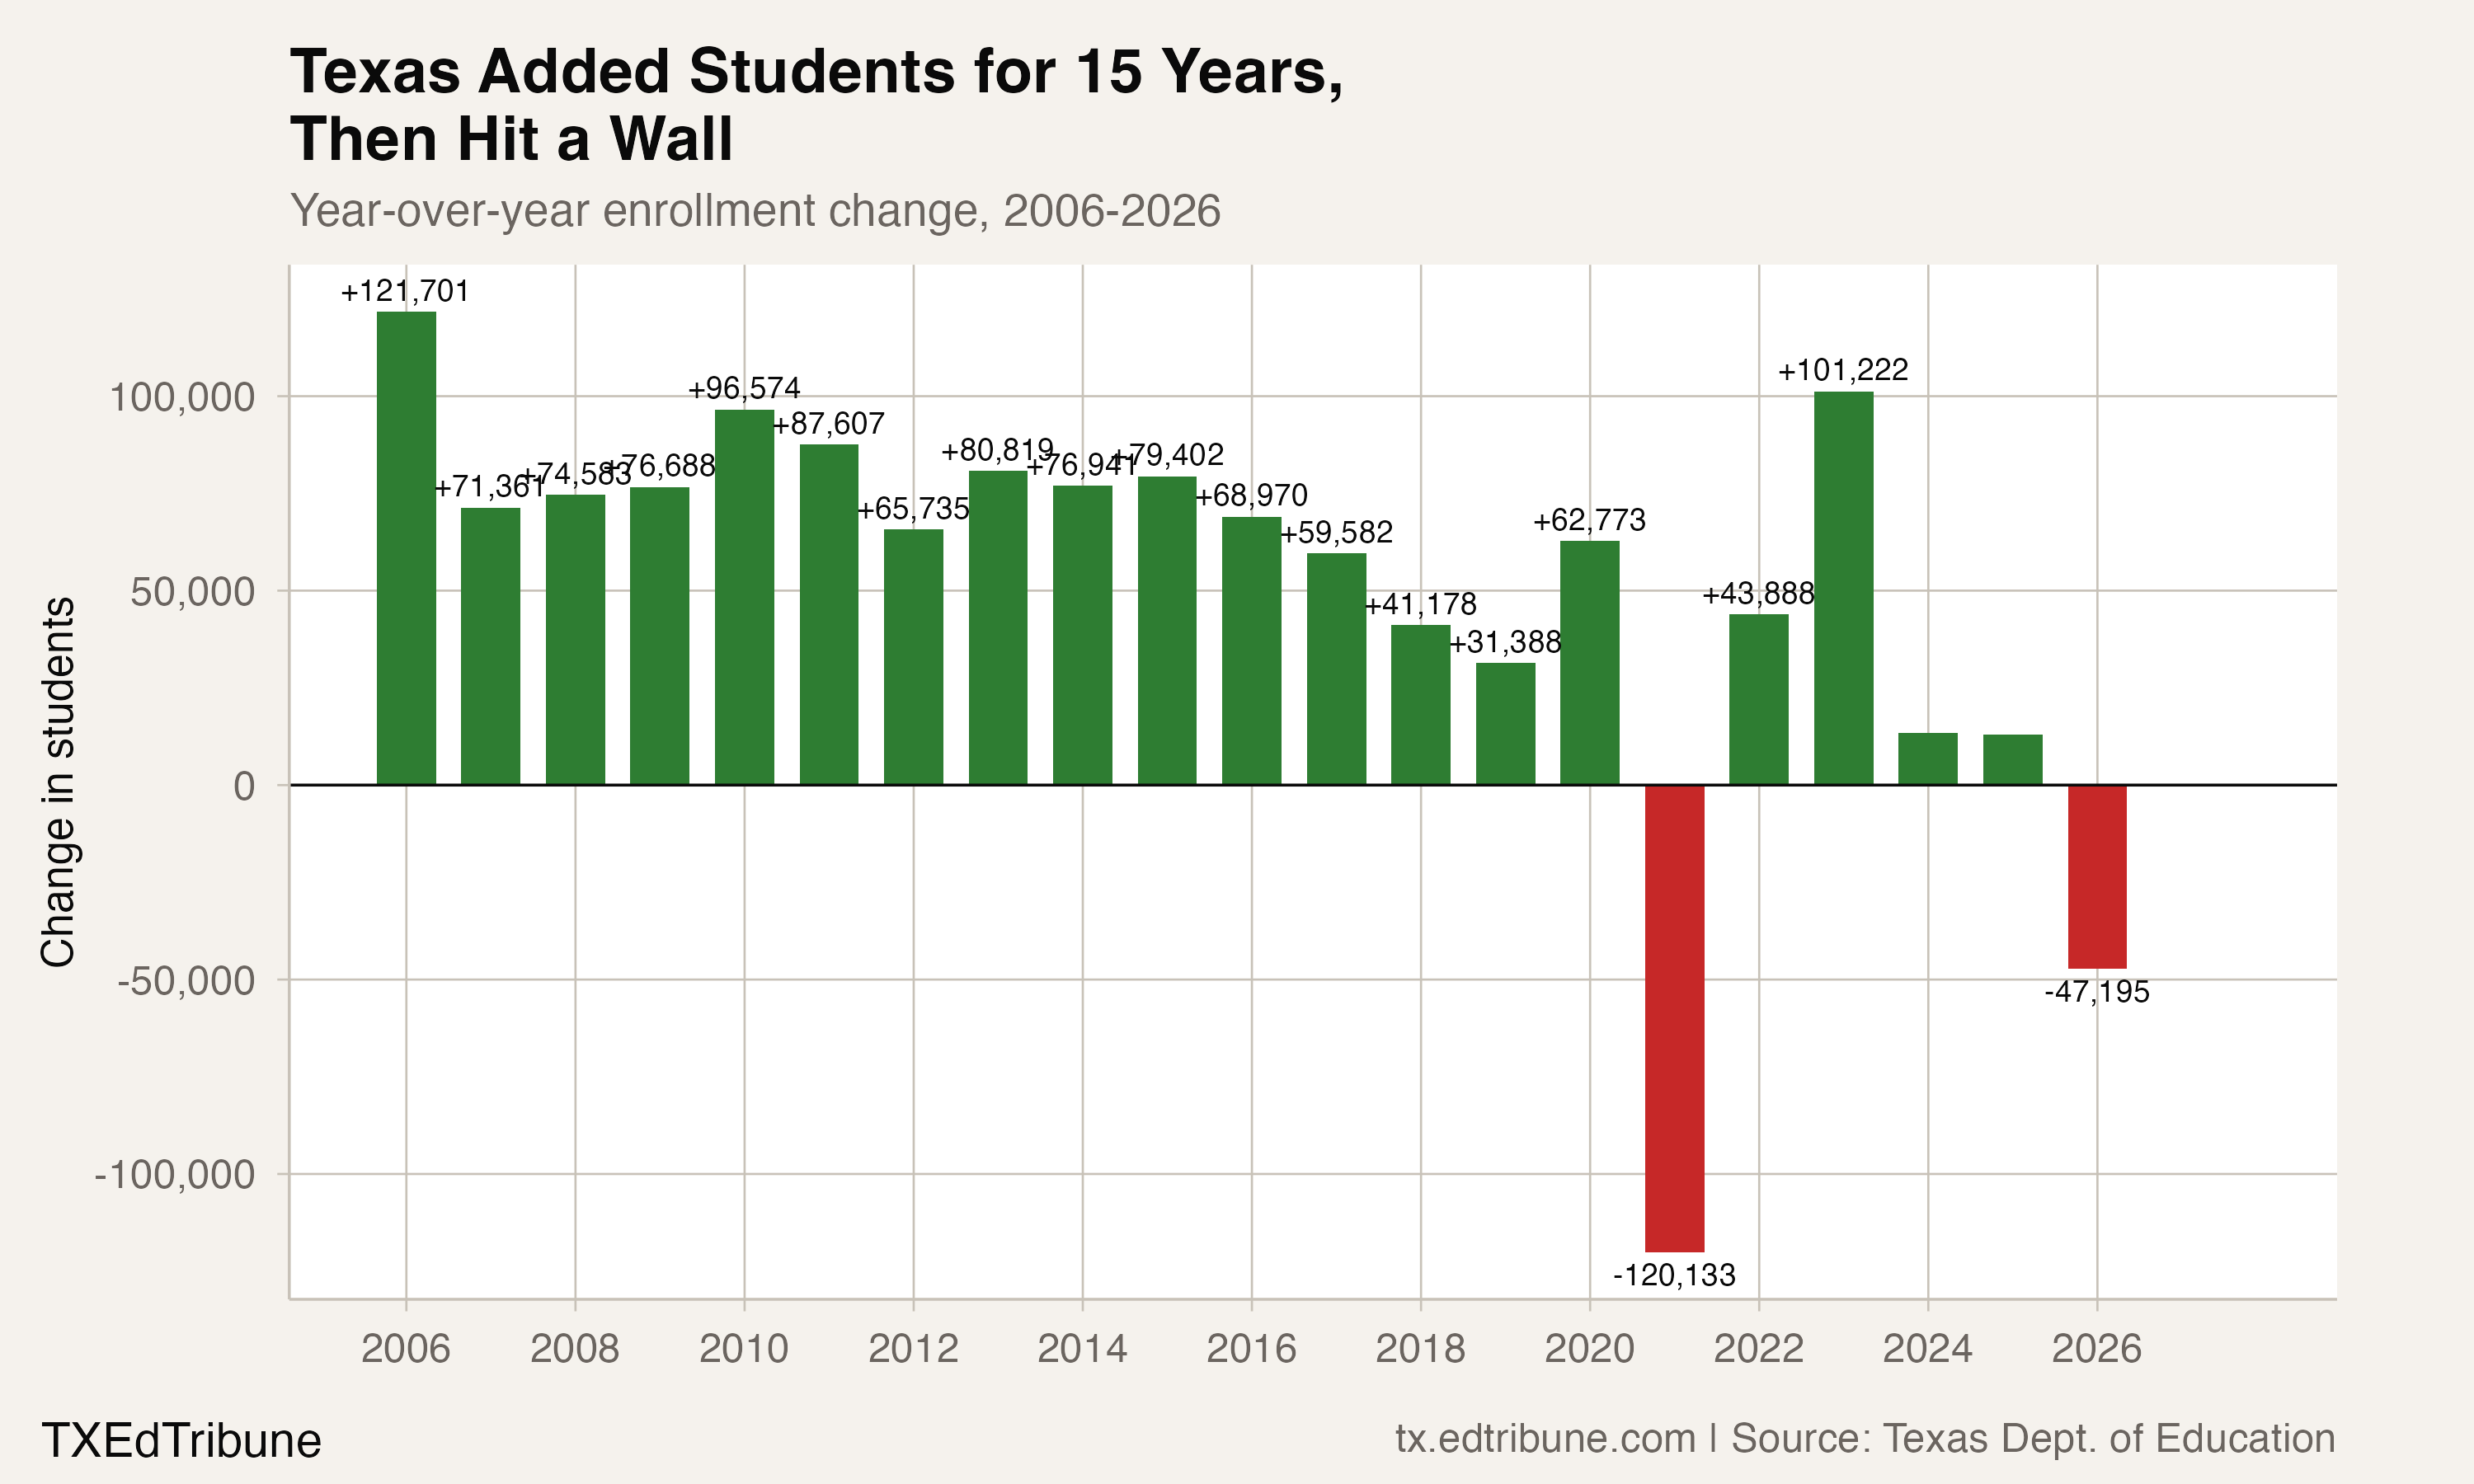
The newer Student Enrollment Reports provide a separate comparison. Last school year's 2025-26 statewide total was 5,467,642, a decline of 76,613 students, or 1.4%, from the previous year in that same report series. That pair is kept separate from the historical performance-report records. Its overlapping-year totals are not identical, so the newer endpoint is not appended to the historical rankings.
Size matters, but does not settle the result
Among the complete-history districts with at least fifty thousand students in 2024-25, 31.2% matched a historical low and 18.8% matched a high. The largest size group contains 16 eligible districts. The earlier claim that nearly half of the largest districts were at lows does not survive this comparison.
The pattern differs in the group with between five thousand and ten thousand students. Among 79 eligible districts in that range, 45.6% matched a high and 8.9% matched a low. At the smaller end, the group with fewer than five hundred students contained 359 eligible districts; 7.8% matched a high and 20.6% matched a low.
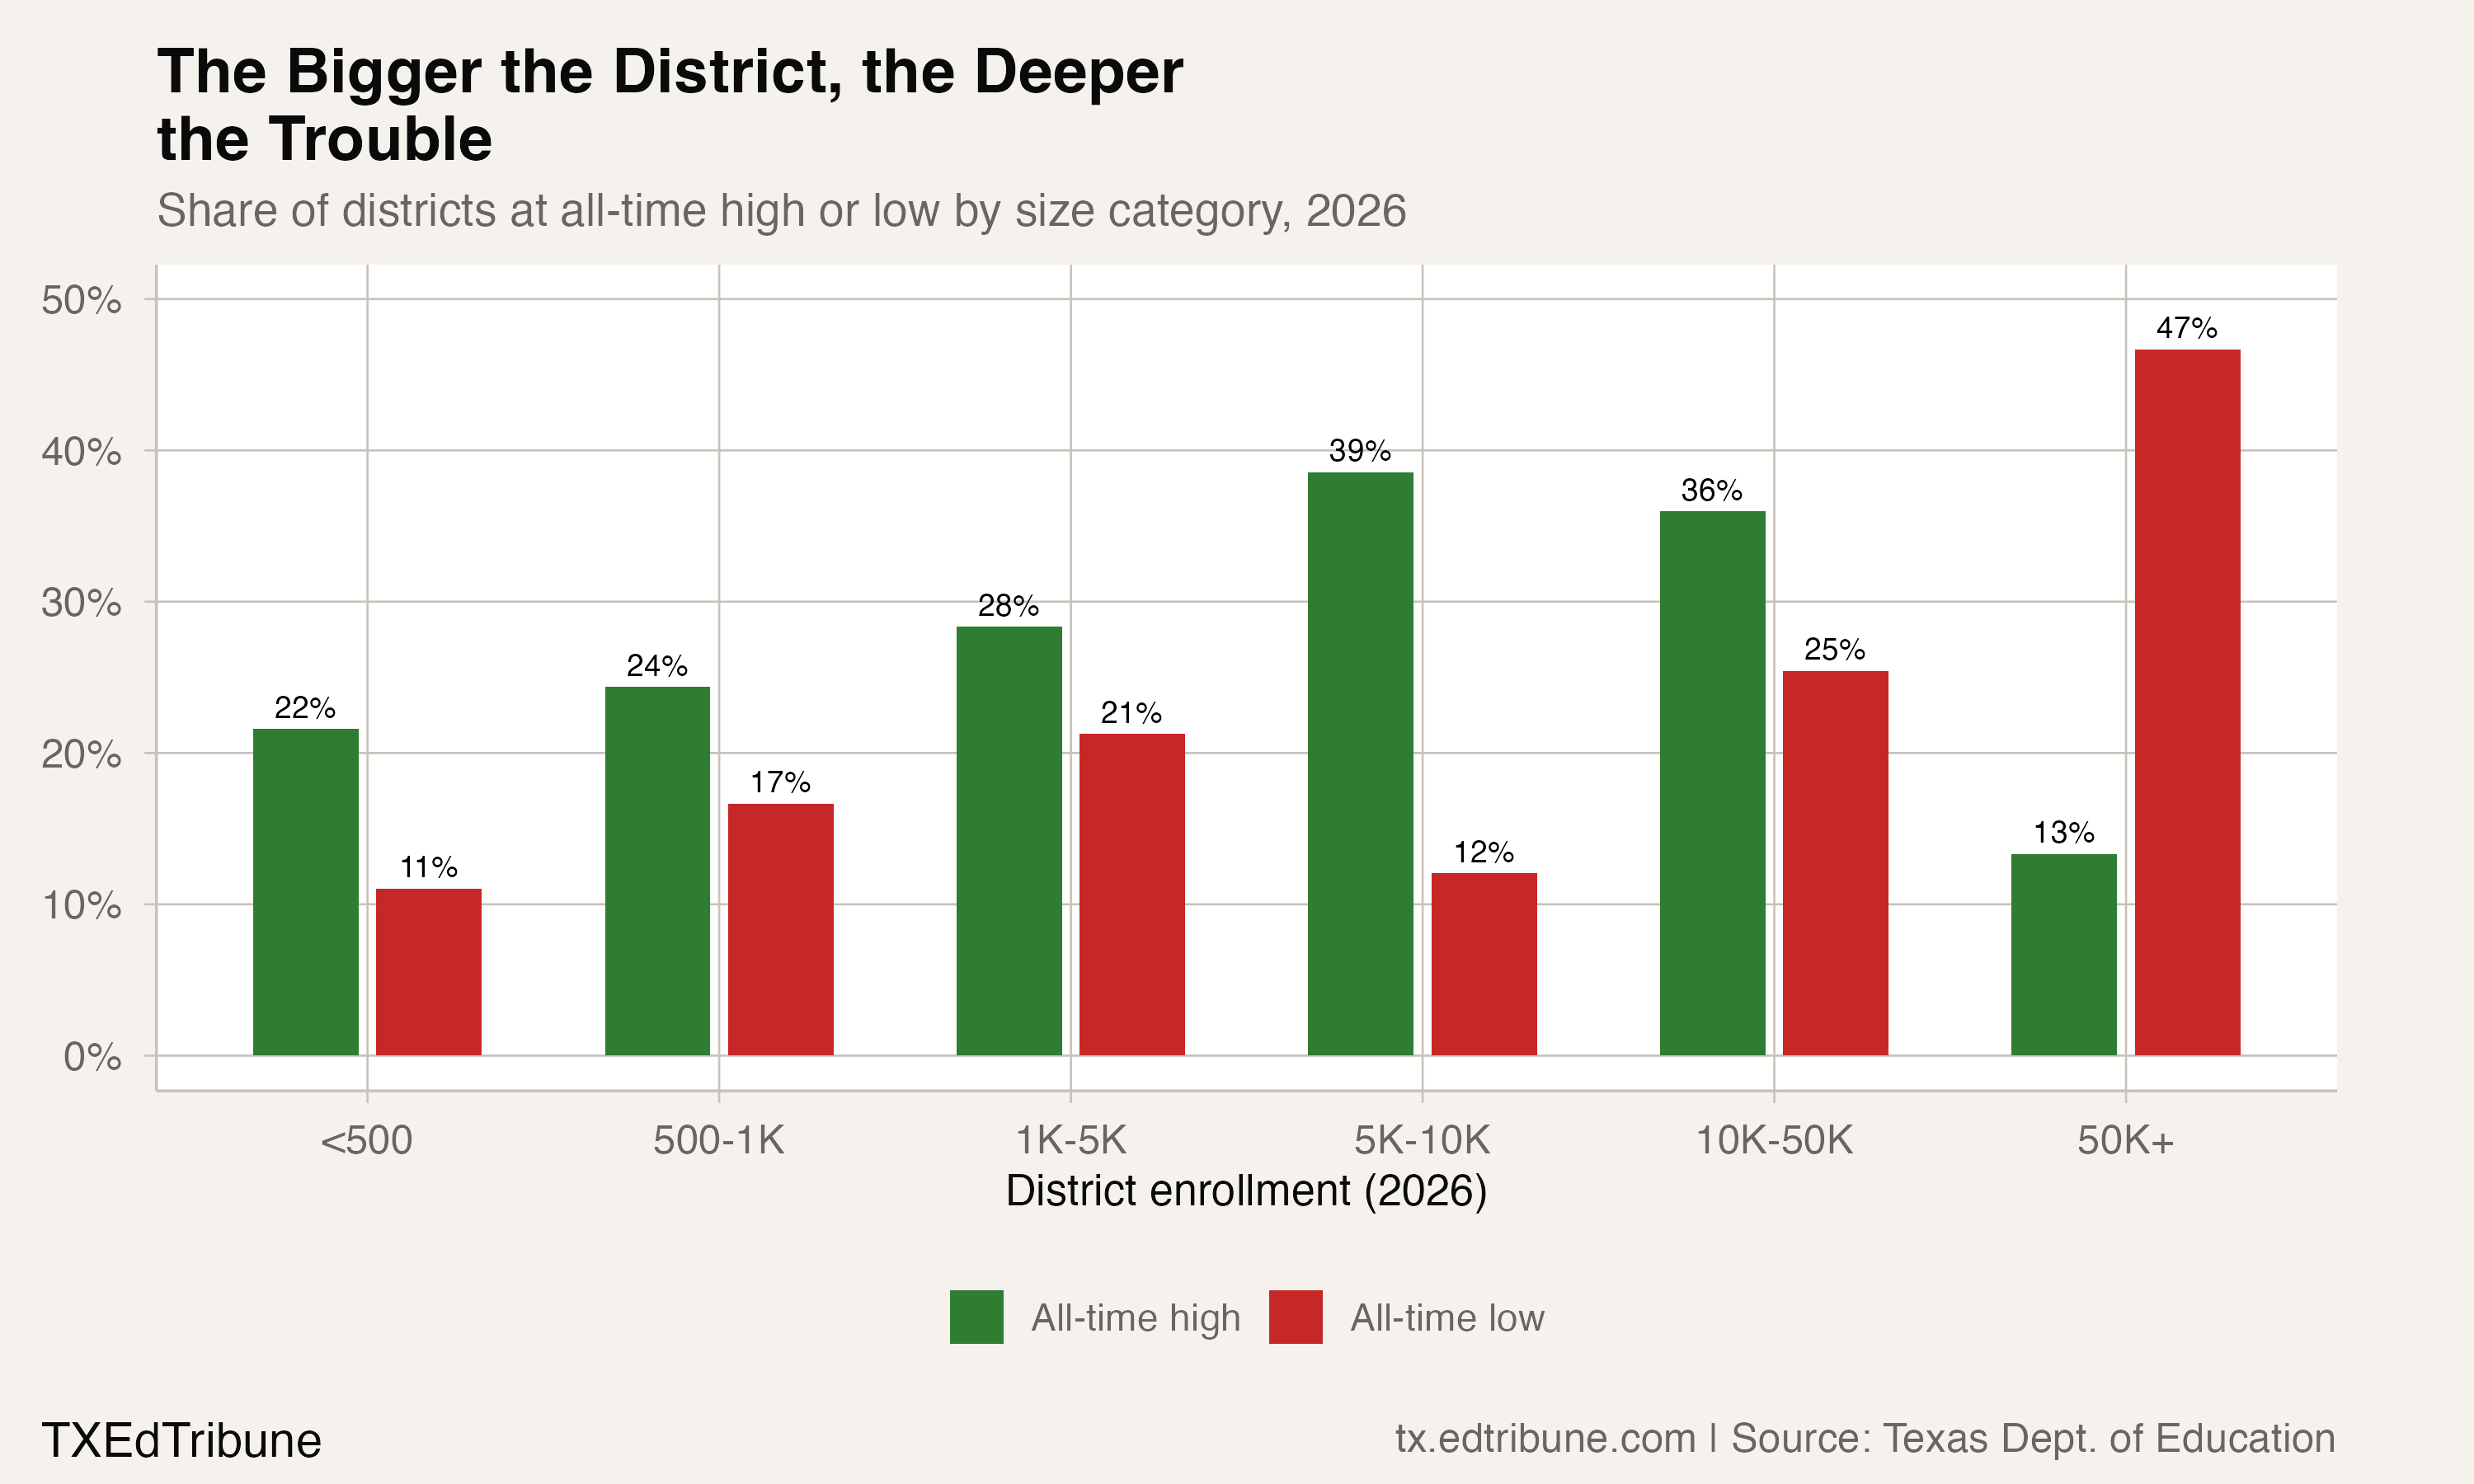
Size categories use each district's published enrollment in the latest historical year. The chart describes the distribution of observed records within each eligible group. It does not show that size caused a gain or a loss, or that every large district faces the same trajectory.
The selected city districts are below their combined peak
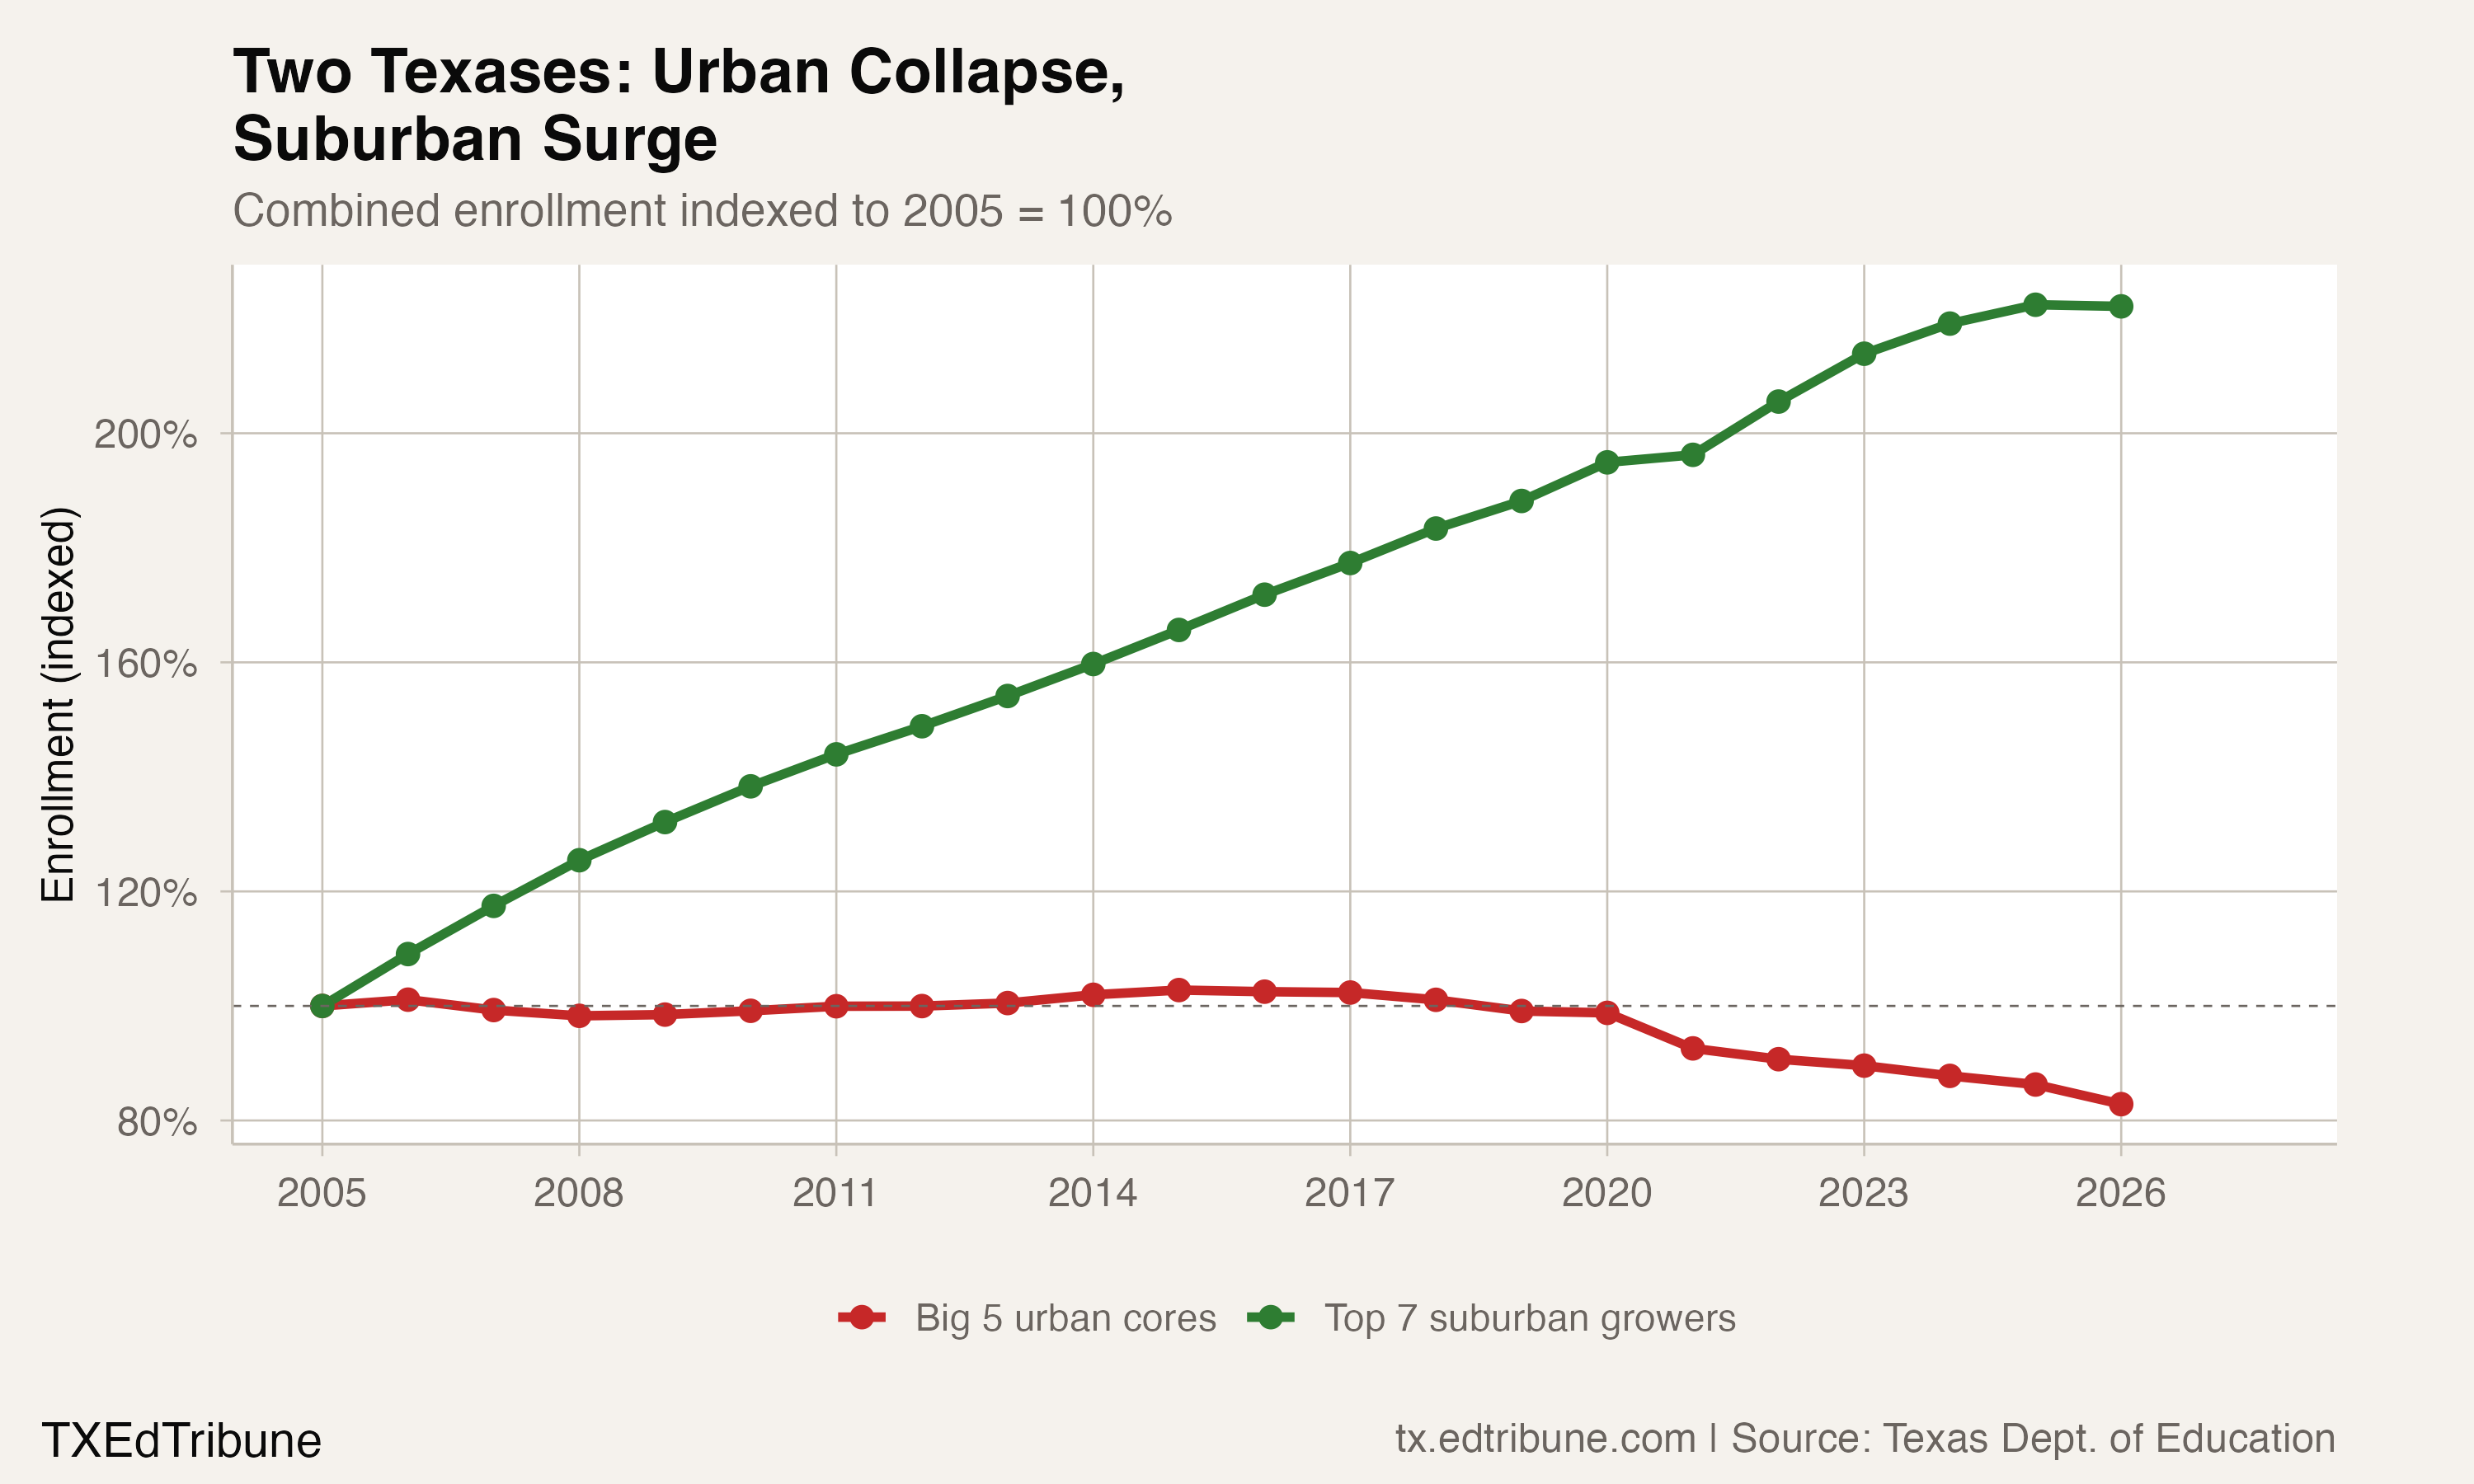
Houston ISD↗ET, Dallas ISD↗ET, Fort Worth ISD↗ET, Austin ISD↗ET and San Antonio ISD↗ET together enrolled 502,185 students in 2024-25. Their combined high within the window was 598,197 in 2014-15.
Houston's historical total was 176,039, 18.3% below its own peak. Fort Worth was 19.5% below its peak, and San Antonio was 22.2% below its high. Each matched its lowest total within the complete historical window. Dallas and Austin were below their respective peaks, but neither was at its historical minimum in the latest native year. Being below a peak and being at a record low are different claims.
The combined series begins with 582,060 students in 2004-05. By 2024-25 it was at 86.3% of that starting count. This comparison follows the same districts throughout the window, rather than replacing the membership with whichever districts happen to be largest in a particular year.
A fixed outer group moved in the other direction
A separately selected group—Katy, Frisco, Cypress-Fairbanks, Conroe, Prosper, Lamar CISD and Northwest—begins with 207,380 students and ends with 461,304. Its latest total was 222.4% of its starting enrollment.
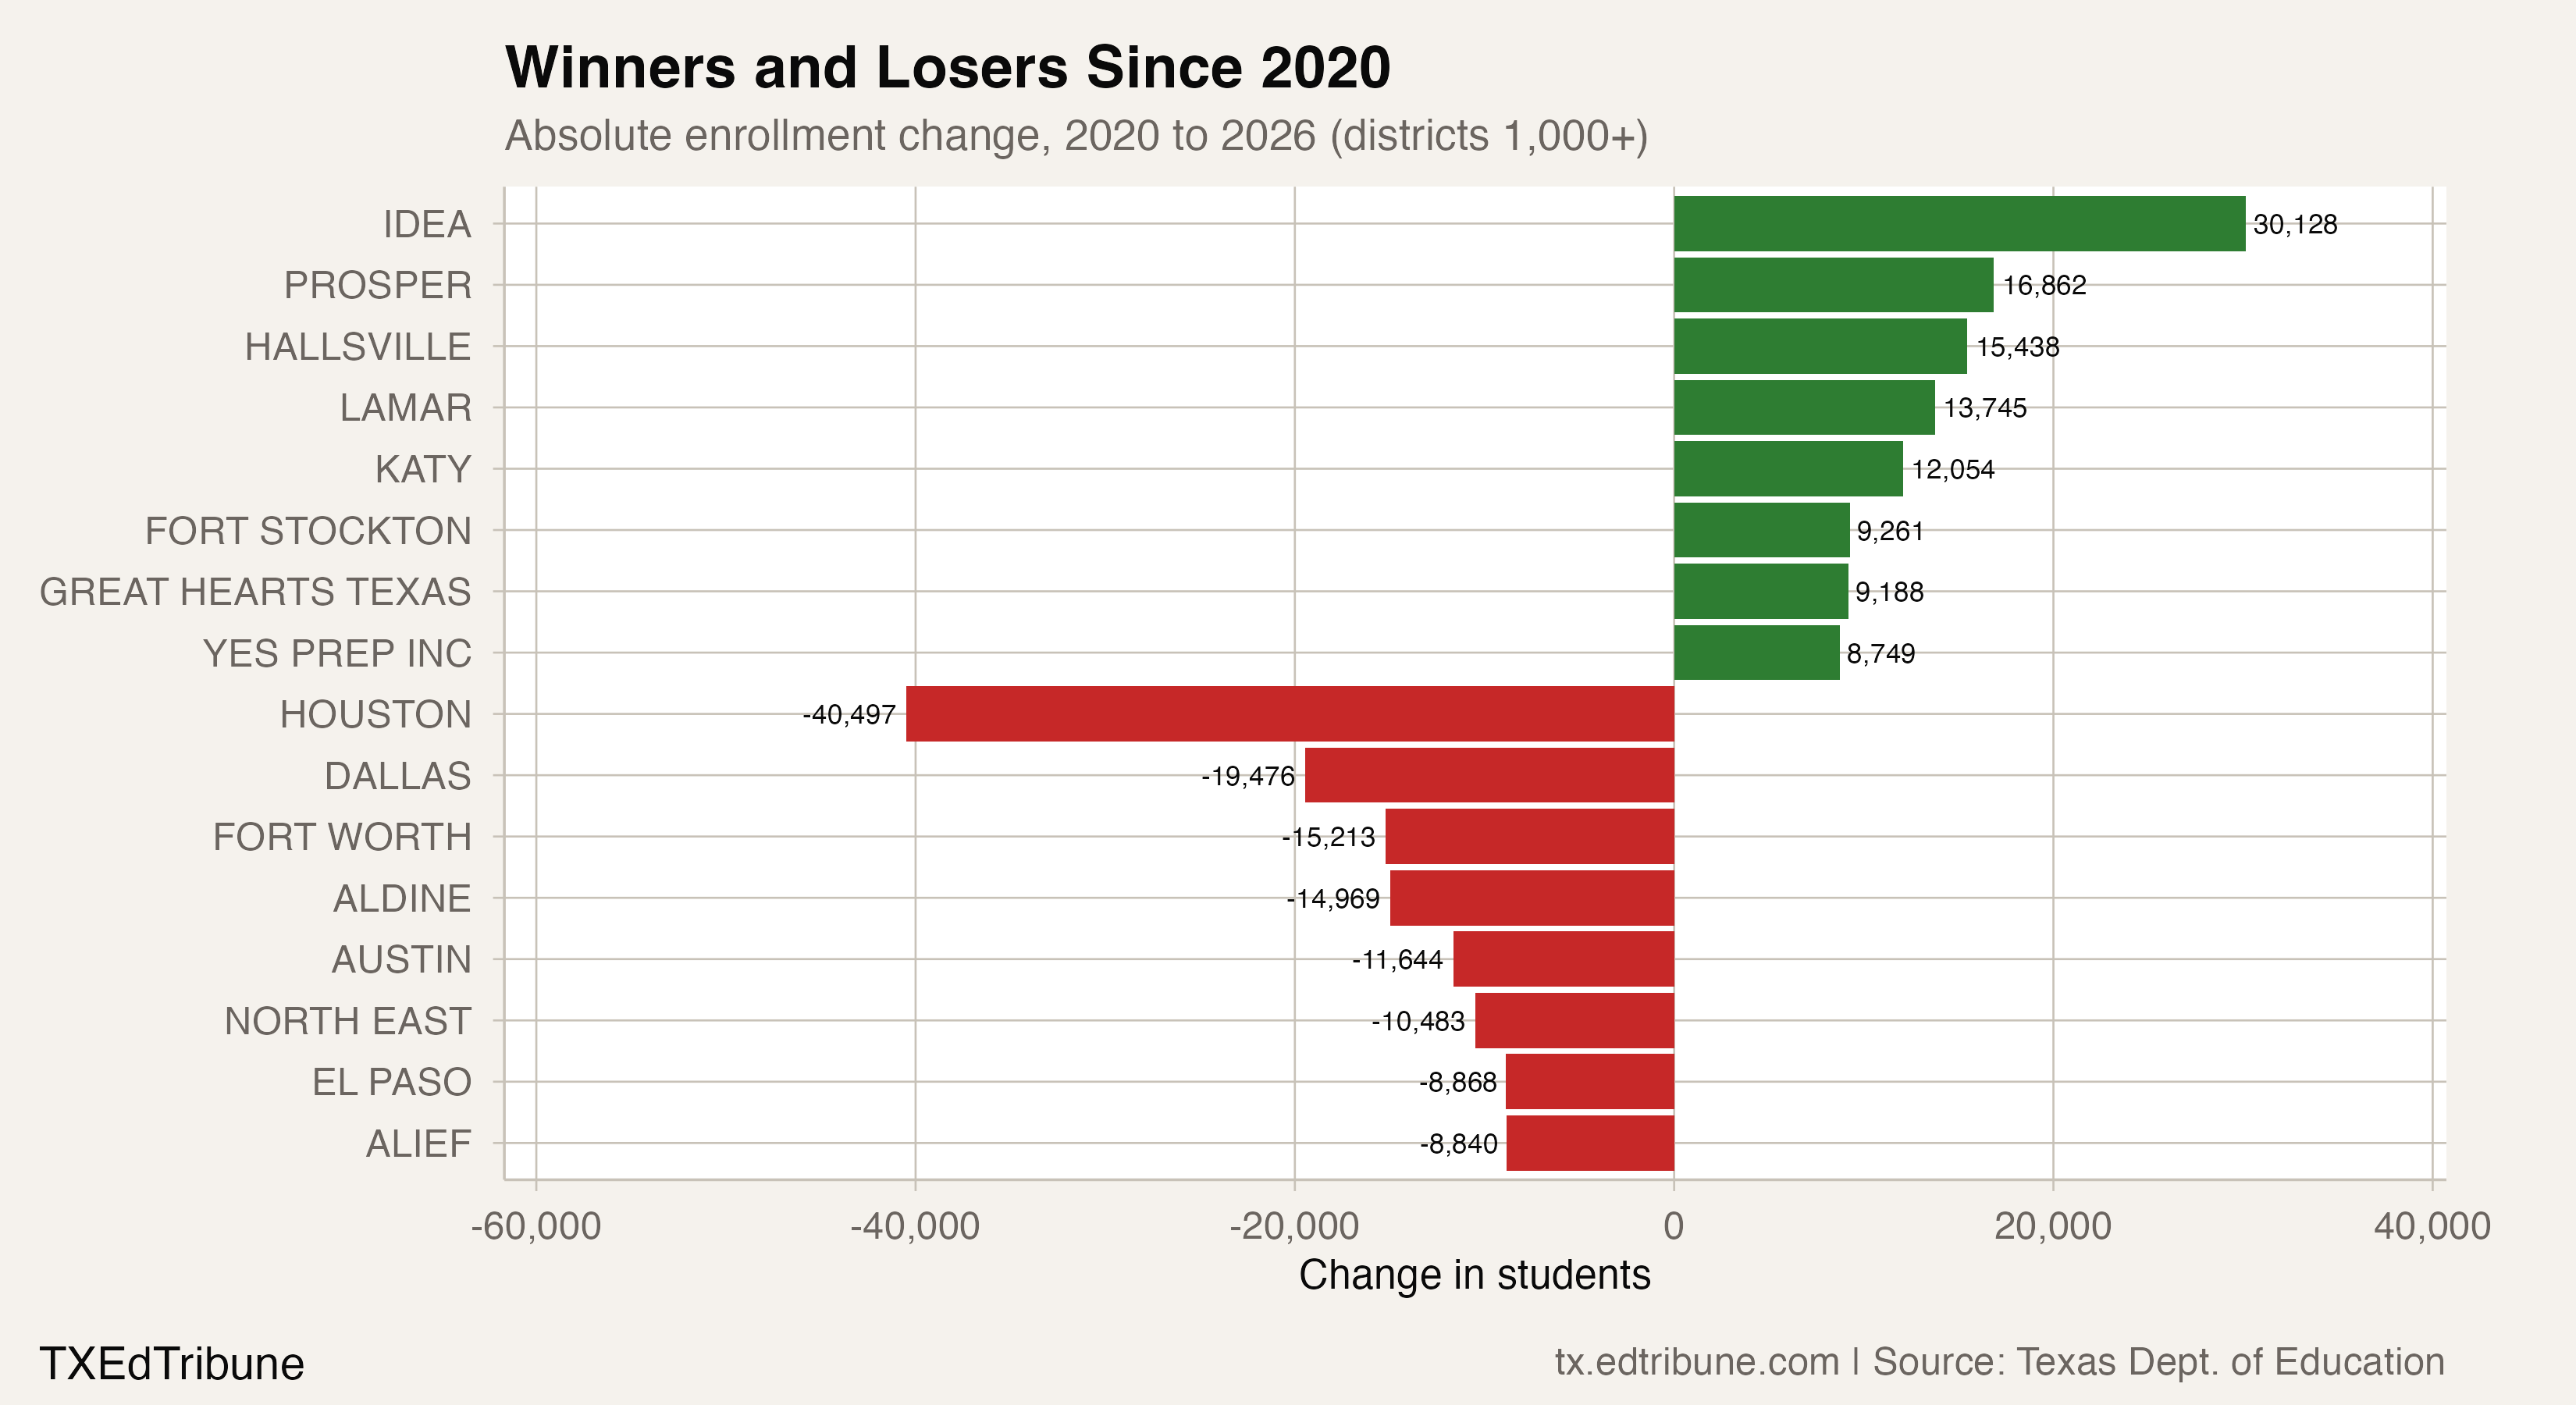
Prosper's native historical totals rose from 1,599 to 31,577. Katy went from 44,212 to 95,919, and Conroe from 40,257 to 72,327. IDEA Public Schools also grew sharply over the same window, from 659 to 79,430; it is a separate district-equivalent and is not included in either of the two selected geographic groups.
Even within the outer group, an upward long-run trajectory does not guarantee that the latest year is a high. Frisco's 2024-25 total was 65,151, compared with a historical peak of 66,780 in 2022-23. The group can reach a combined high while one member remains below its own peak.
The selected groups illustrate divergent enrollment histories. They are not exhaustive definitions of Texas urban and suburban regions, and the reports do not trace household moves between them. Growth in one group cannot be assigned as the destination of students lost by the other.
The time window and comparison group matter
The chart of the largest gains and losses compares matched district totals between 2019-20 and 2024-25. It includes 572 districts with at least a thousand students at the baseline, a valid positive endpoint and an identified current district. The ranking is limited to that eligible group.
A separate record-count chart follows the fixed complete-history cohort. At each year, a district is counted at a high or low if its total matches the corresponding extreme observed since the beginning of the window. The first year, when every district necessarily starts at both its initial high and low, is omitted from that chart.
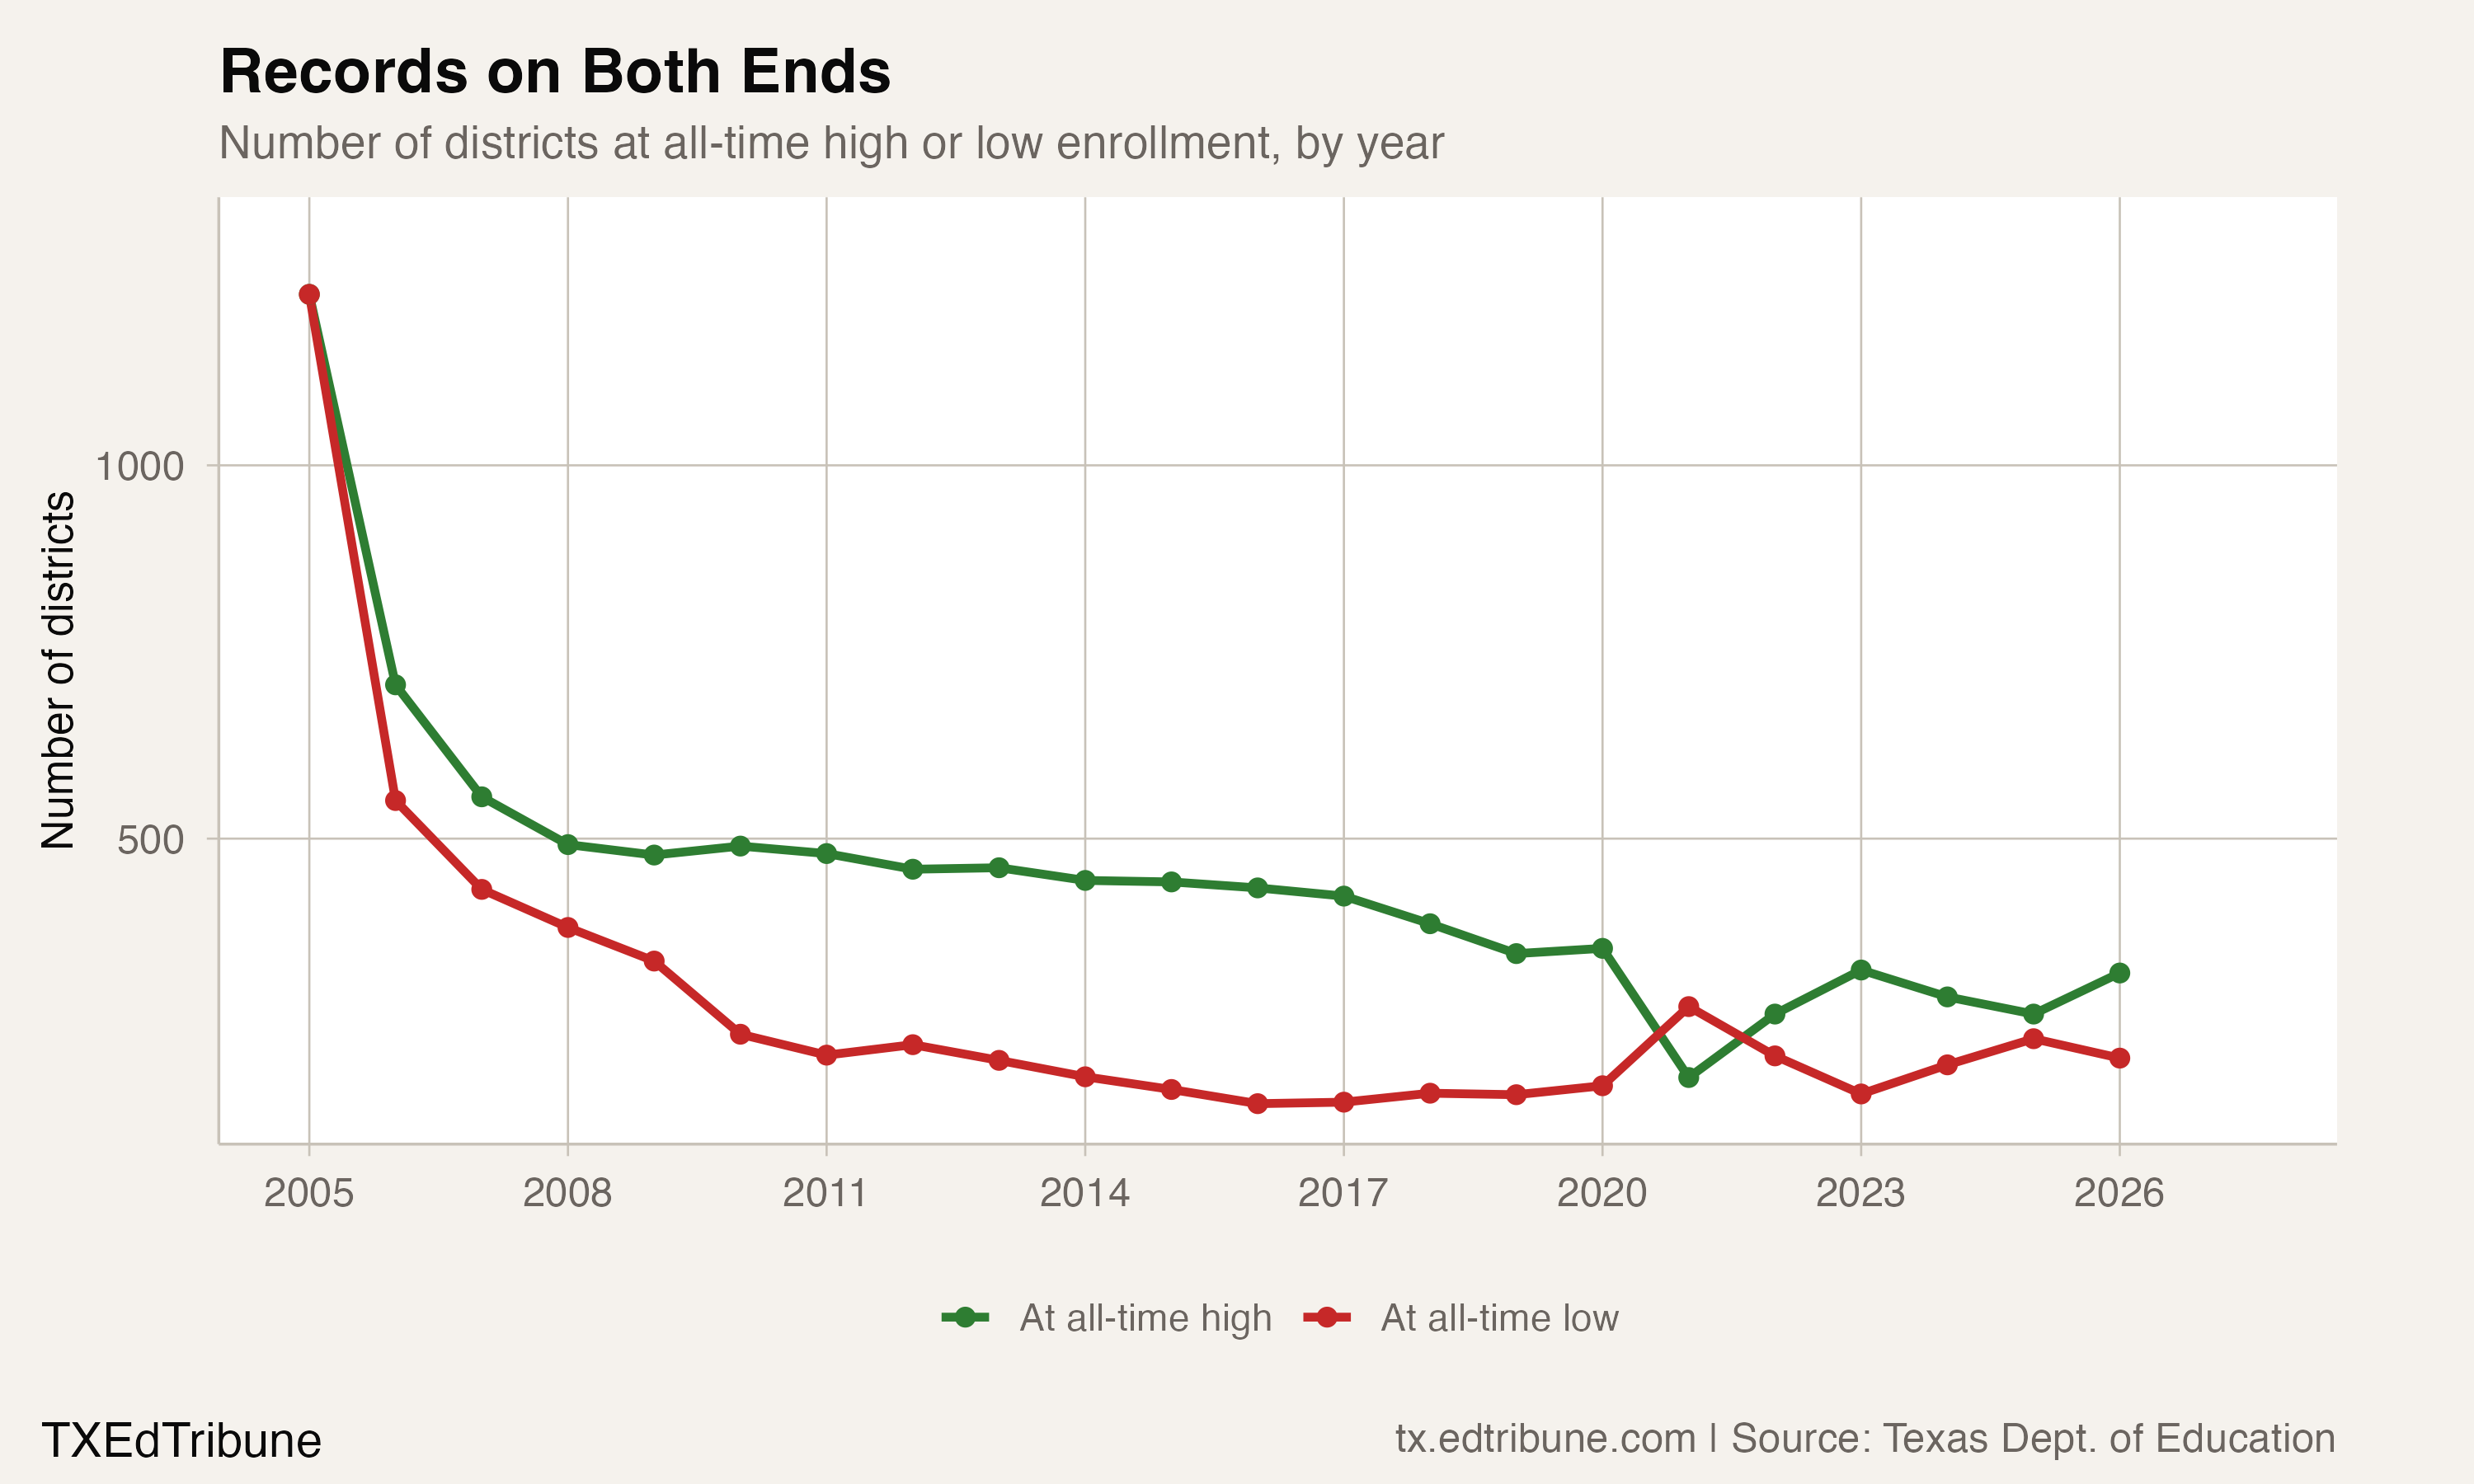
The evidence supports a narrower conclusion than a uniform statewide growth or collapse story: districts can reach opposite ends of their observed histories in the same year. Explaining those paths requires evidence beyond enrollment totals. These reports do not establish how much comes from births, housing, movement between districts or school choices, and they do not forecast whether a district's past trajectory will continue.
Source: Texas Education Agency annual performance reports and Student Enrollment Reports.
Detailed code that reproduces the analysis and figures in this article is available exclusively to EdTribune subscribers.
Discussion
Sign in to join the discussion.
Loading comments...