In this series: Texas 2025-26 Enrollment.
Correction: An earlier draft treated a linear trend as an expected enrollment path and attached causal explanations the enrollment data could not establish. This revision reports observed Texas Education Agency enrollment patterns only.
Texas public-school enrollment fell by 47,195 students in 2026, from 5,530,499 to 5,483,304. That was a 0.9% decline.
The district map moved in the other direction. Among 1,183 district IDs with records in 2020, 2025 and 2026, 658 grew in the latest year, 516 declined and nine were unchanged. The growing districts were 55.6% of that stable universe.
The statewide loss and district count can coexist because systems differ greatly in size. Houston ISD↗ET lost 7,227 students from 2025 to 2026, Dallas ISD↗ET lost 5,468, and Aldine ISD↗ET lost 4,178. Austin ISD↗ET and Fort Worth ISD↗ET lost 3,101 and 2,693, respectively.
The statewide line turned down
Texas reported statewide enrollment gains from 2005 through 2020, followed by a decline in 2021. Enrollment rose again through 2025 before the 2026 loss. Across the full 2005-2026 panel, 2021 and 2026 were the only reporting years with a statewide decline.
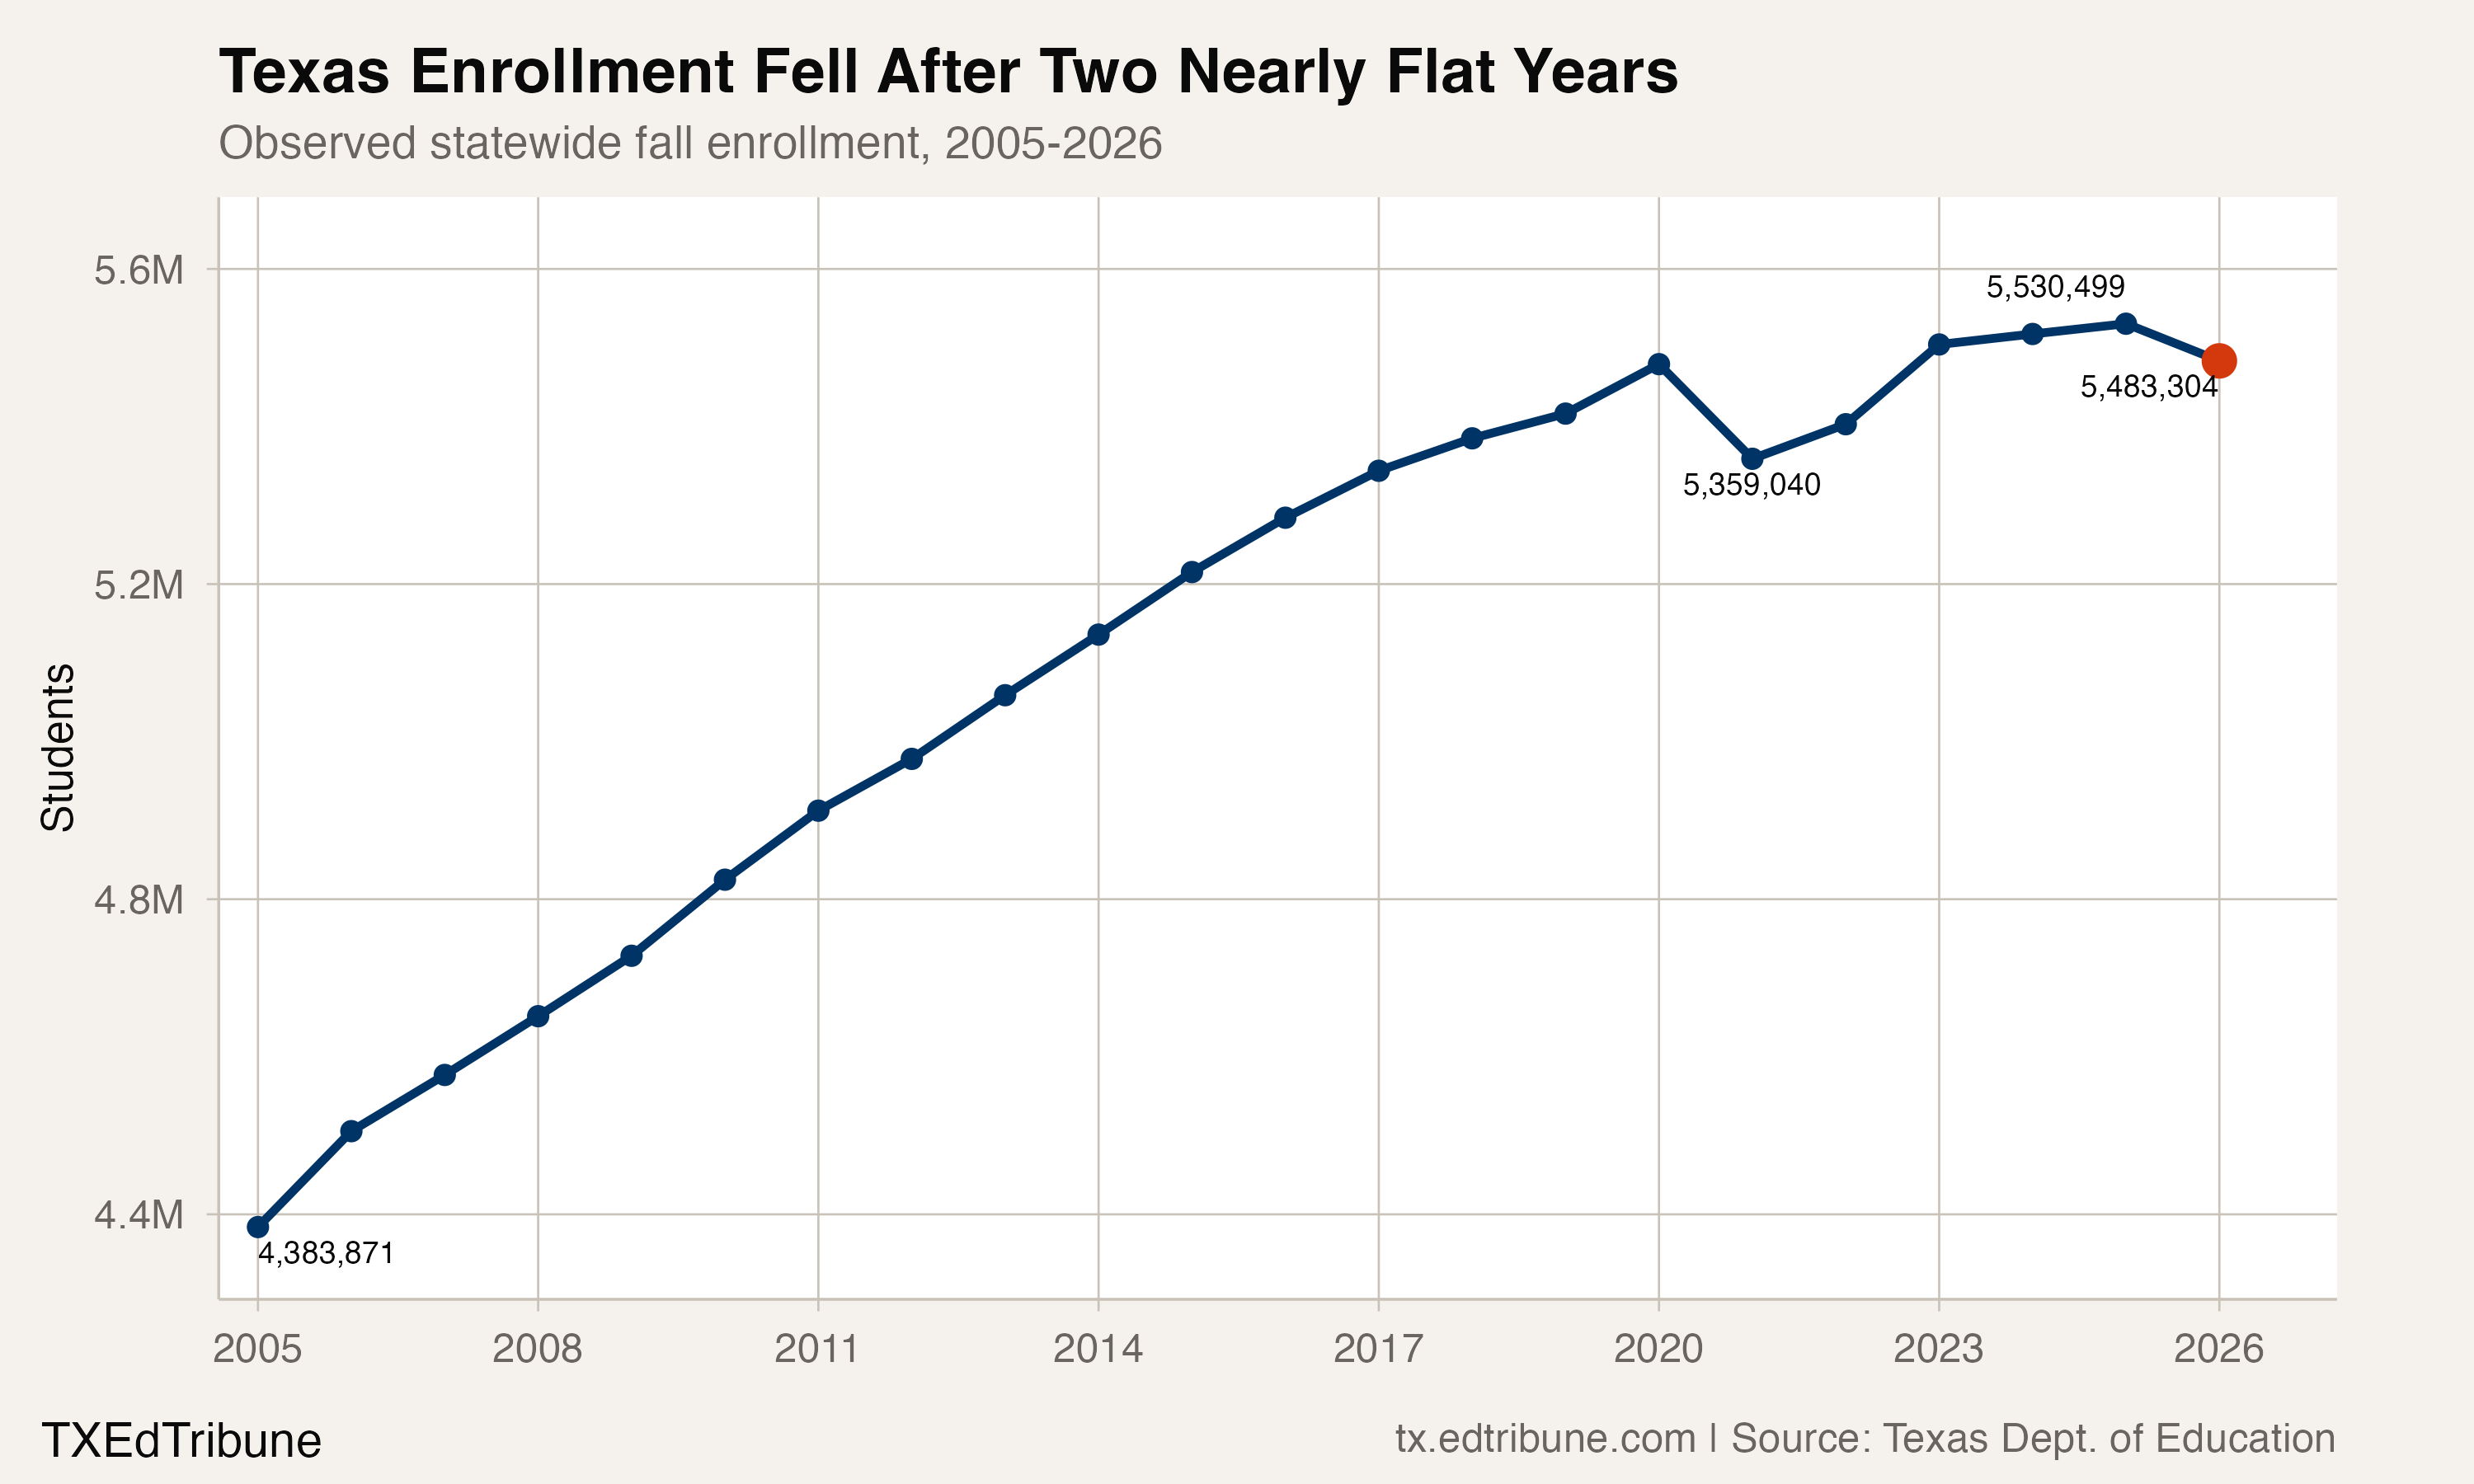
The latest total remained 4,131 students above the 2020 level. That comparison describes the observed endpoints. It does not identify how many students Texas would have enrolled under a different path.
Larger systems carried the net loss
The stable district universe covered 99.9% of statewide enrollment in 2026 and accounted for 47,140 of the 47,195-student decline. It also avoids treating openings, closures or renamed systems as changes in existing districts: all comparisons use district IDs, and 95 of those IDs used more than one name somewhere in the full panel.
Among the 126 stable districts that enrolled at least 10,000 students in 2025, 83 declined. Those systems represented 70.0% of stable-universe enrollment and lost 66,678 students combined. Stable districts below the 10,000-student cutoff gained 19,538 students combined.
The 10,000-student boundary is an editorial comparison, not an official Texas category. The pattern persists at a 5,000-student cutoff: 130 of 211 stable districts at or above that size declined, and that group covered 81.0% of stable-universe enrollment.
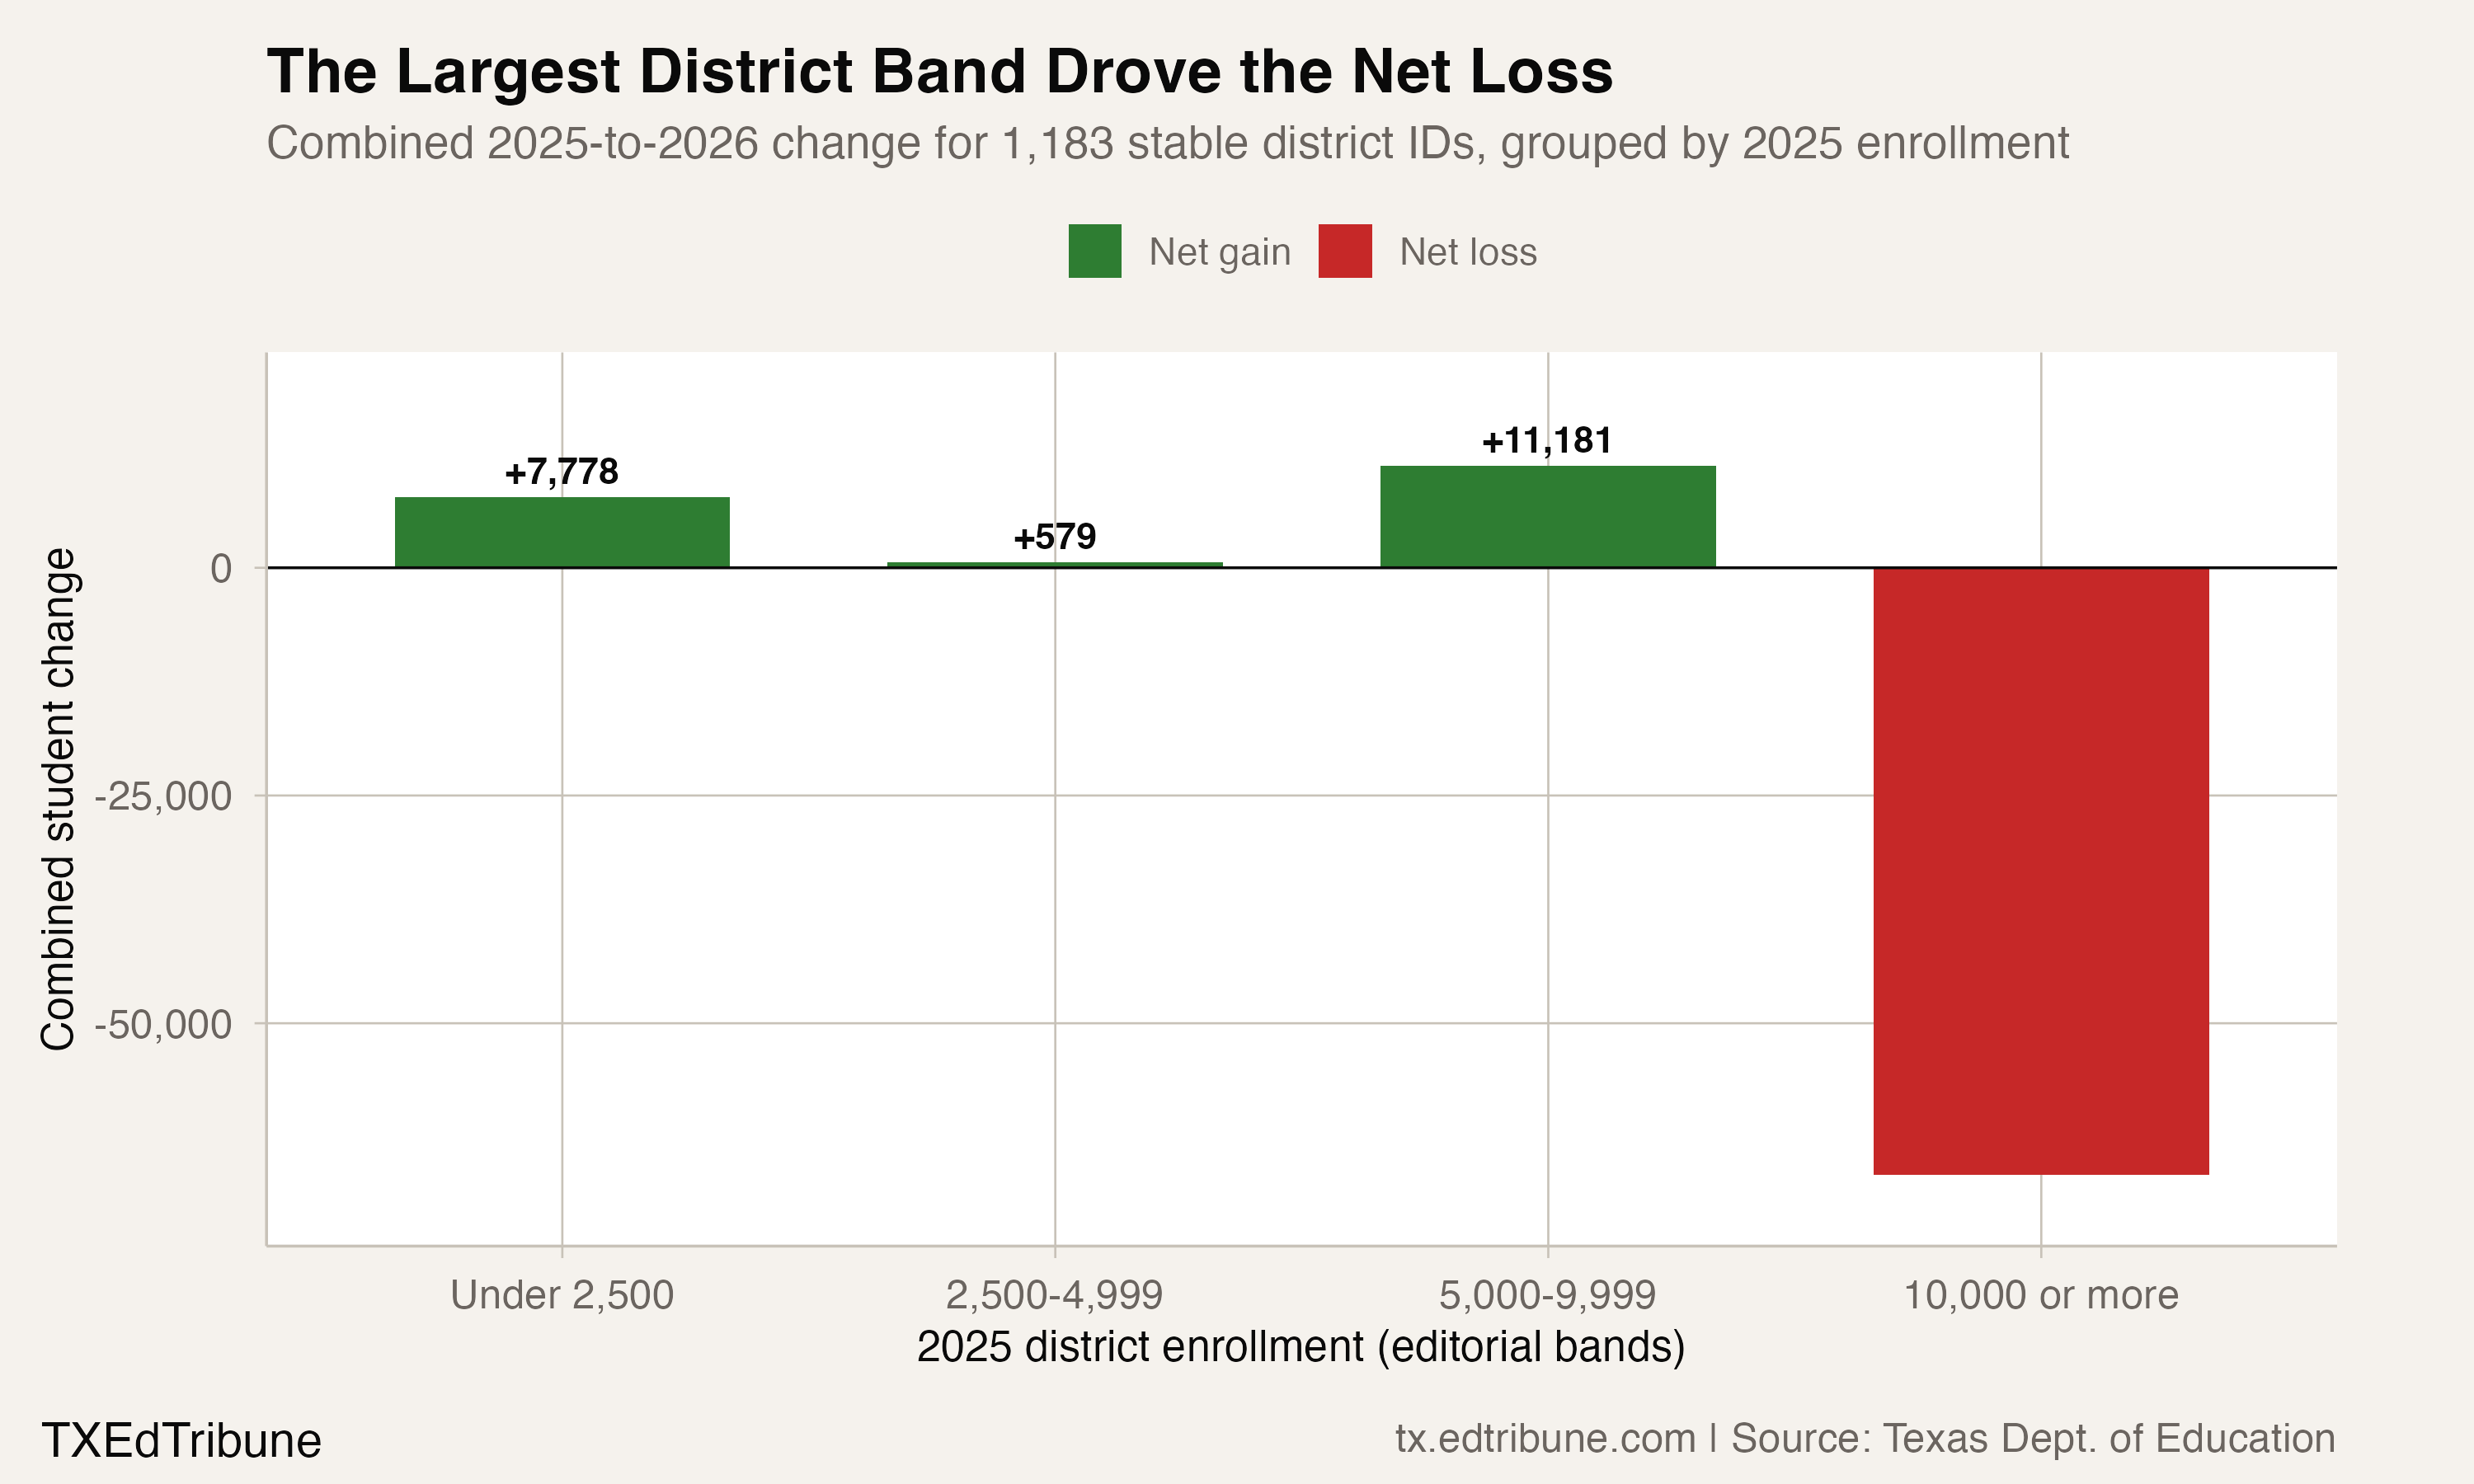
The chart groups districts by their 2025 enrollment, so a district's later change cannot move it into a different comparison band.
Grade rows split too
Nine of Texas' 15 reported grade rows lost enrollment from 2025 to 2026, while six gained. Grade 3 had the largest numerical decline, down 17,478 students. Kindergarten fell by 8,471. Grade 12 moved in the opposite direction, adding 8,404 students.
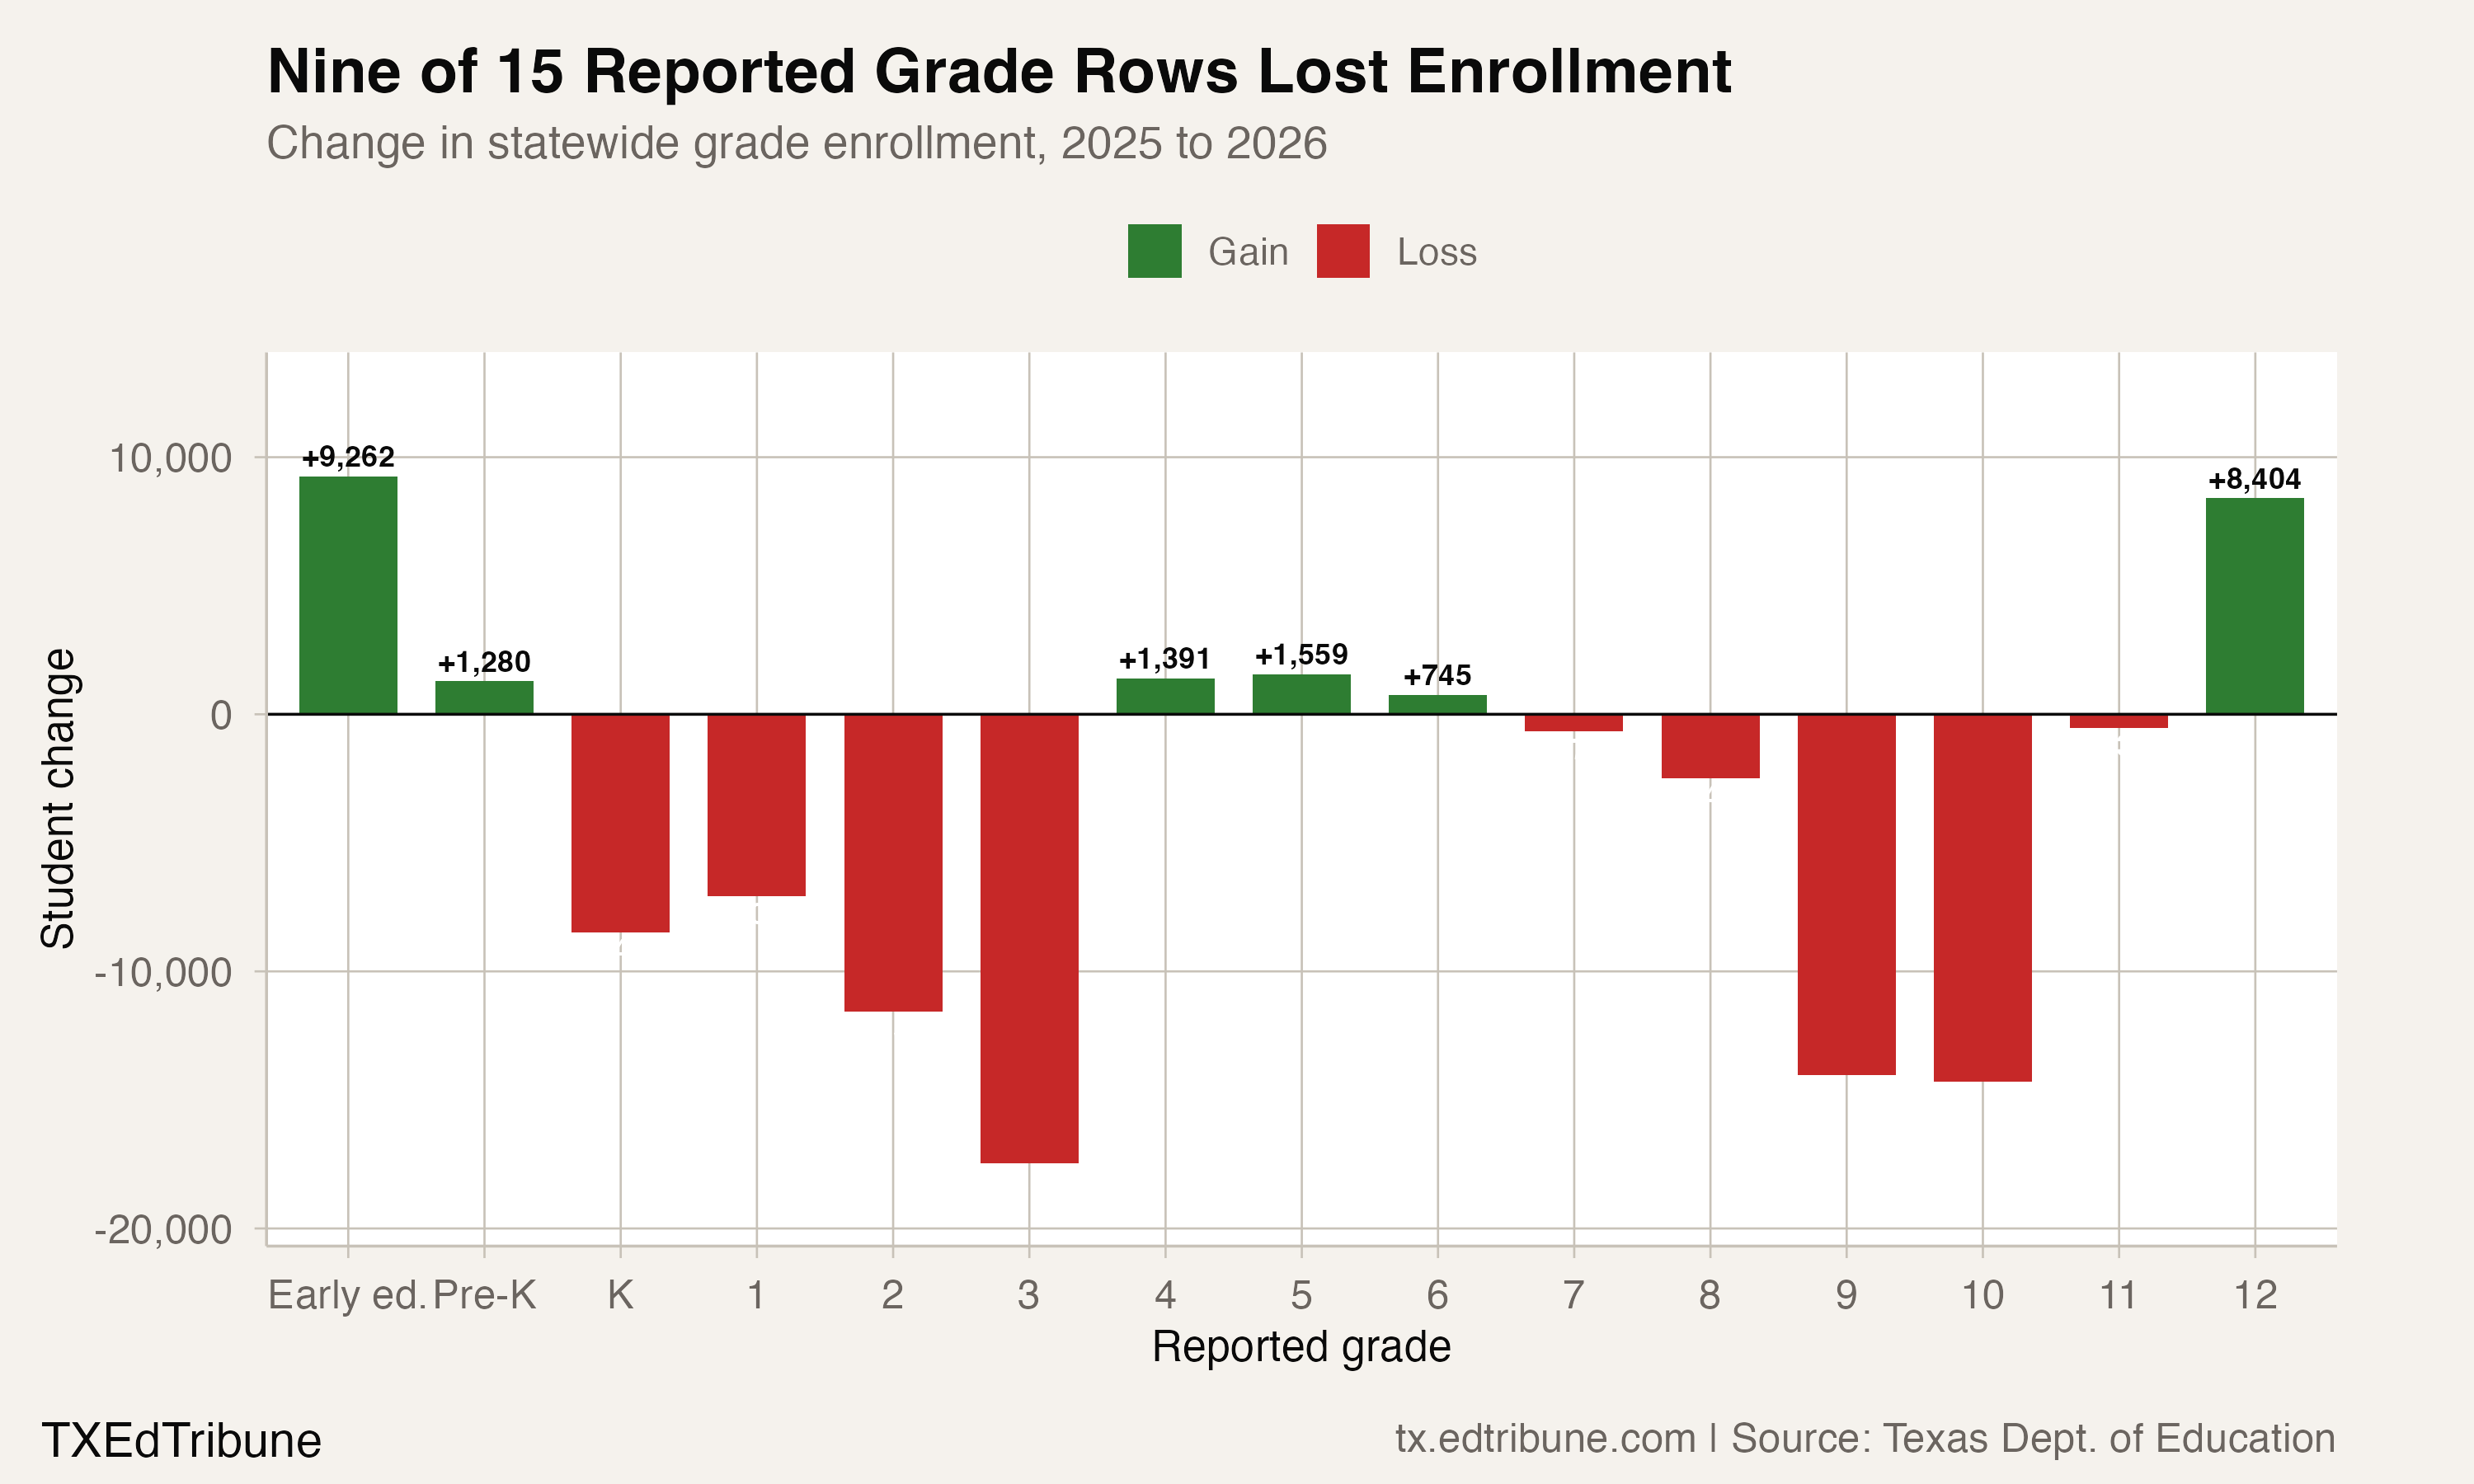
The grade chart is a component comparison, not a complete decomposition of the statewide decline. Texas' 2026 grade rows sum to 6,771 fewer students than the published statewide total, while the 2025 grade rows reconcile exactly. The analysis leaves that residual visible rather than assigning it to a grade.
Enrollment rows do not explain why a district or grade changed. Local demographics, boundaries, school organization, sector movement and reporting changes remain unresourced explanations in this analysis. The observed result is narrower: Texas enrolled fewer students overall even though more stable district IDs grew than declined, because losses were concentrated in larger systems and selected grade rows.
The TXEdTribune contacted the Texas Education Agency for comment and did not receive a response before publication.
This analysis uses fall enrollment records from the Texas Education Agency's PEIMS Standard Reports for reporting years 2005 through 2026. Statewide totals are package-native state rows. District comparisons use stable IDs present in 2020, 2025 and 2026; grade comparisons retain the agency's native grade codes.
Detailed code that reproduces the analysis and figures in this article is available exclusively to EdTribune subscribers.
Discussion
Sign in to join the discussion.
Loading comments...