In this series: Texas 2025-26 Enrollment.
Correction (October 8, 2026): Enrollment figures and five-year comparisons have been corrected, with the two report series kept separate. Earlier claims about every annual gain shrinking, the causes of the decline and what would happen next have been removed.
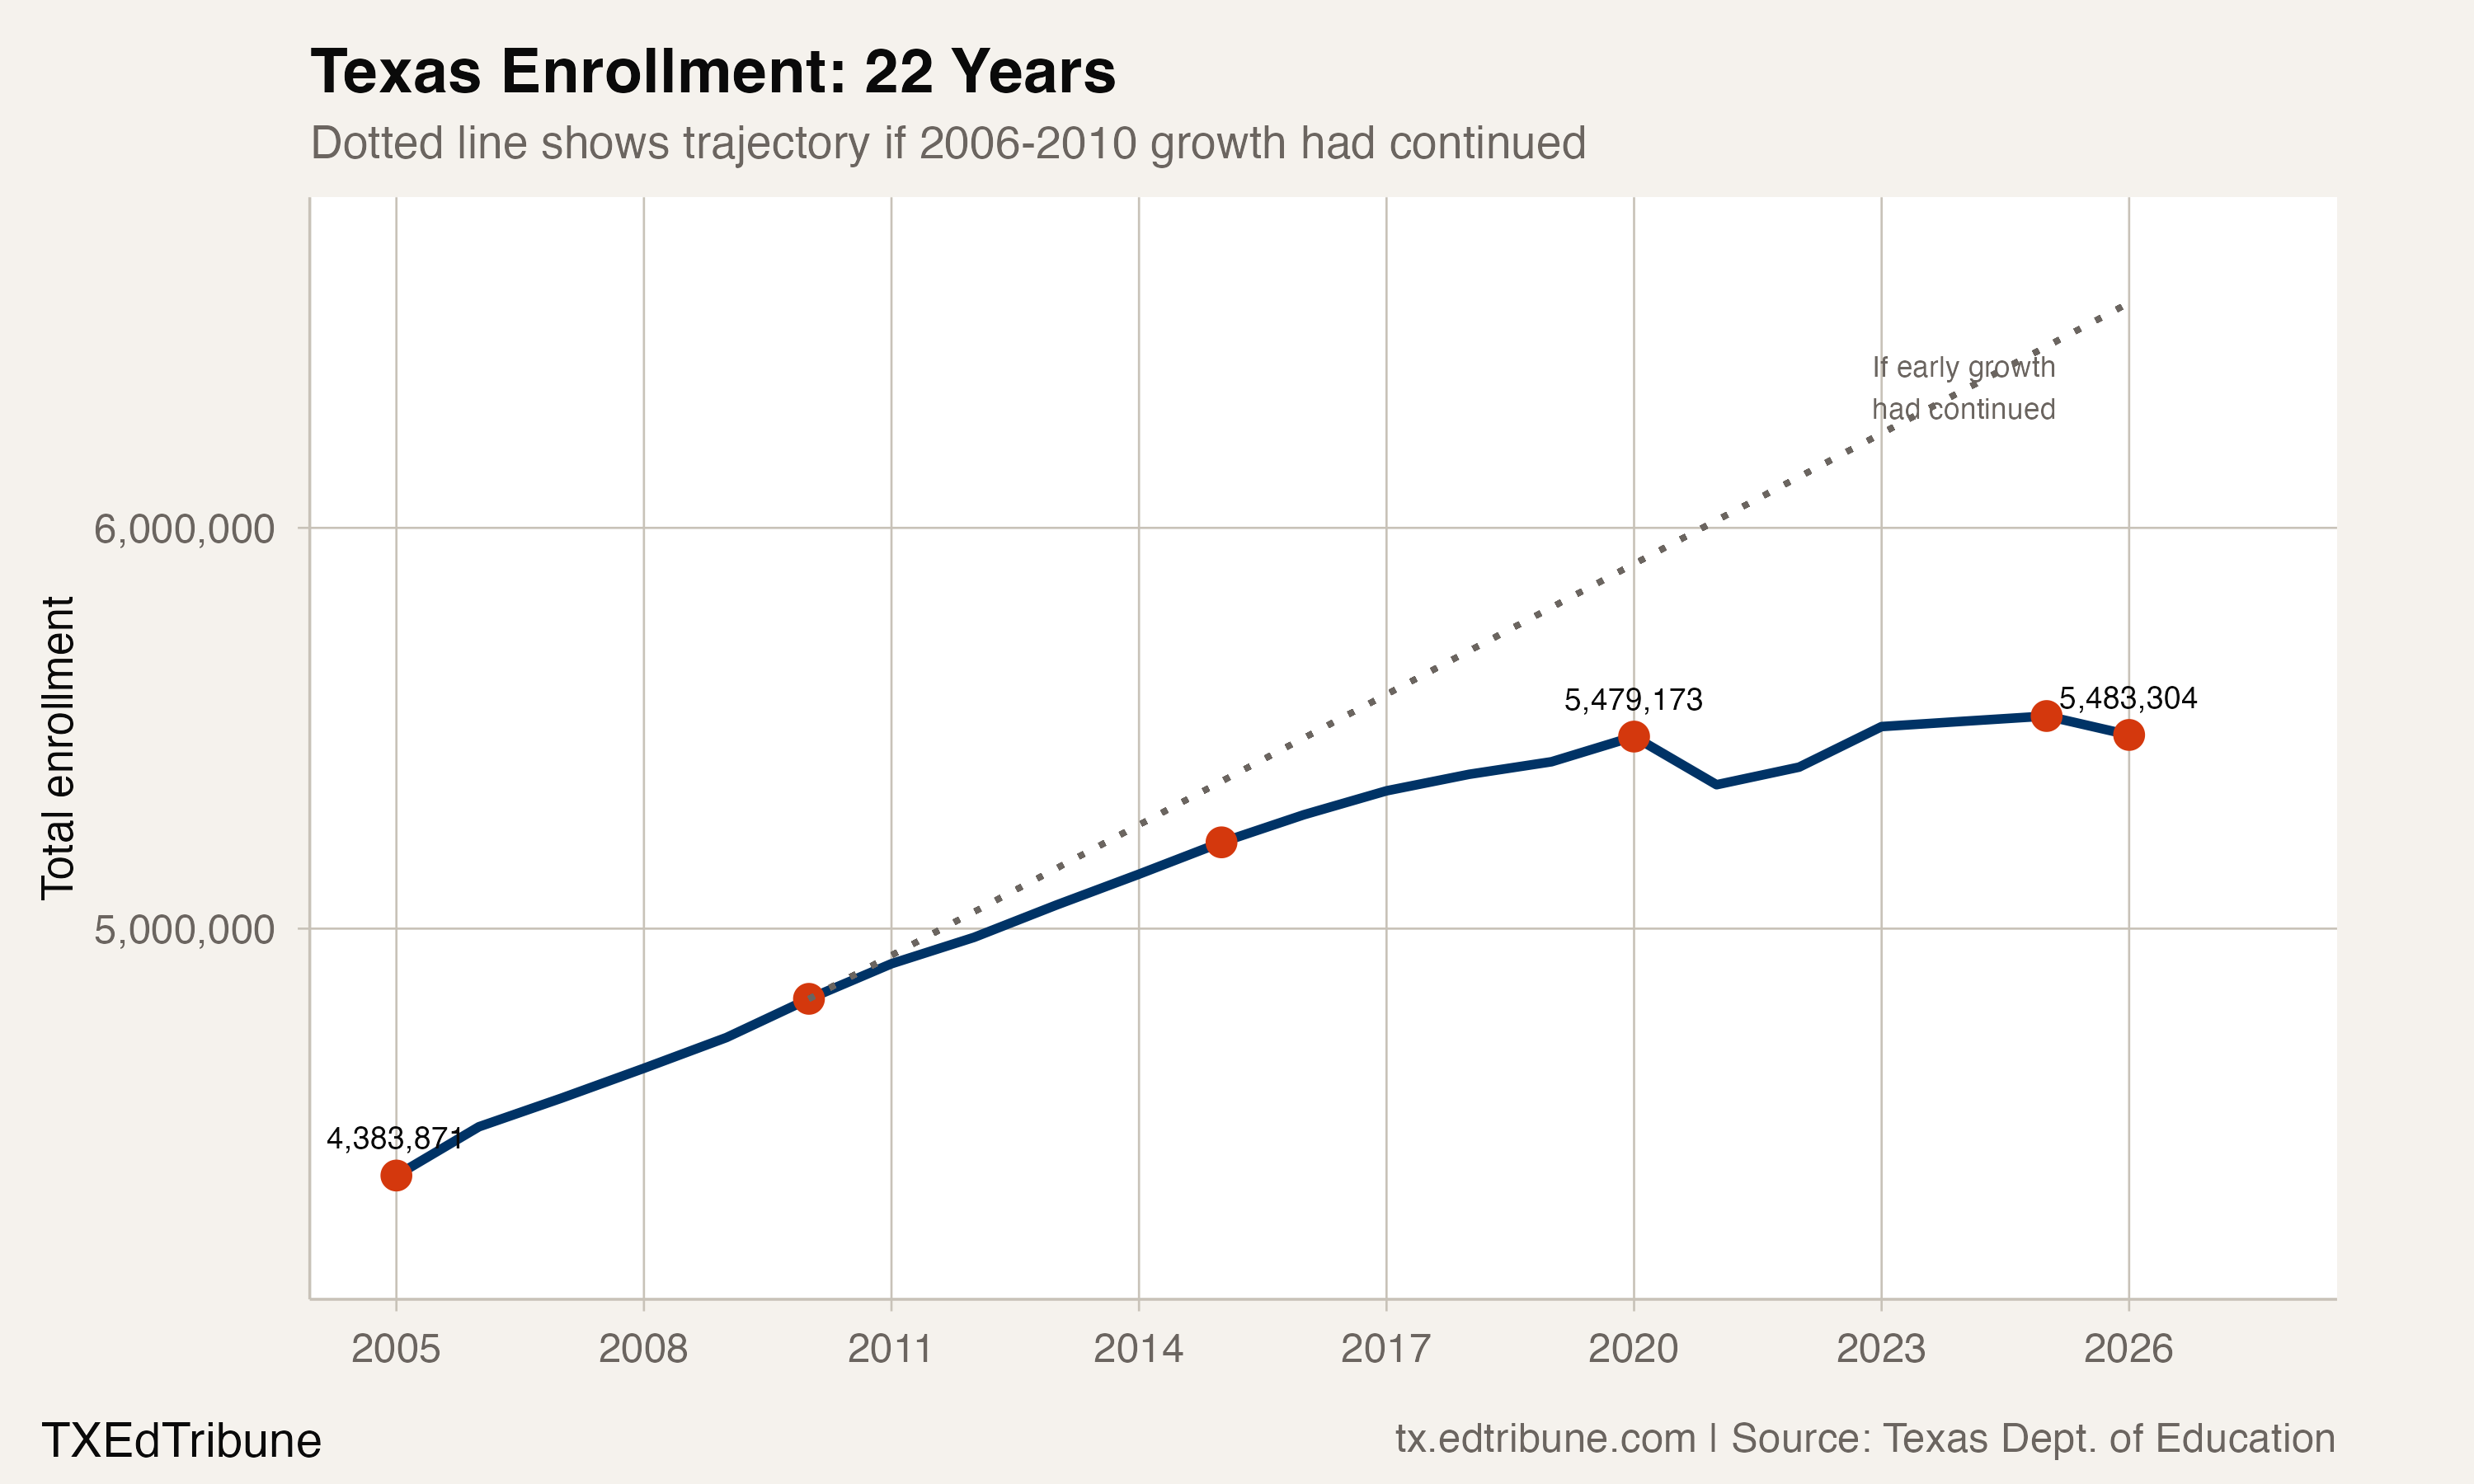
Texas public schools added 1,095,302 students between 2004-05 and 2019-20, a 25.0% increase. The gains continued in the next five-year period, but at a much slower pace: 51,326 students, compared with 440,907 in the earliest five-year block examined here.
The newest pair of Texas Education Agency Student Enrollment Reports tells a separate, more recent story. Last school year, 2025-26, statewide enrollment was 5,467,642, down from 5,544,255 in 2024-25. That is a decline of 76,613 students, or 1.38%. These are reported school-year counts, rather than live counts for 2026-27.
The same recent reports show Houston ISD↗ET losing 7,915 students and Dallas ISD↗ET losing 5,494. The statewide historical growth is real, but it does not describe what those districts experienced in the most recent comparison.
Smaller gains across equal periods
The historical comparison follows the native annual performance reports and their AEIS archive from 2004-05 through 2024-25. Each interval below spans five years. The annual rate is the compound change between its published statewide enrollment totals.
| Reporting interval | Students added | Annual compound growth |
|---|---|---|
| 2004-05 to 2009-10 | 440,907 | 1.94% |
| 2009-10 to 2014-15 | 390,504 | 1.57% |
| 2014-15 to 2019-20 | 263,891 | 0.99% |
| 2019-20 to 2024-25 | 51,326 | 0.19% |
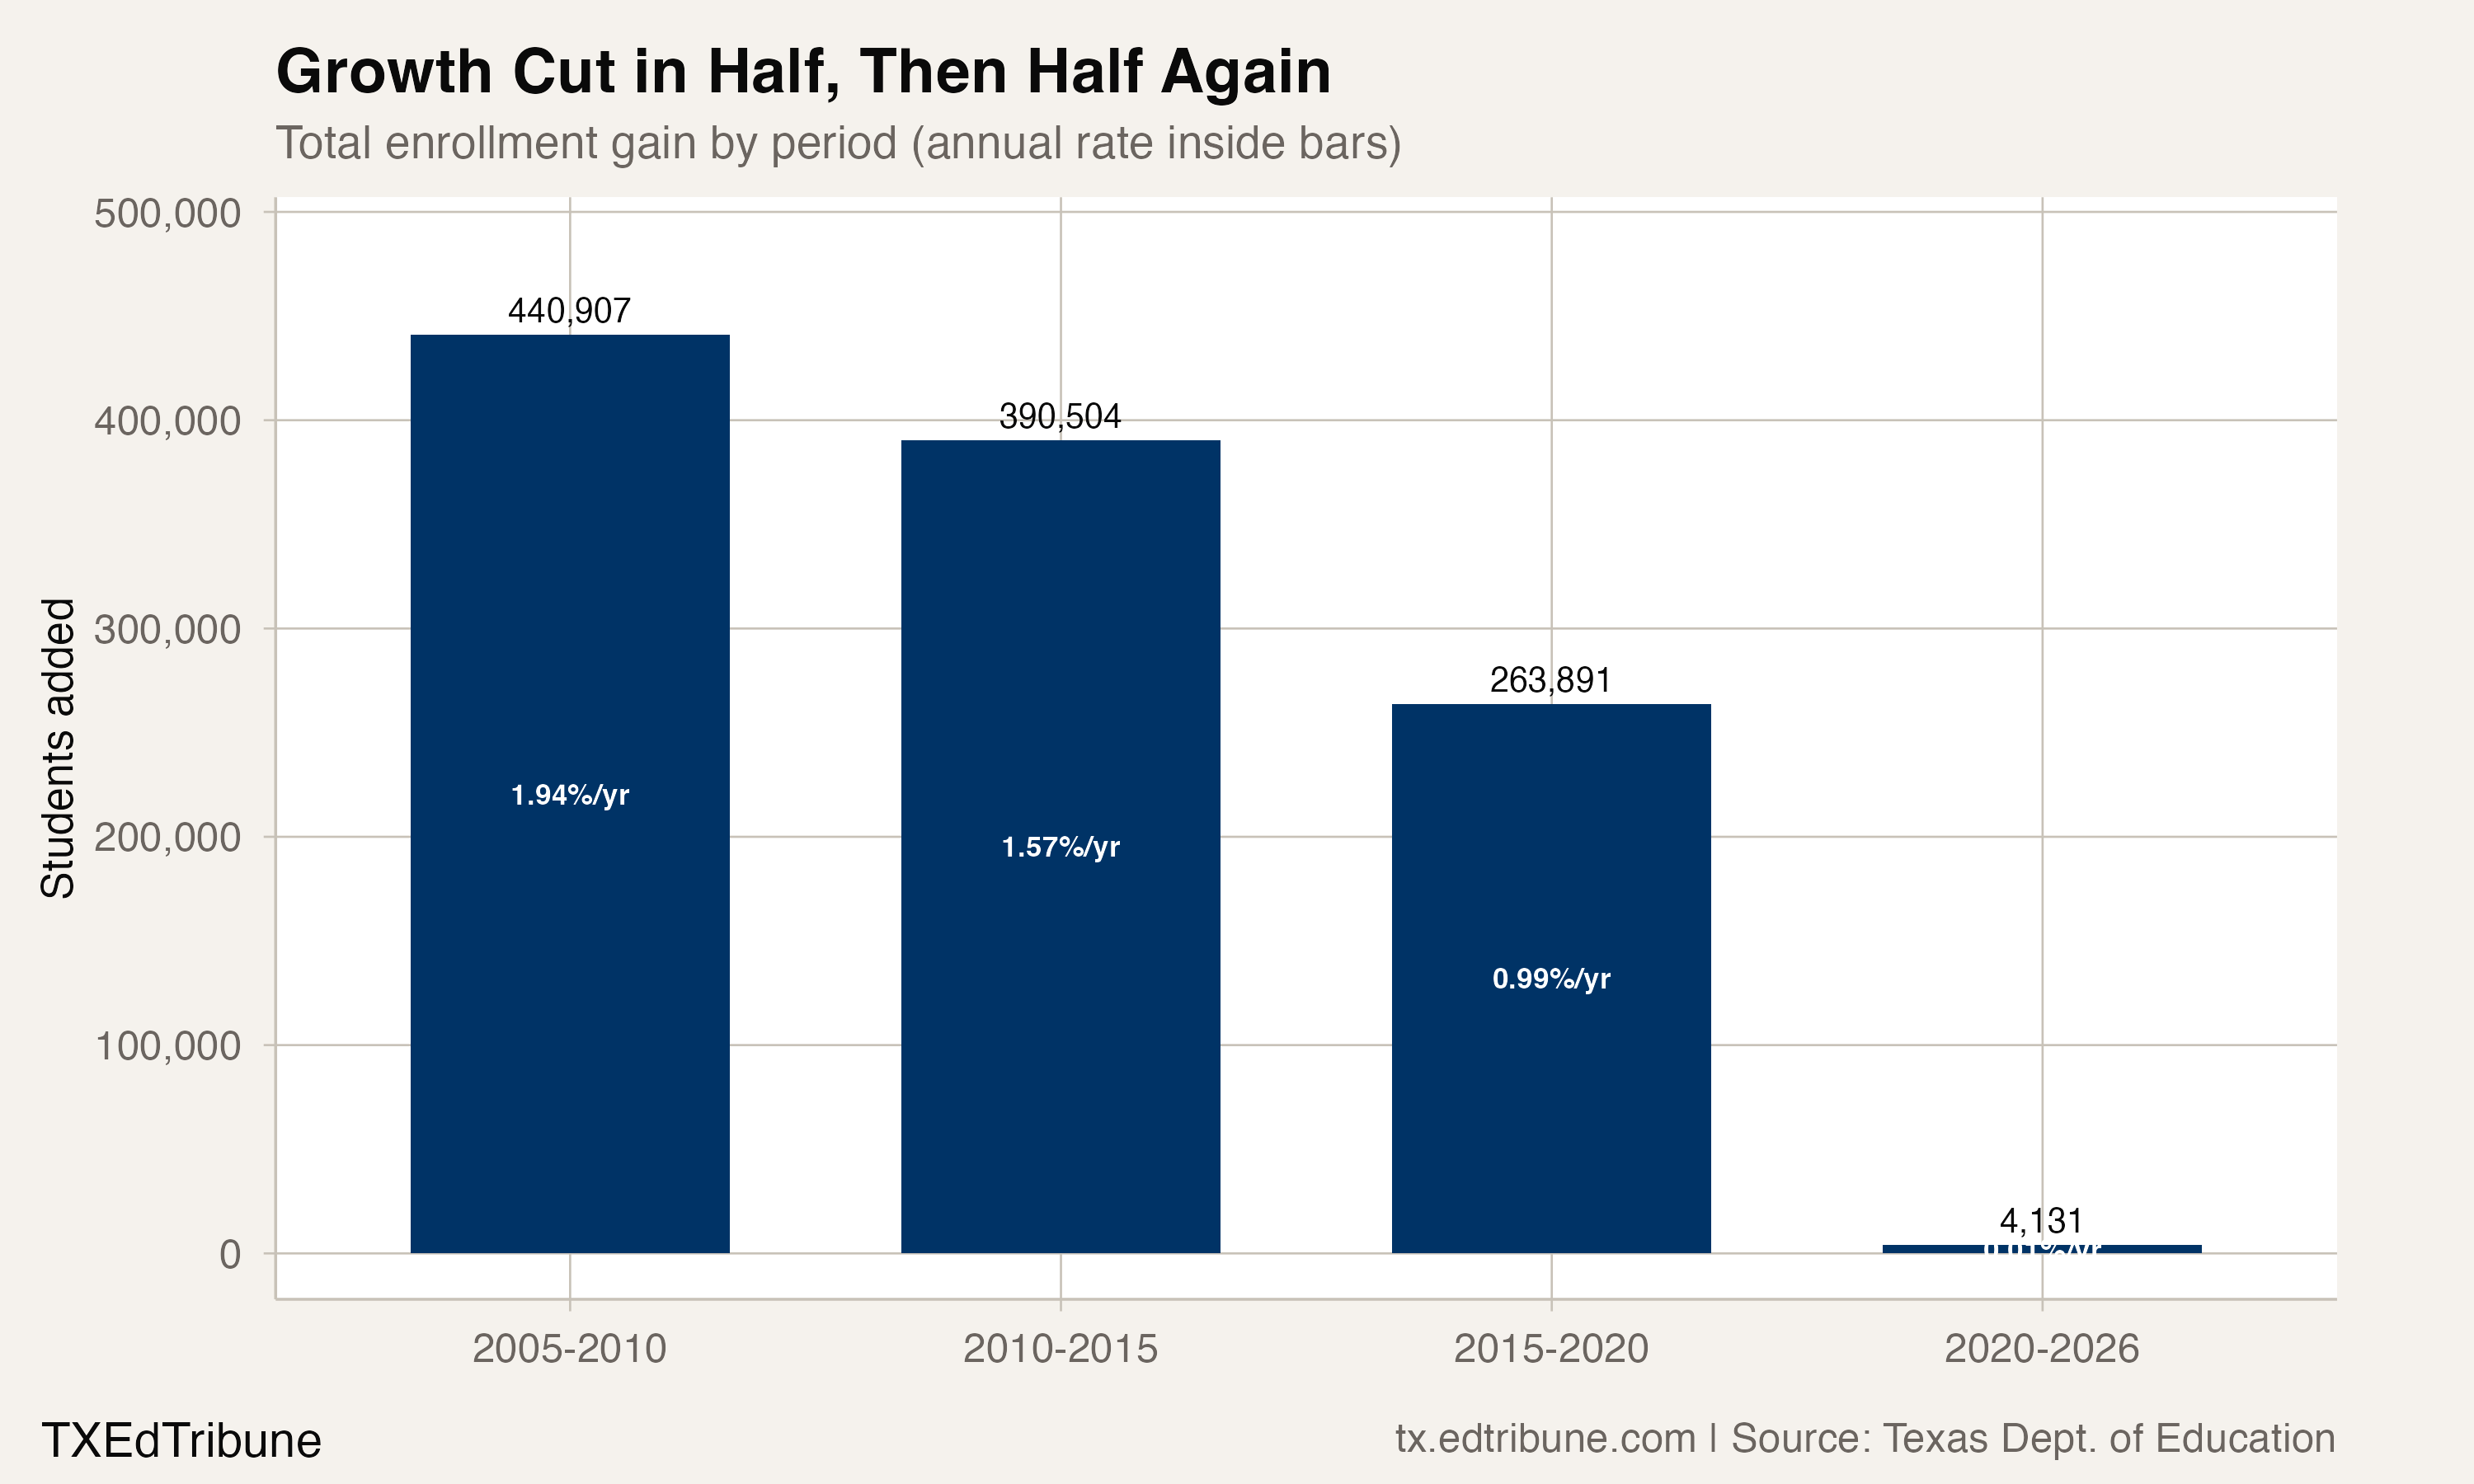
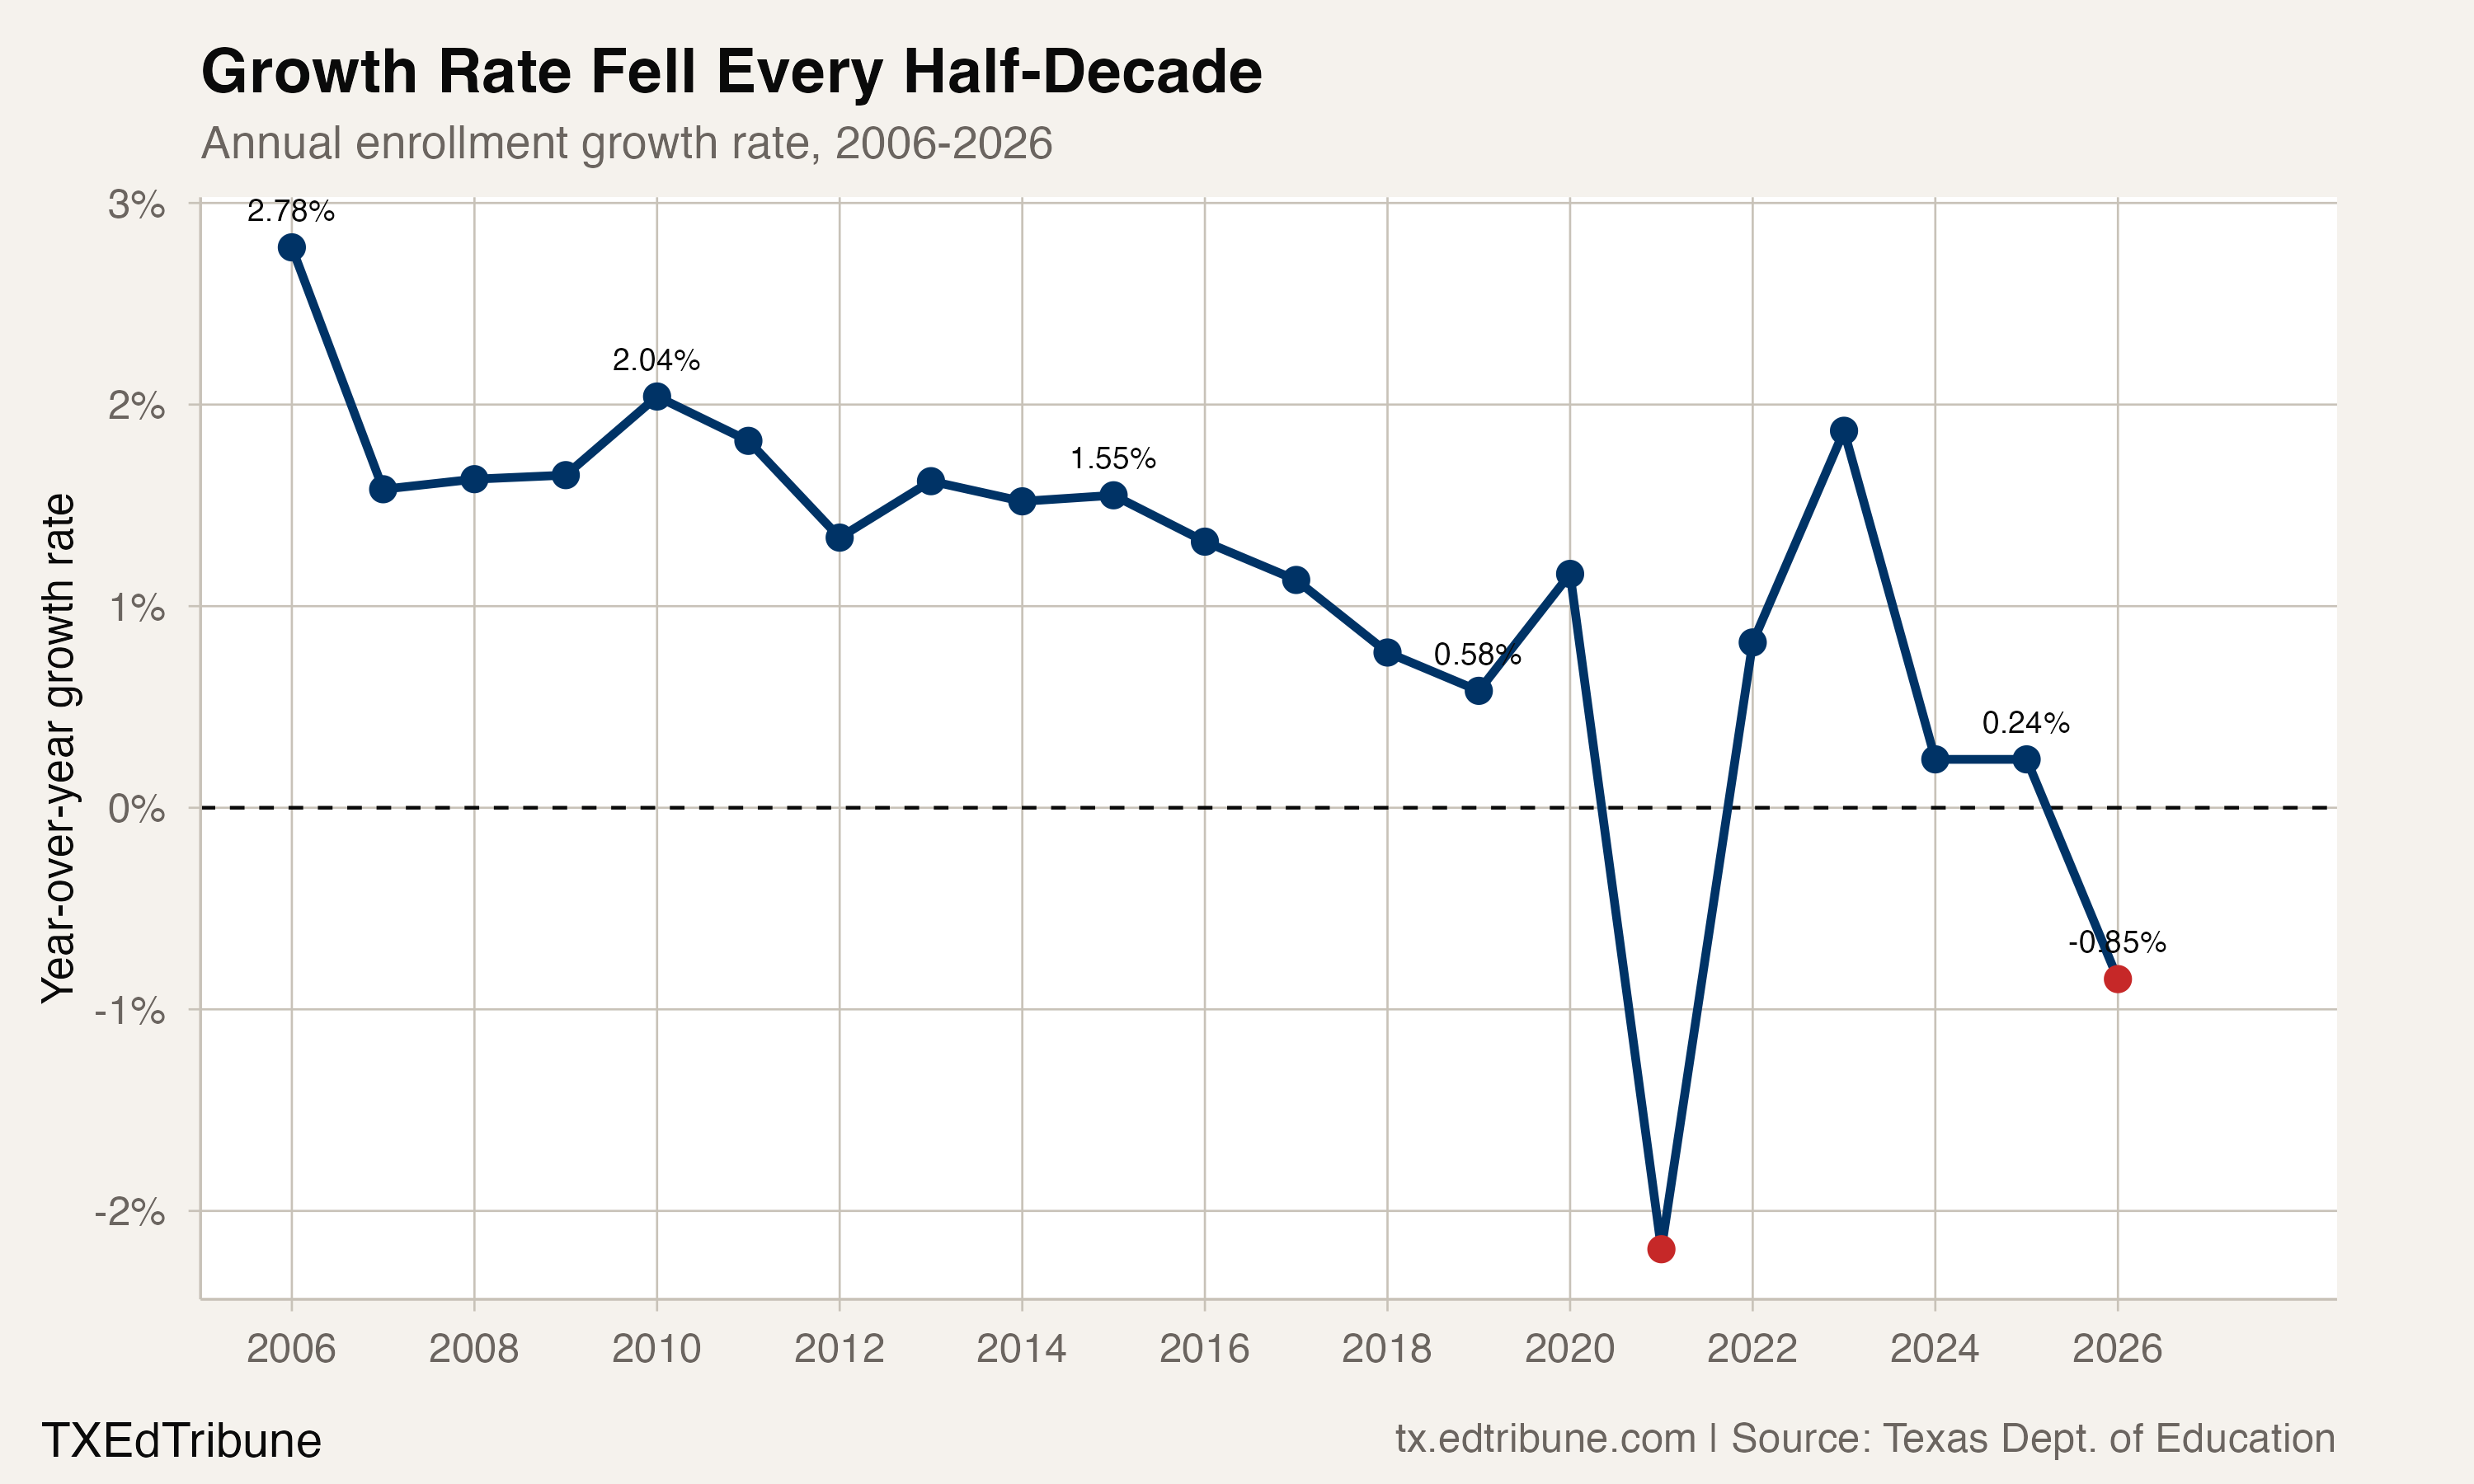
Growth slowed across these equal intervals. It did not stop throughout the historical series, and the annual path was not a steady slide. Every annual transition from 2005-06 through 2019-20 was positive, but the gains sometimes increased from one year to the next.
The historical reports then recorded a loss of 120,133 students in 2020-21. A gain of 101,222 in 2022-23 followed. The gains in 2023-24 and 2024-25 were much smaller: 13,314 and 13,035. The last historical five-year interval therefore contains a large decline, subsequent gains and a positive net change. Similar endpoints do not mean nothing happened between them.
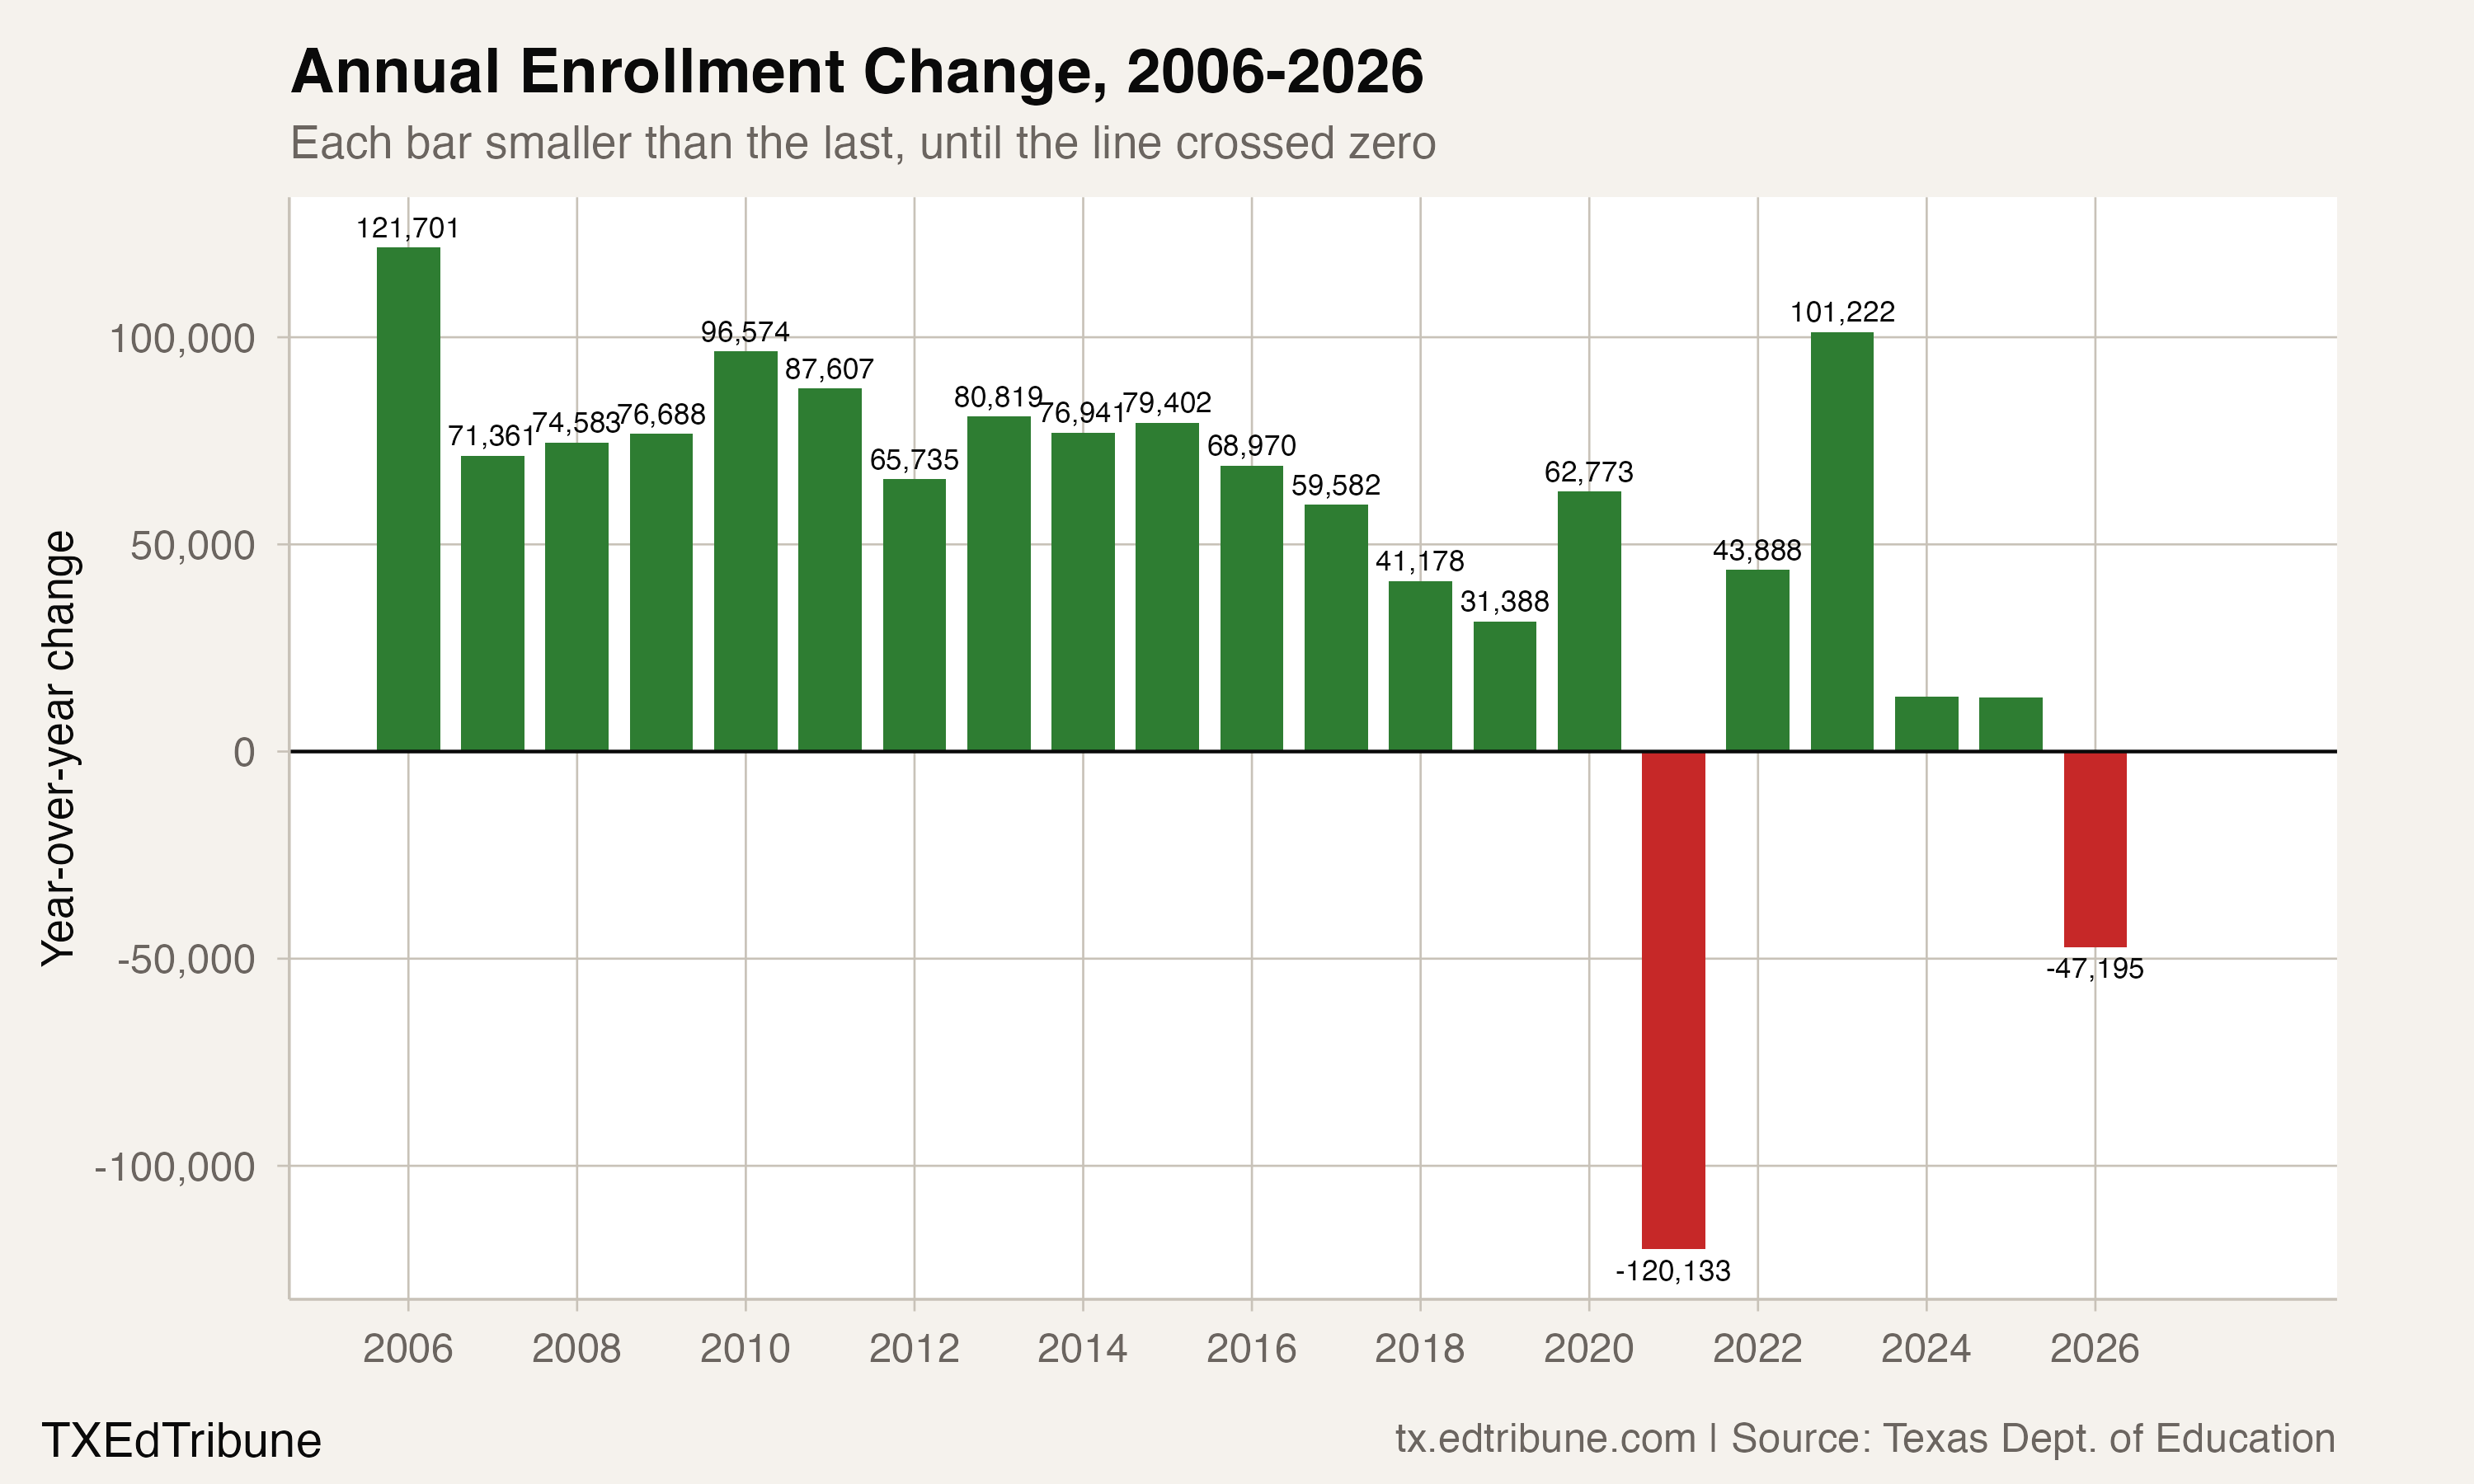
The compound rates give a useful comparison across equal spans. They do not imply that every single year's gain was smaller than the year before.
The newest decline belongs to a separate report pair
The annual performance report total for 2024-25 is 5,530,499. The Student Enrollment Reports total for that same year is 5,544,255, a difference of 13,756. Their overlapping counts differ; that difference alone does not establish why, or make their endpoints interchangeable.
The recent decline is calculated entirely within the Student Enrollment Reports. It is not appended to the historical series to make a longer growth rate, a statewide record or a projection.
Among 1,194 district-level entities with a finite published enrollment total in both recent reports and a positive starting total, 751 reported a lower count in 2025-26. This is the matched reporting cohort, rather than an assertion about every entity that appears in either year. Individual campuses are not included in that comparison.
For a fixed set of six districts, the changes were:
| District | Change from 2024-25 to 2025-26 | Change against its prior published total |
|---|---|---|
| Houston ISD↗ET | -7,915 | -4.5% |
| Dallas ISD↗ET | -5,494 | -3.9% |
| Aldine ISD↗ET | -4,258 | -7.5% |
| Austin ISD↗ET | -3,198 | -4.4% |
| Cypress-Fairbanks ISD↗ET | -3,230 | -2.7% |
| Frisco ISD↗ET | -2,576 | -3.9% |
These are examples drawn from the same recent pair, not a ranking of every district. A decline in Frisco's reported count and a decline in Houston's reported count can be compared numerically; the totals do not establish that the same factors produced them.
The grade mix changed, without a one-way crossing
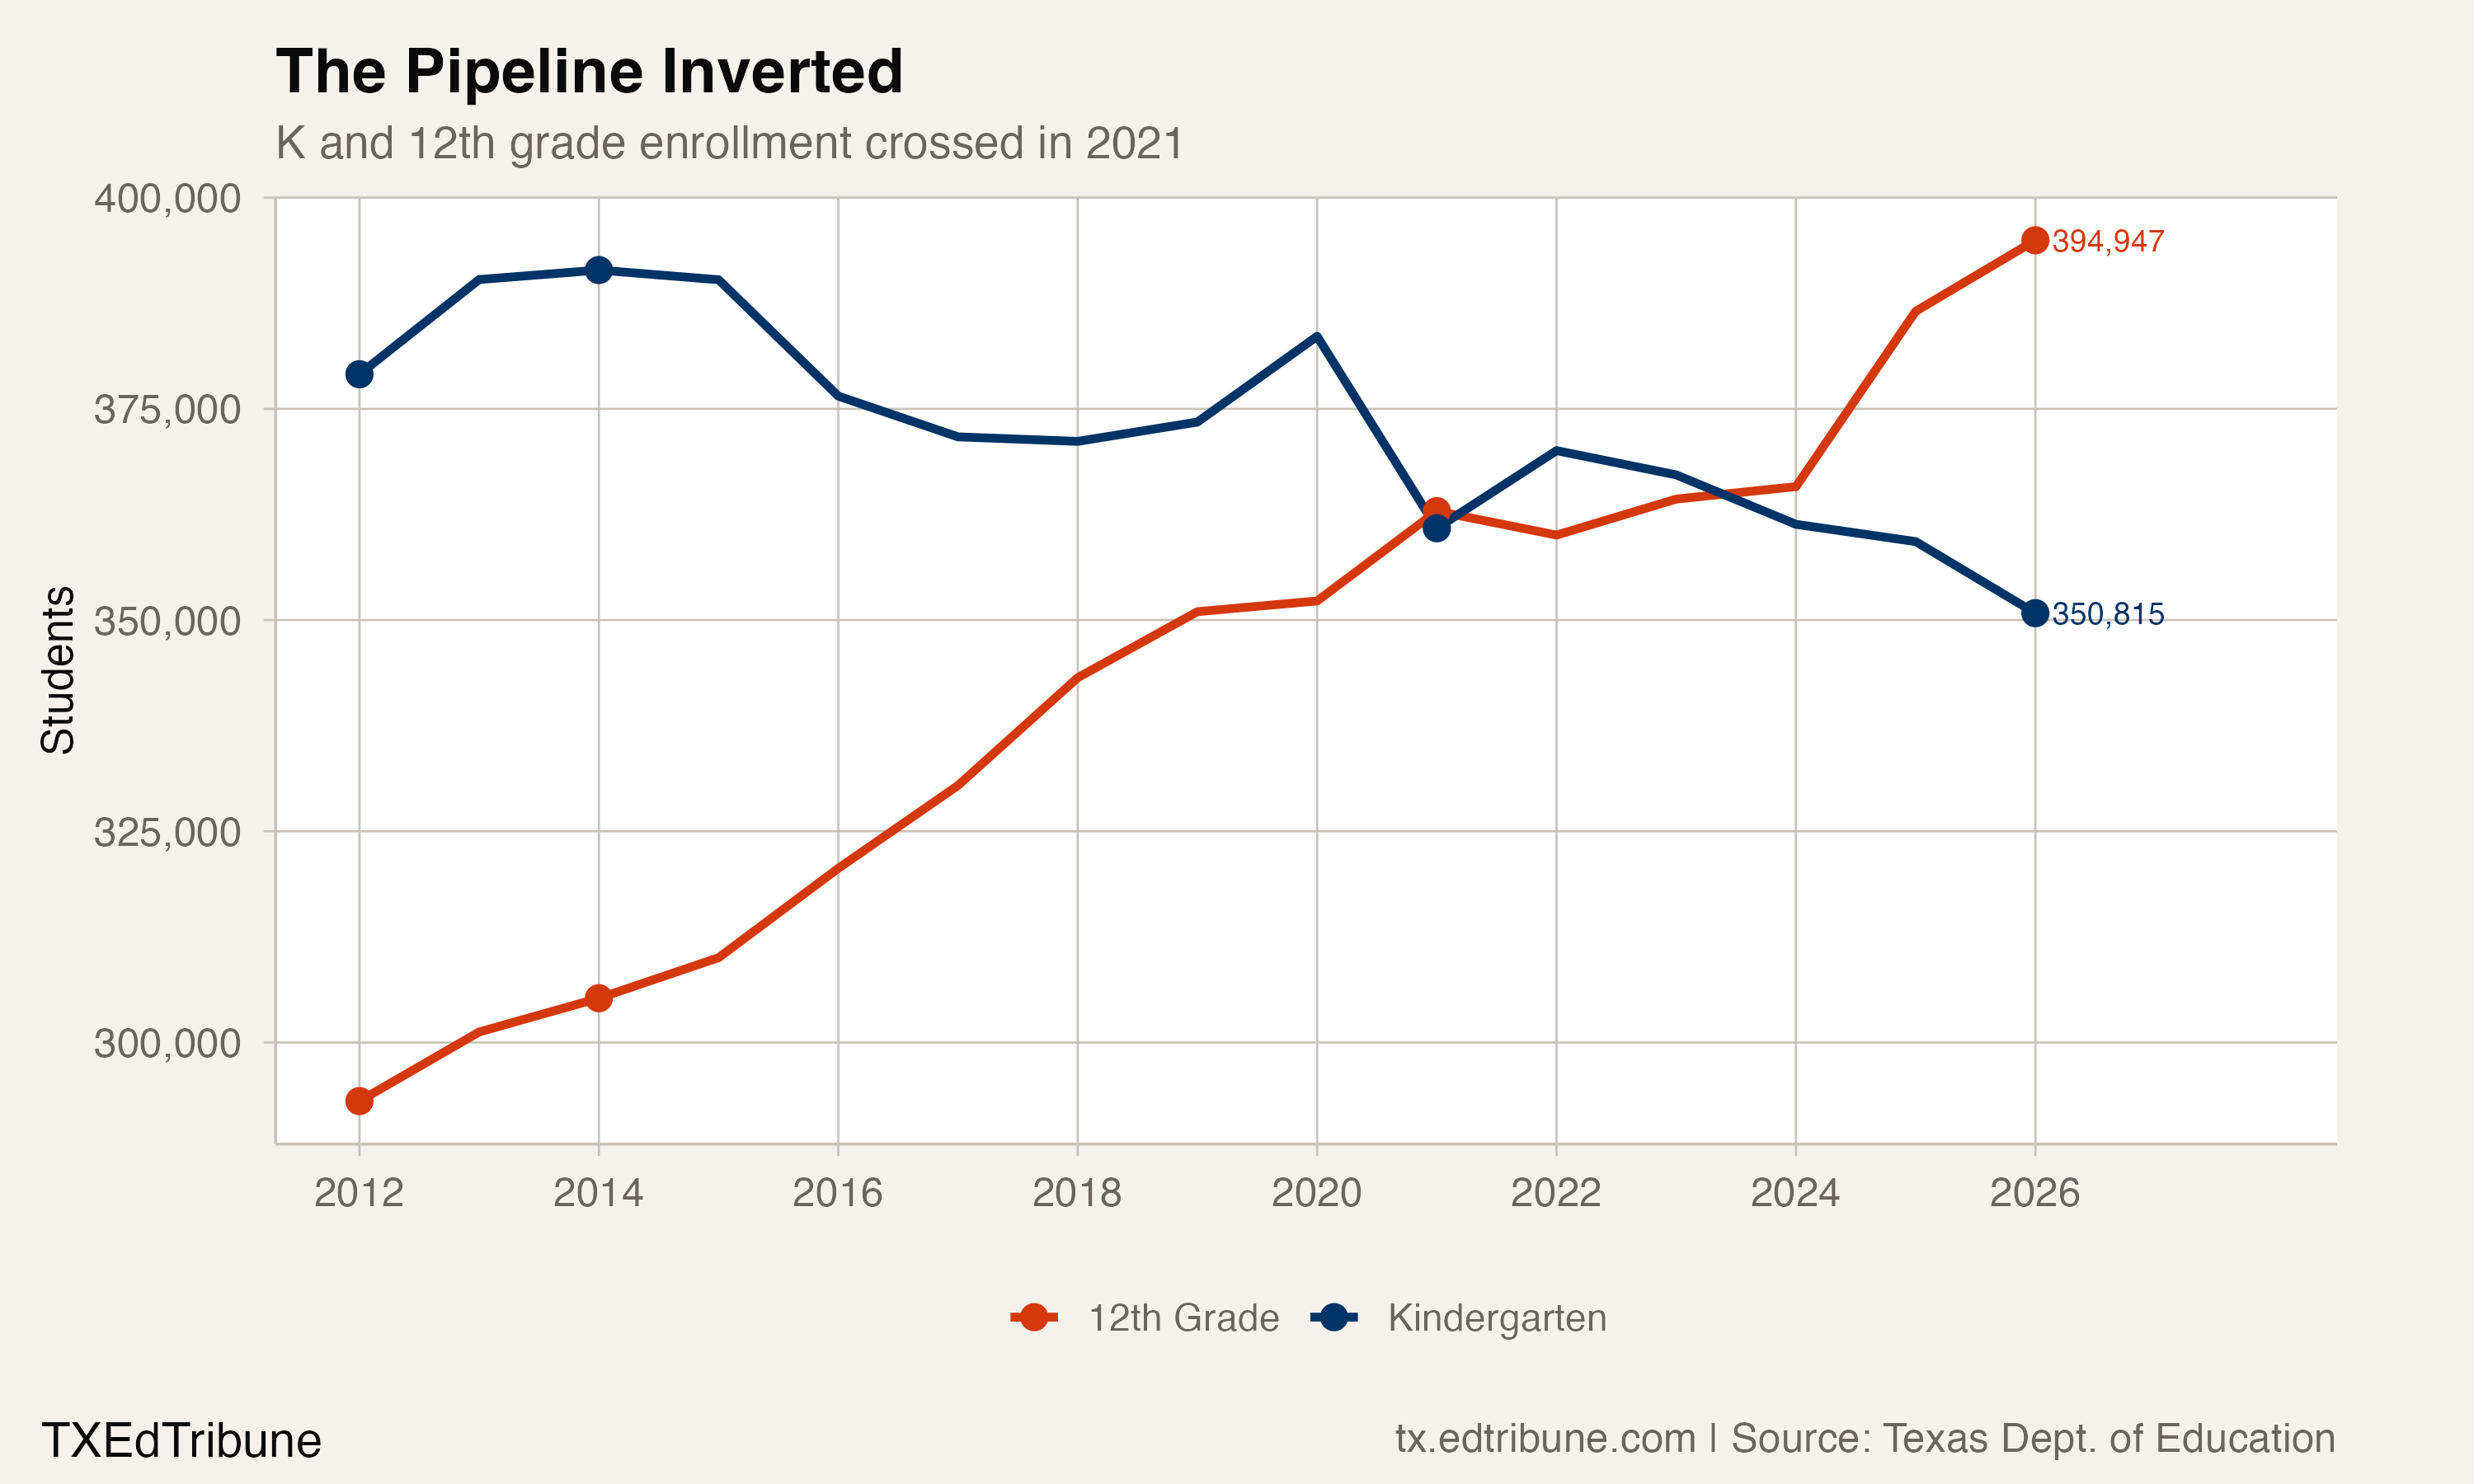
Kindergarten reached its highest count in the complete historical window in 2013-14, at 391,421 students. By 2024-25, that count was 359,286. The 12th-grade count rose from 246,863 in 2004-05 to 386,543 in 2024-25.
The first year with more 12th graders than kindergartners in this historical panel was 2020-21. Kindergarten moved back above 12th grade in 2021-22 and remained above it in 2022-23. The lines crossed again in 2023-24, and 12th grade remained higher in 2024-25. Calling the initial crossing permanent would miss those reversals.
In the separate 2025-26 Student Enrollment Reports, kindergarten numbered 350,226 and 12th grade numbered 394,642: 88.7 kindergartners per 100 12th graders. Those are two grades observed in the same reporting year. They are not a tracked cohort or a forecast of future total enrollment.
Counts and planning assumptions
The enrollment reports do not identify which families moved, changed schools or never enrolled. They cannot establish how much of the statewide change came from births, migration, school choice or a district policy.
There is a narrower planning context in TEA's attendance projection letter. The agency says it incorporates age-cohort projections into its assumptions and asks school systems to examine local factors when assessing projections. Its letter also distinguishes the estimates used for cashflow from final earnings based on actual average daily attendance and full-time-equivalent counts. An enrollment percentage change is not, by itself, a dollar estimate of a district's revenue loss.
For Houston, Dallas and the other districts in the table, the unresolved issue is what their own local enrollment and attendance evidence supports for staffing, facilities and budgets. The statewide figures establish smaller historical gains and a recent decline in a separate report pair. They do not supply a single cause or a guaranteed next step.
Sources: Texas Education Agency annual performance reports, including historical AEIS files, and separate Student Enrollment Reports. Historical comparisons use 2004-05 through 2024-25; recent comparisons use 2024-25 and 2025-26. The newest year described here is last school year's published enrollment.
Detailed code that reproduces the analysis and figures in this article is available exclusively to EdTribune subscribers.
Discussion
Sign in to join the discussion.
Loading comments...