In this series: Texas 2025-26 Enrollment.
Houston, Dallas, Austin, Fort Worth and San Antonio ISDs were all below their enrollment peaks in the state's 2024-25 performance reports. But being below a peak is different from being at a historical low. Only Houston, Fort Worth and San Antonio matched their lowest counts within the complete available historical window. Dallas and Austin did not.
Together, the five selected districts enrolled 502,185 students in 2024-25, compared with a combined high of 598,197 in 2014-15. The decline from that peak was 96,012 students, or 16.1%.
This comparison follows the same districts through every year from 2004-05 to 2024-25. Its historical highs and lows refer to that available reporting window, rather than every year since each district opened. The newer enrollment reports remain a separate comparison.
Five different histories
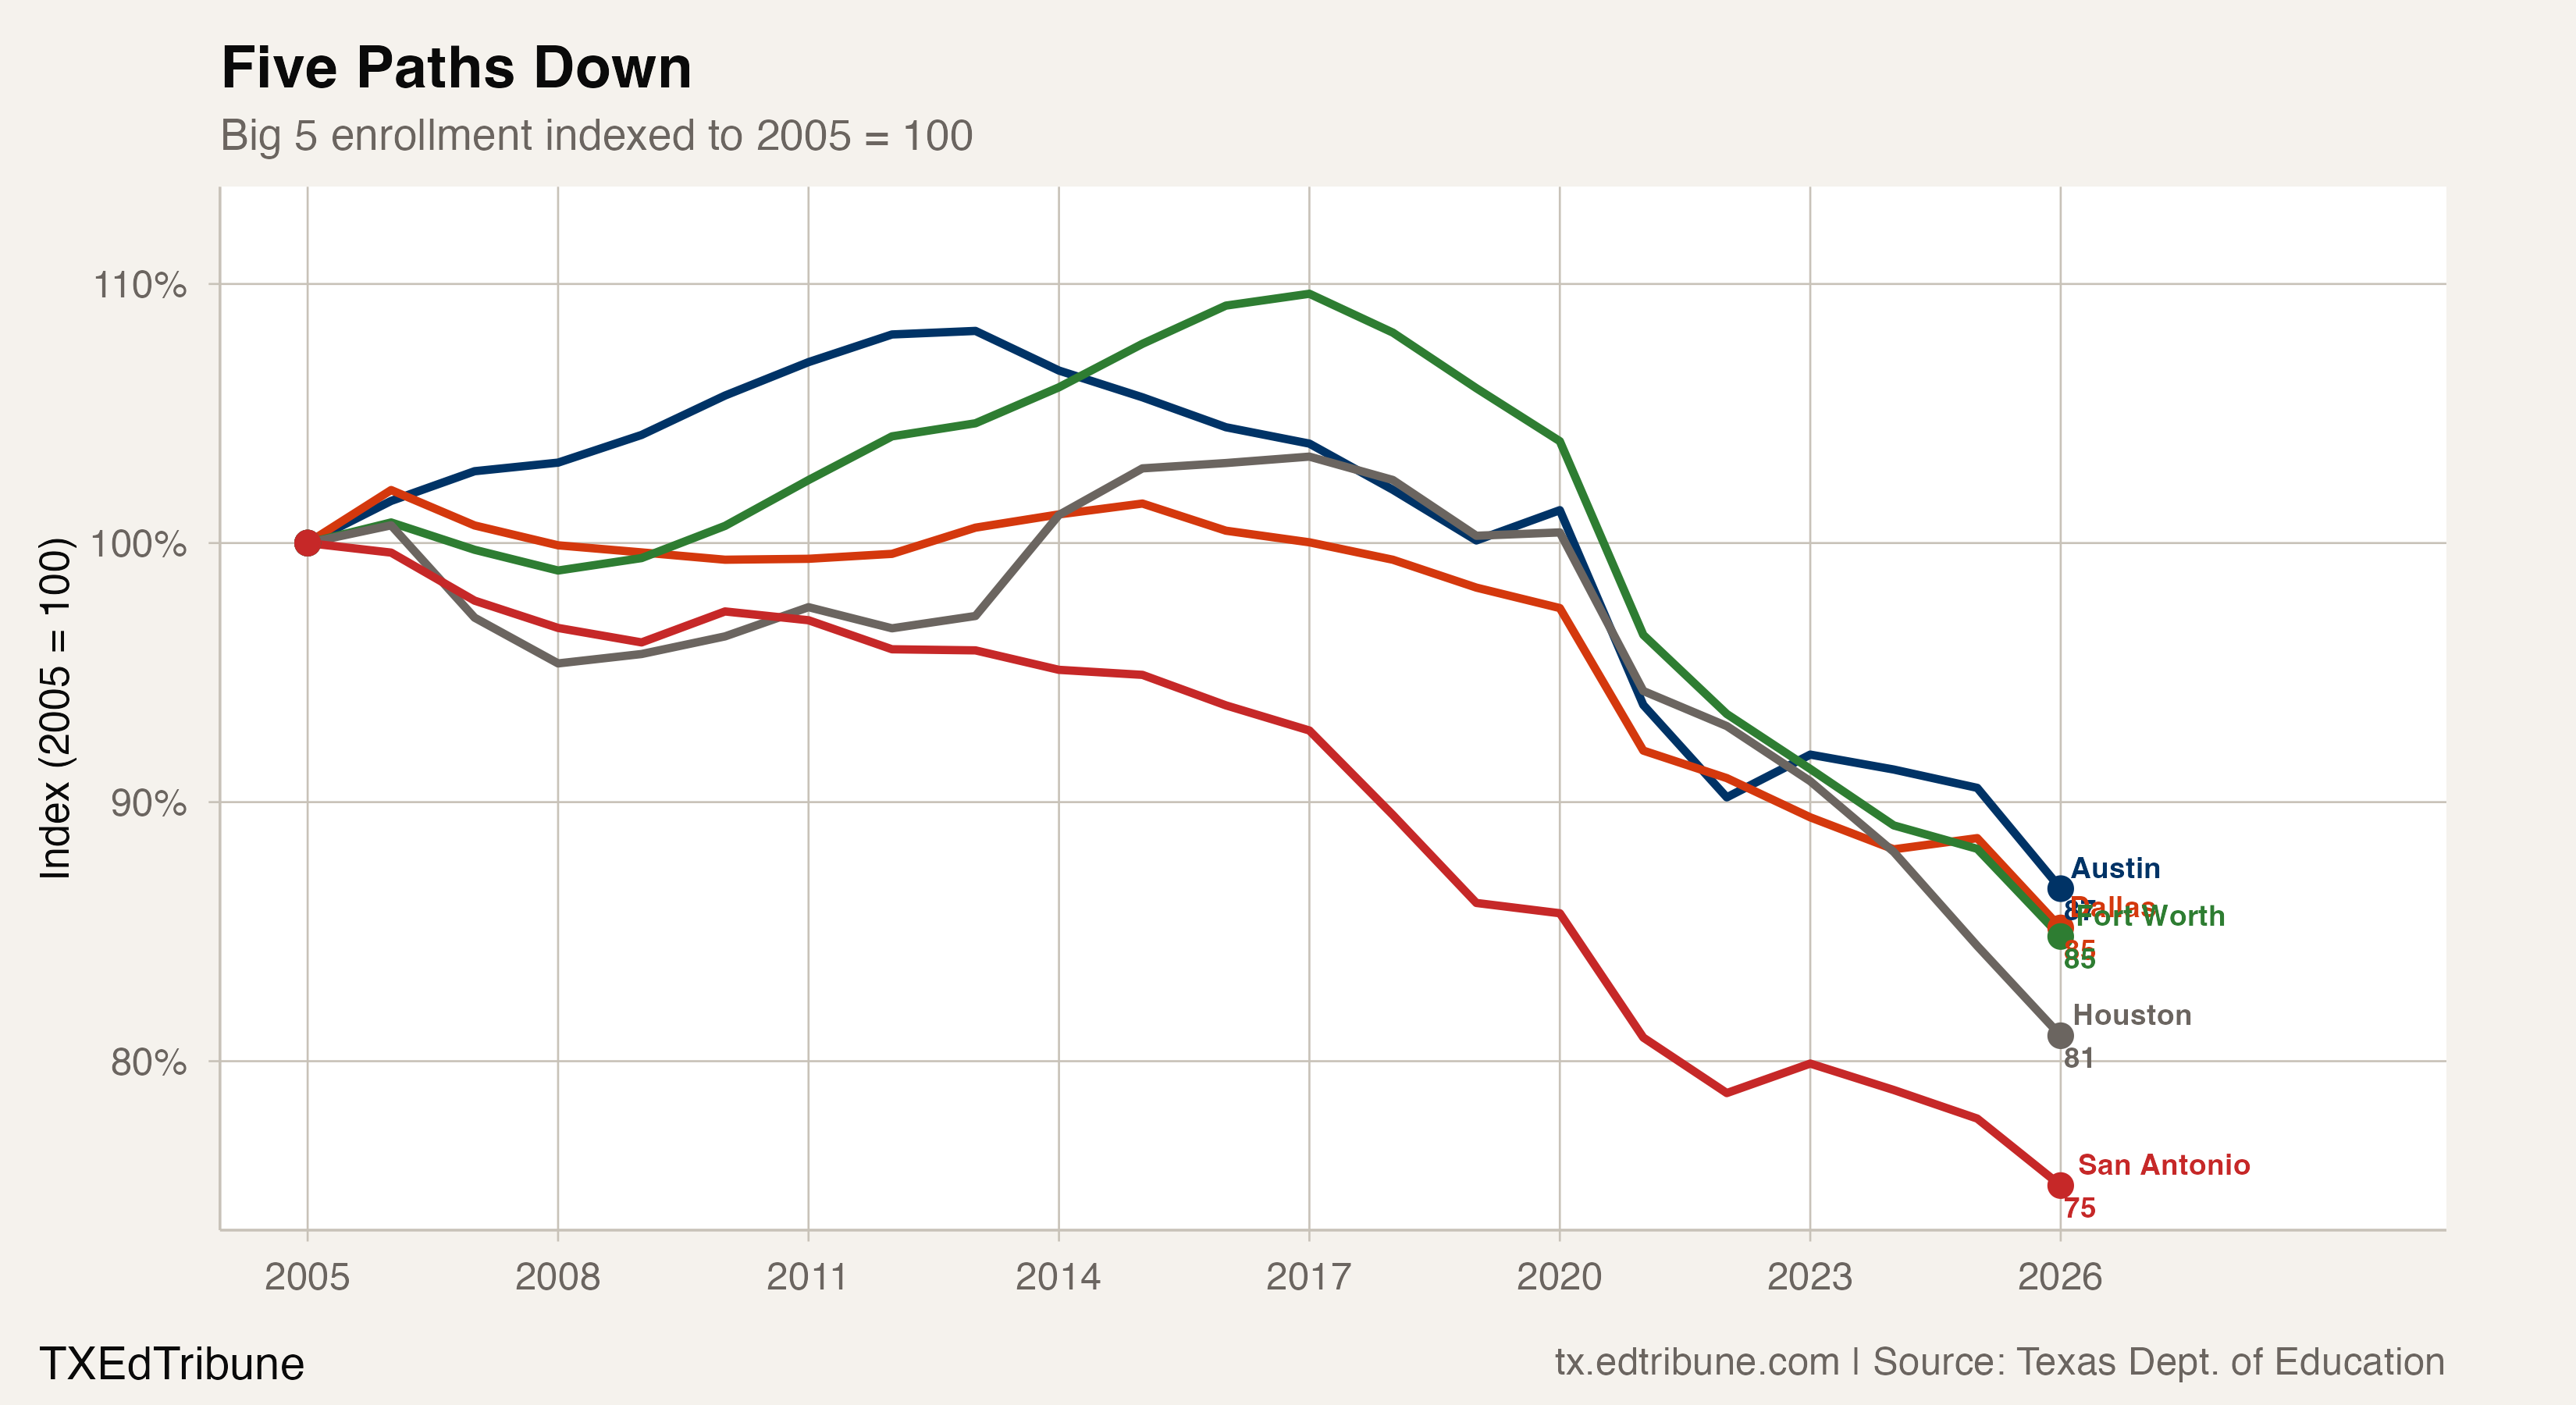
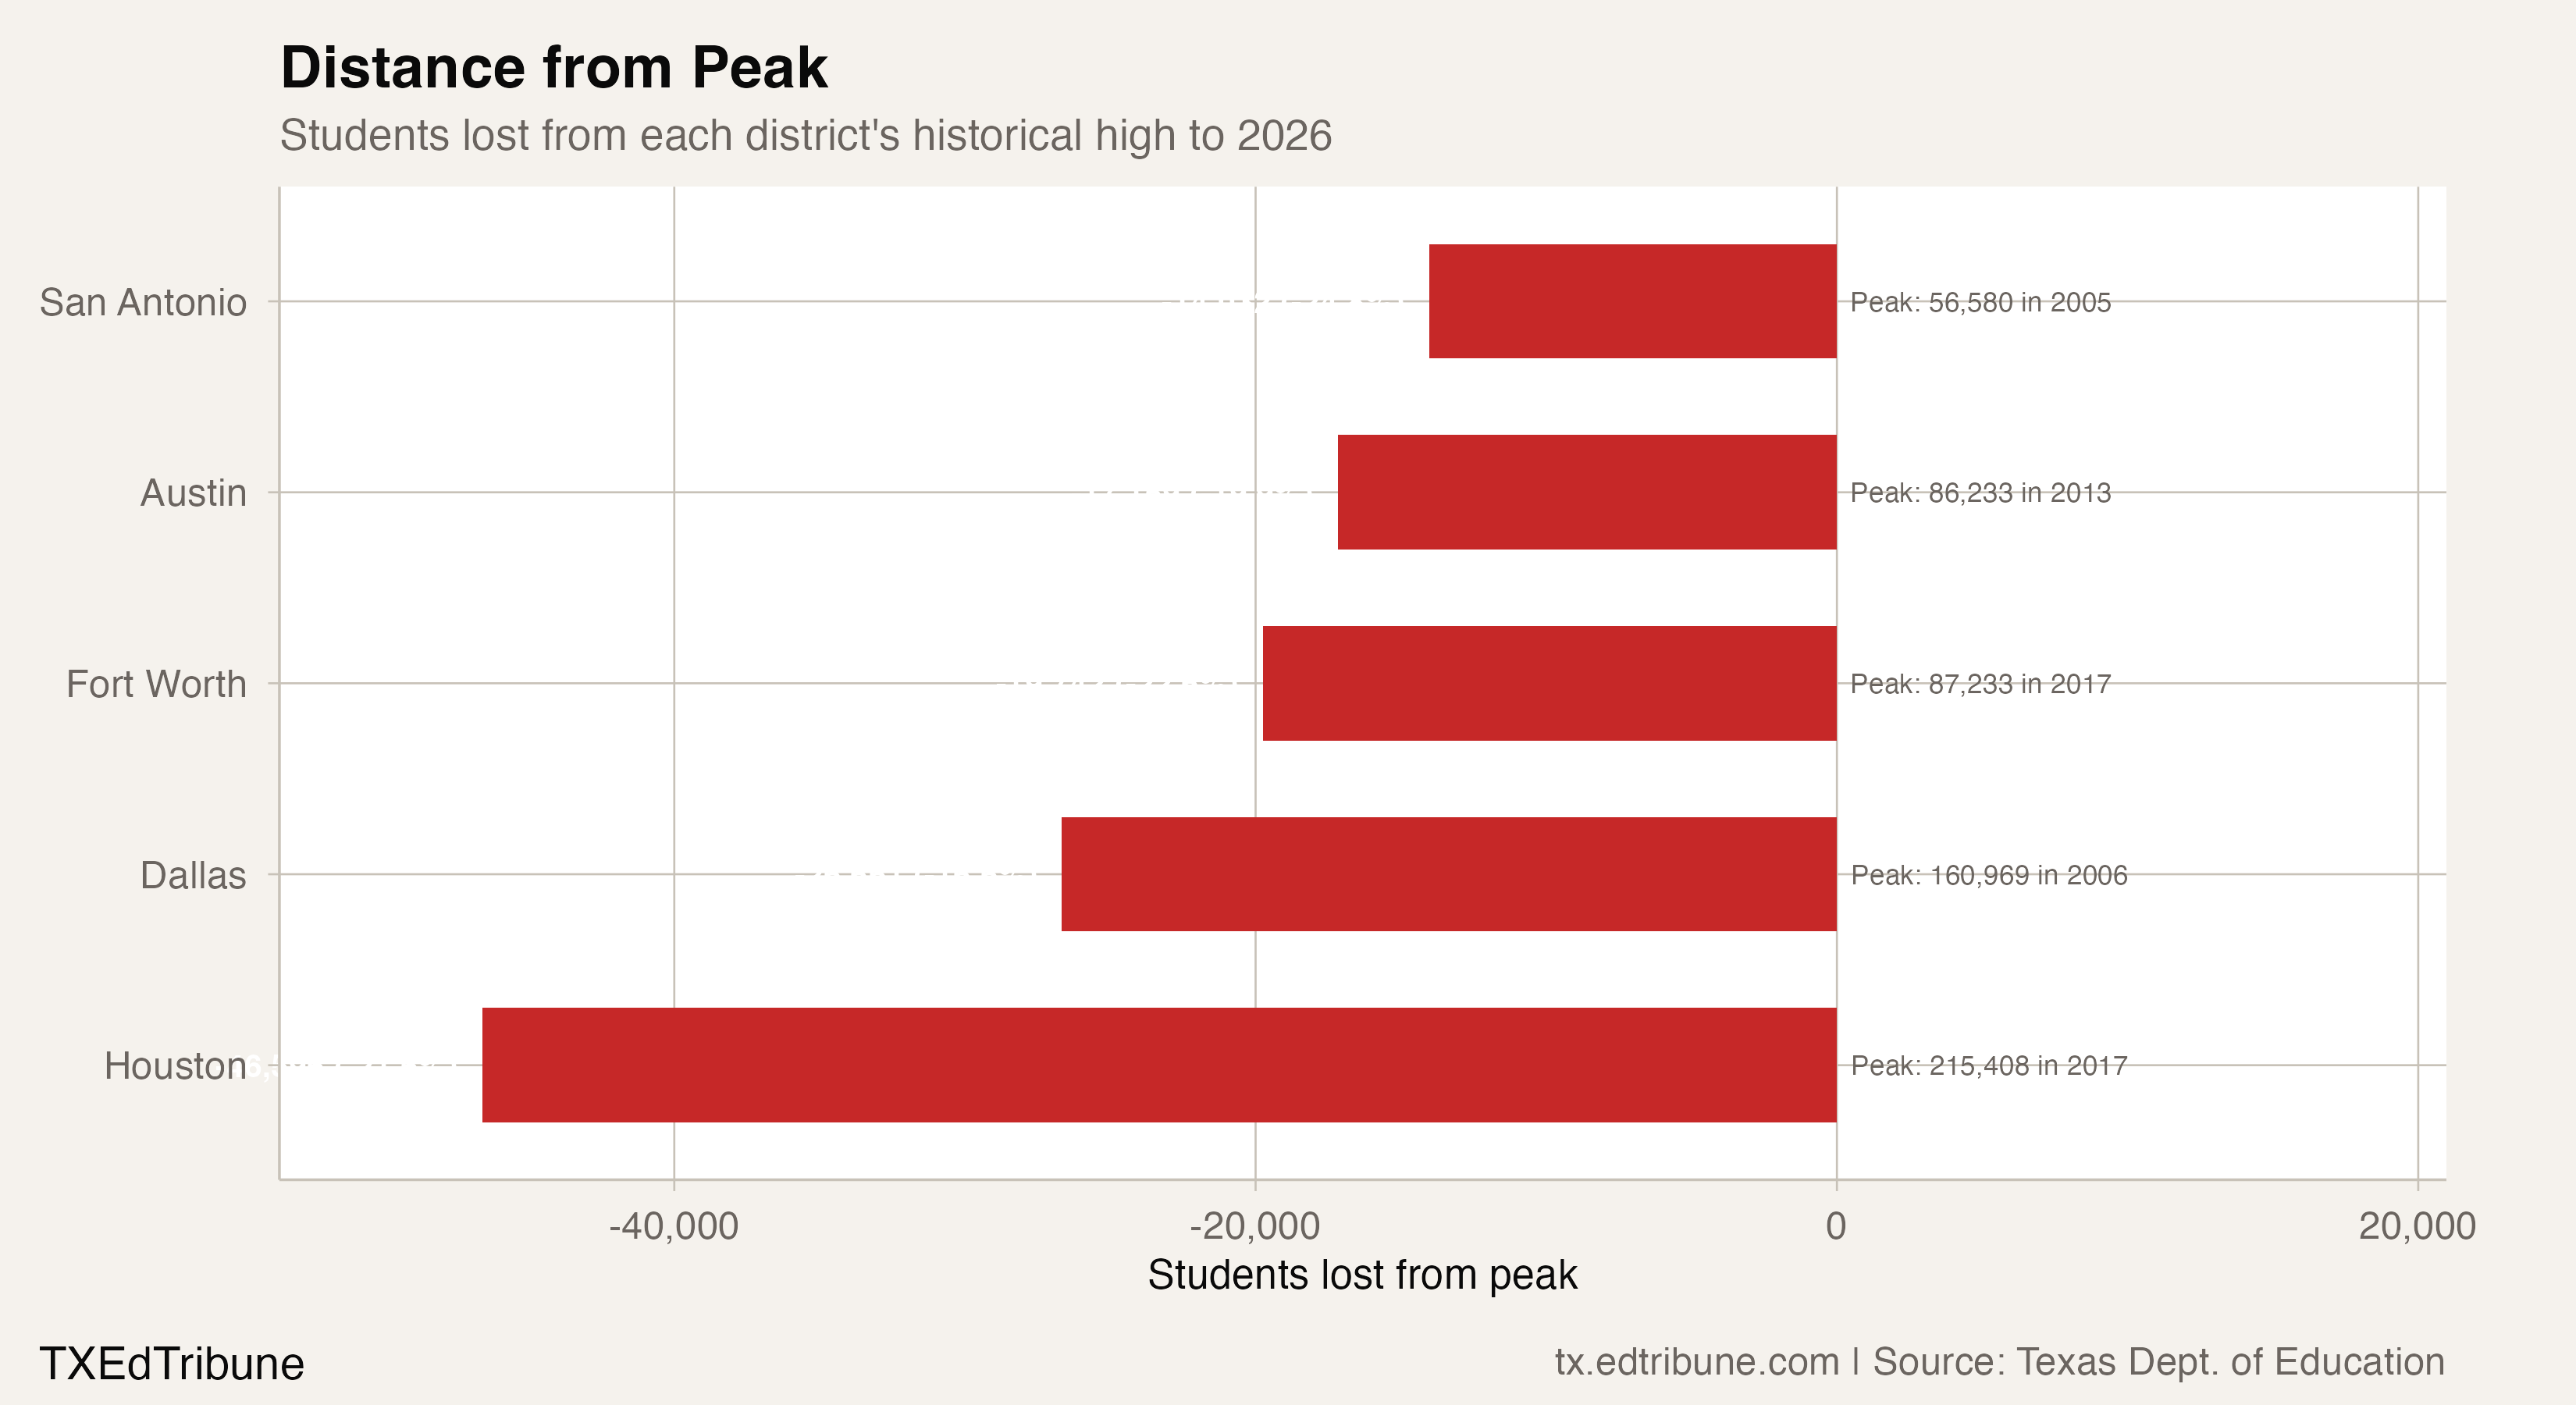
Houston ISD↗ET peaked at 215,408 students in 2016-17 within the historical window. Its 2024-25 count was 176,039, a loss of 39,369 from that high, or 18.3%. That latest historical count was also the district's lowest in the window.
The long-run decline was not uninterrupted. After its peak, Houston recorded seven annual decreases and one increase in this series. A falling endpoint does not establish that every intervening year fell.
Dallas ISD↗ET reached its historical peak earlier, at 160,969 students in 2005-06. It reported 139,776 in 2024-25, down 21,193 from the peak, or 13.2%. Its historical minimum was 139,096 in 2023-24. The later count was higher, so Dallas cannot be described as matching a historical low in the latest historical report.
Fort Worth ISD↗ET peaked at 87,233 in 2016-17 and reported 70,184 in 2024-25. That was 17,049 below its peak, or 19.5%, and matched its lowest historical count.
San Antonio ISD↗ET began the historical window with its highest observed total, 56,580. Its 2024-25 count was 44,011, a decline of 12,569, or 22.2%, from that high. It also matched its historical minimum.
Austin ISD↗ET peaked at 86,233 in 2012-13. Its latest historical count was 72,175, down 14,058 from the peak, or 16.3%. Austin's historical minimum was instead 71,883 in 2021-22. As with Dallas, a count below the peak is not evidence that the latest year was a record low.
The combined trajectory also needs a consistent window
The combined historical series starts with 582,060 students in 2004-05. Each annual combined total includes all five selected districts, with a finite published enrollment count for every member. It does not replace districts as their relative sizes change.
The combined total fell by 36,096 in 2020-21. The most recent annual change within the historical performance-report series was a decline of 8,791 in 2024-25. These are comparisons between consecutive years in the same historical reporting series.
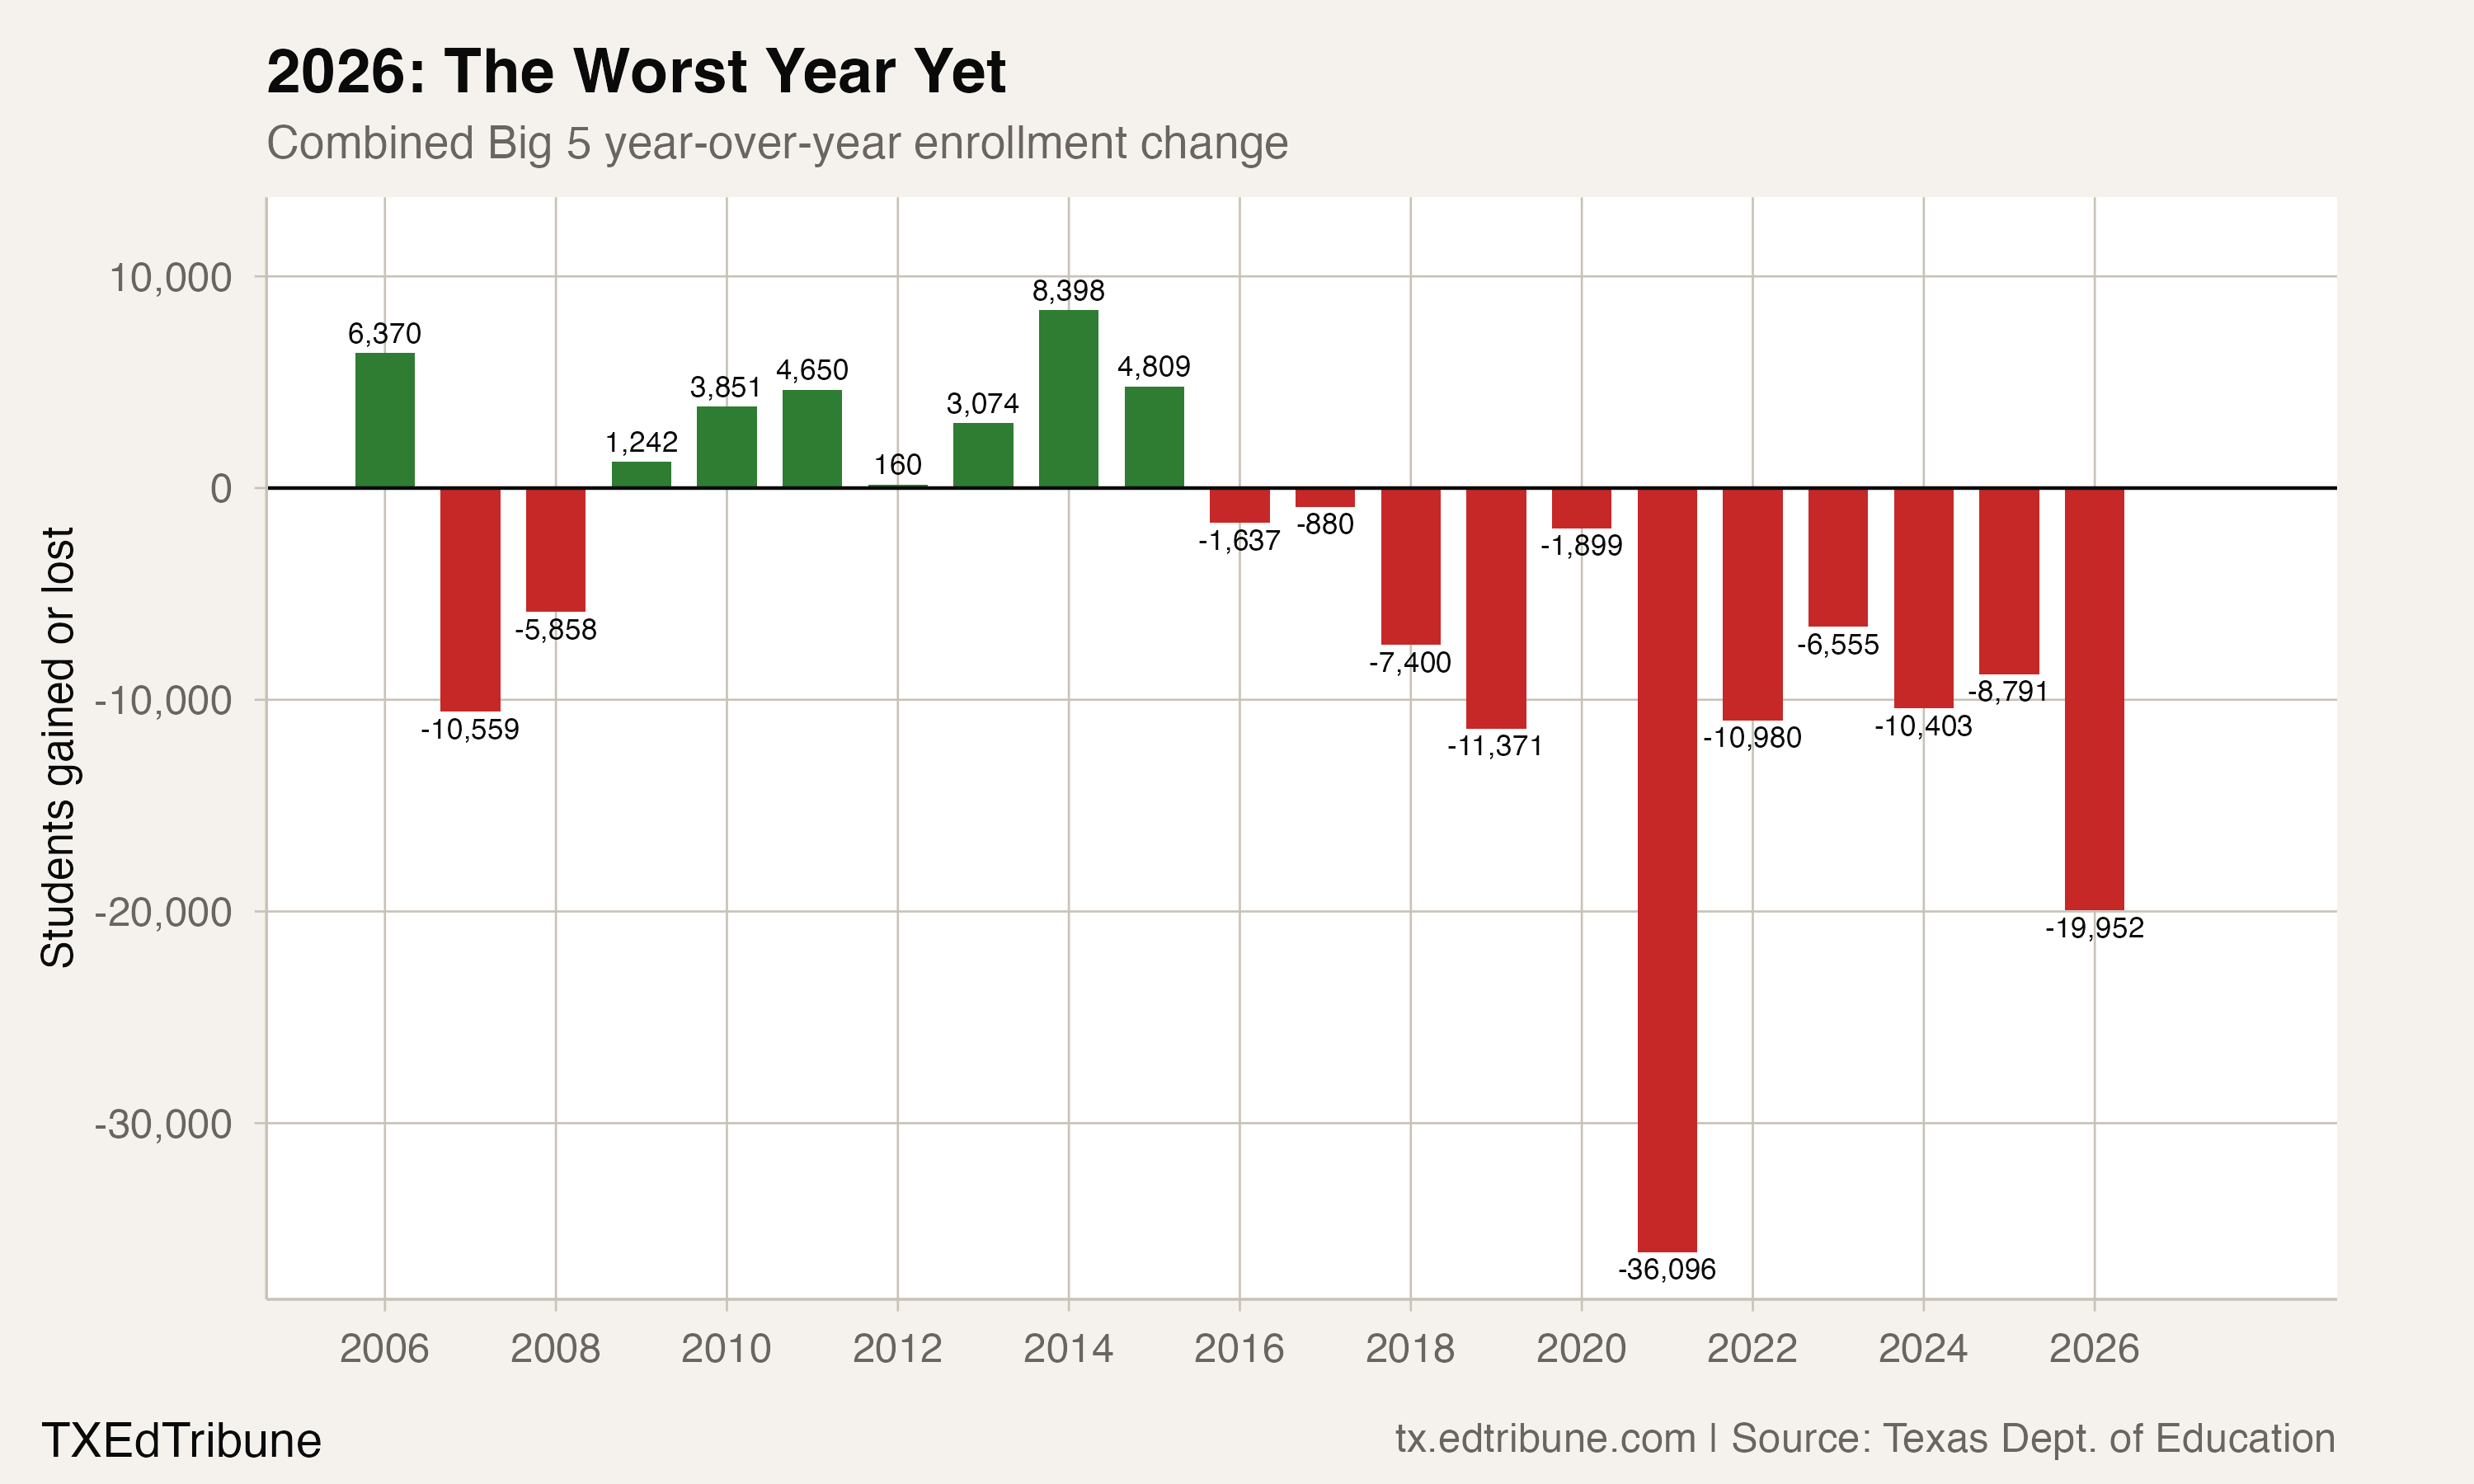
Those changes are not joined to the newer enrollment-report endpoint to rank a recent year against the entire history. A historical ranking would require a comparable series throughout its full comparison window.
The newer reports show a loss in every selected district
In the separate Student Enrollment Reports, the five districts together fell from 503,253 students in 2024-25 to 482,233 last school year, 2025-26. That was a decline of 21,020 students, or 4.2%, within the same report series.
Houston reported 168,812 in 2025-26, down 7,915 from that series' previous count, or 4.5%. Dallas reported 134,308, down 5,494, or 3.9%. Fort Worth reported 67,491, down 2,914, or 4.1%.
Austin's newer reported total was 69,074, a decline of 3,198, or 4.4%. San Antonio's was 42,548, down 1,499, or 3.4%. All five declined within this recent pair.
The newer reports and the historical performance reports have different overlapping-year totals. Their comparability has not been established here. The recent counts therefore describe a separate annual comparison; they do not extend the historical peak-to-endpoint losses or establish new historical minima.
A smaller share of the published state total
The state grew while the selected historical group ended below its starting enrollment. Texas's historical statewide total increased by 1,146,628 students, or 26.2%, between the first and last years of the available historical window.
The five districts' share of that published state total fell from 13.3% at the beginning of the window to 11.5% in 2014-15, then to 9.1% in 2024-25. Each share divides the same five districts' totals by the same year's published statewide enrollment total.
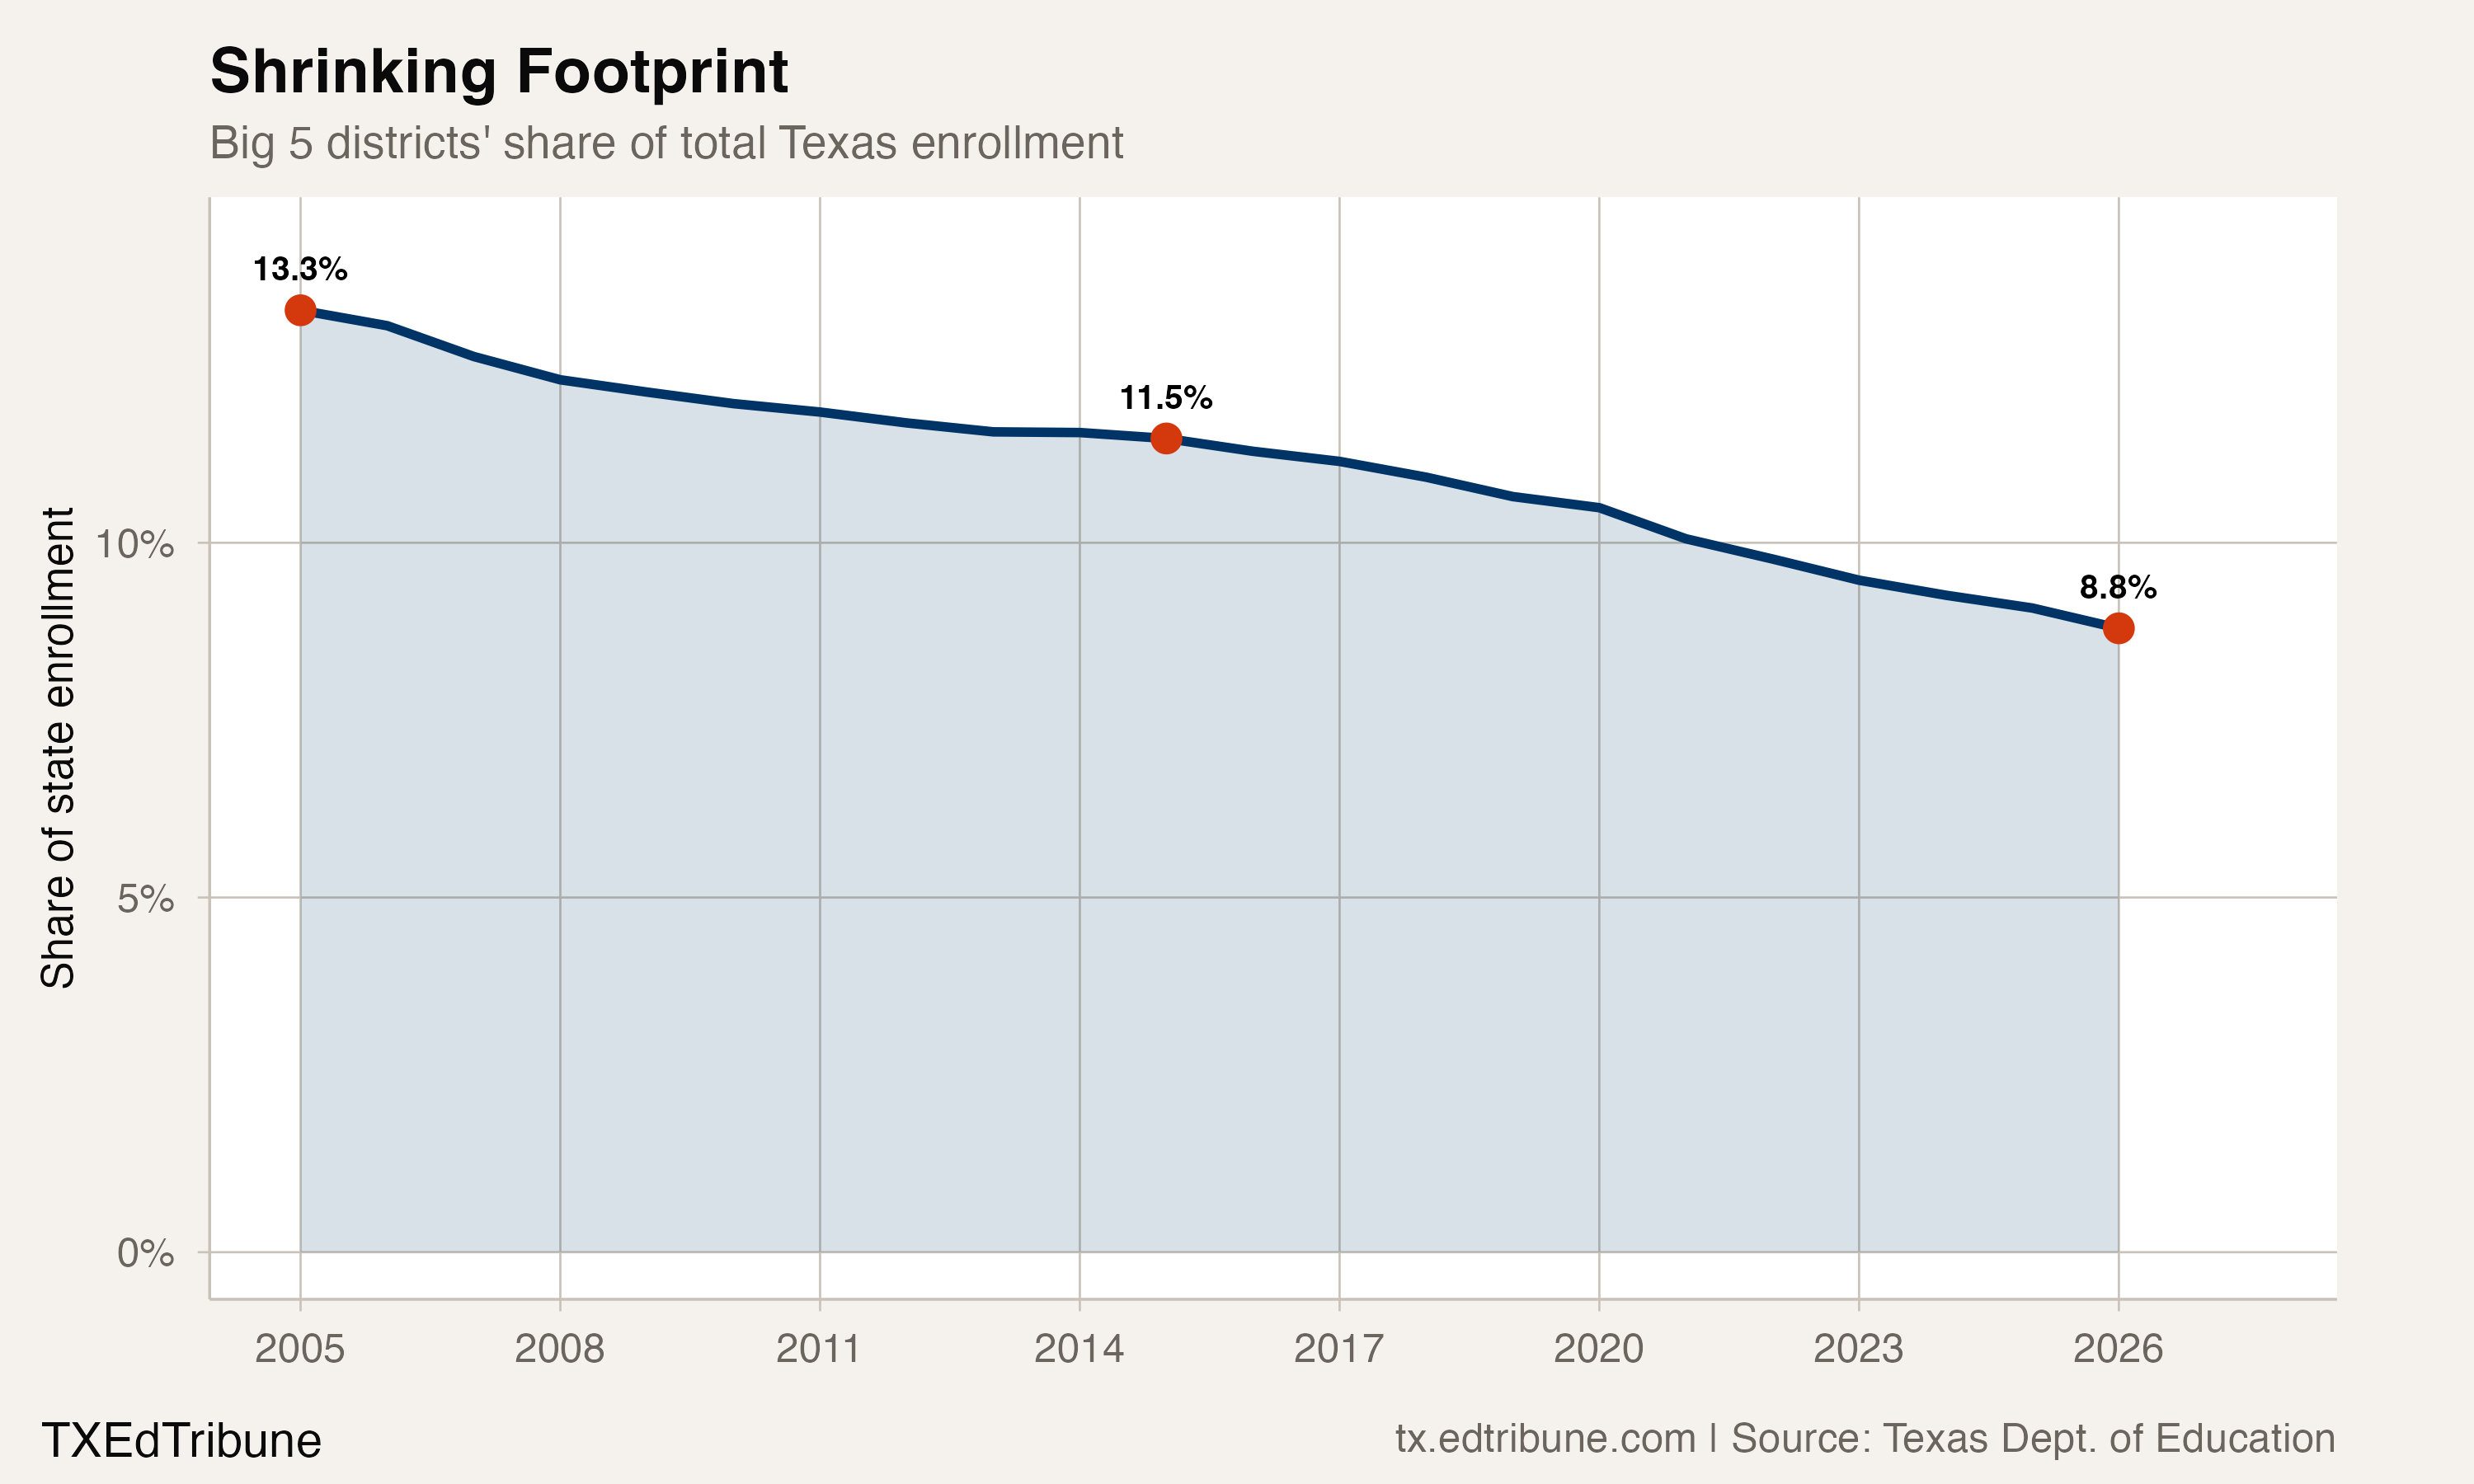
In the separate newer report, the five districts' 2025-26 total represented 8.8% of the published statewide total of 5,467,642. That share uses the newer report for both its district numerator and state denominator. It is not computed against a state total taken from the historical series.
A selected contrast does not trace where students went
A separately selected group—Katy, Frisco, Cypress-Fairbanks, Conroe and Northside ISDs—shows gains between the same historical endpoints. These are specific districts, rather than a complete classification of all suburban districts.
Katy added 51,707 students, Frisco 49,030, Cypress-Fairbanks 38,470, Conroe 32,070 and the San Antonio-area Northside district 25,716. The selected outer group together added 196,993, while the five city districts together lost 79,875 over the same historical endpoint comparison.
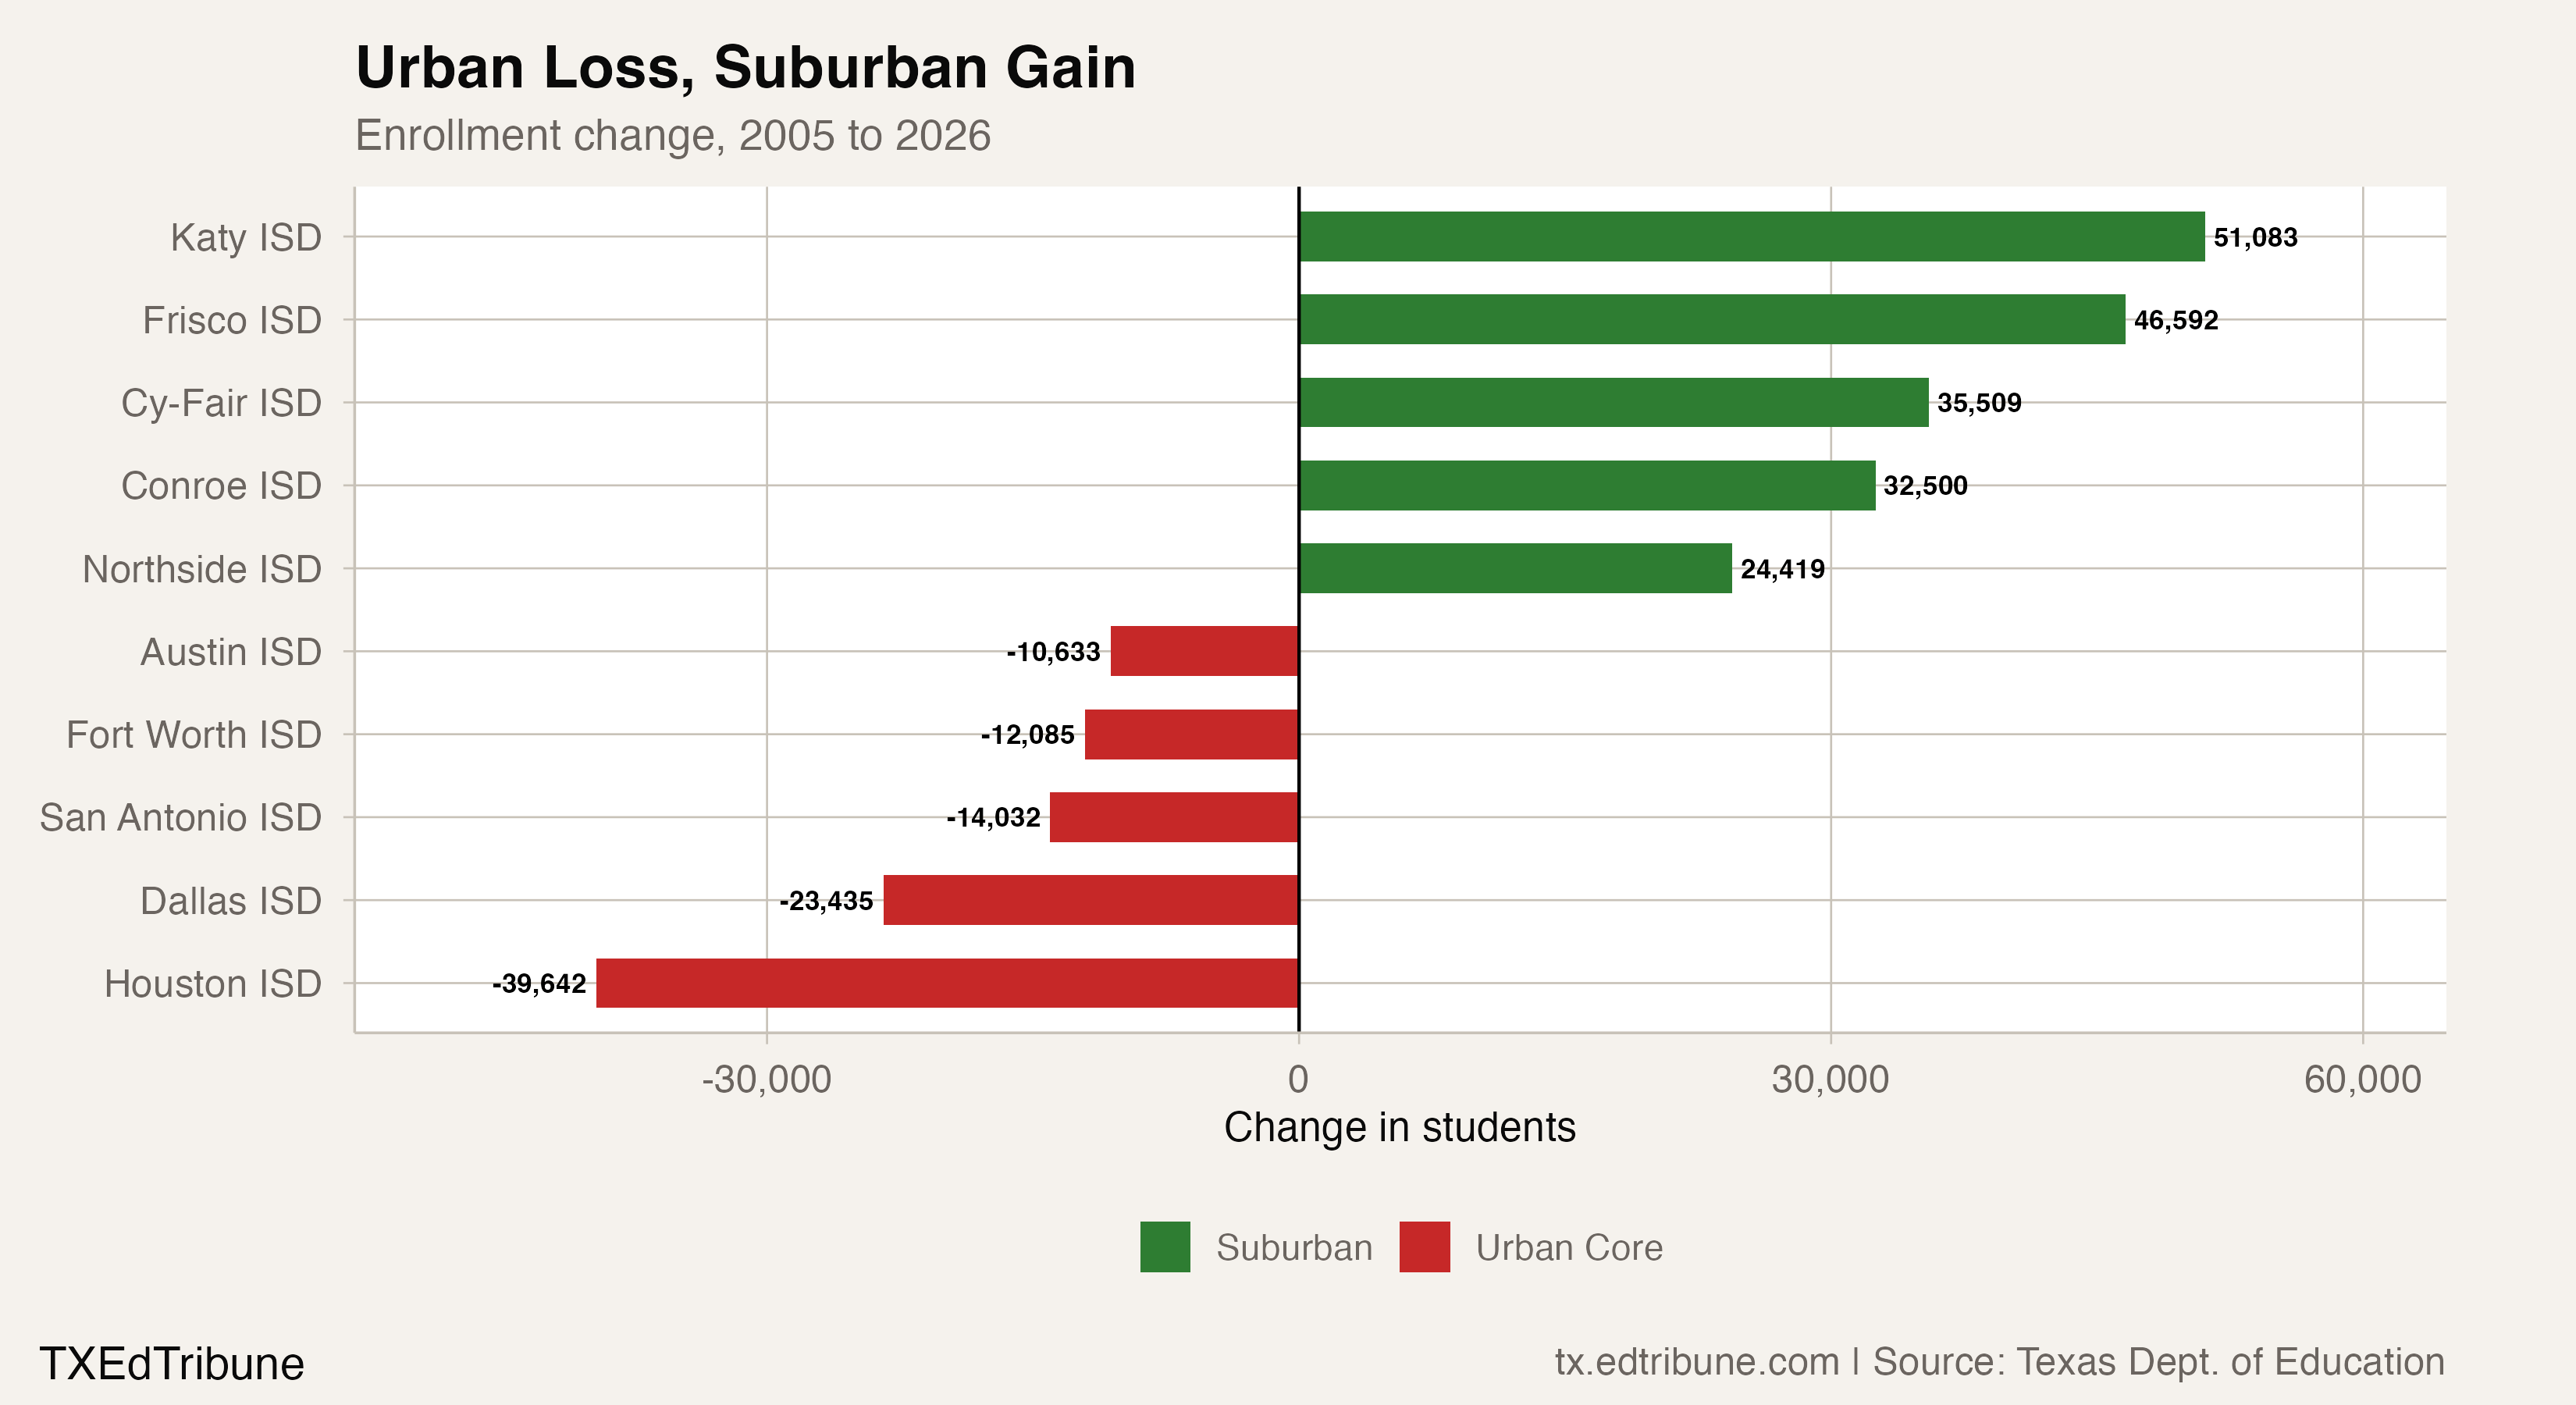
Both groups are matched by the state's district identifiers throughout the historical window. The Northside comparison uses the San Antonio-area district, rather than another district sharing the same name. Every endpoint is a finite published district total.
Opposite changes do not establish that the students lost from one group moved to the other. Enrollment totals do not trace those transfers or separate the effects of births, housing, migration, school choices and other factors. Those explanations require their own evidence.
What these reports do establish is that all five selected city districts were below their historical peaks, with different paths and different latest-year record statuses. The newer reports separately show losses in all five. Keeping those conclusions distinct preserves the genuine declines without giving them unsupported historical or causal meanings.
Source: Texas Education Agency annual performance reports and Student Enrollment Reports.
Detailed code that reproduces the analysis and figures in this article is available exclusively to EdTribune subscribers.
Discussion
Sign in to join the discussion.
Loading comments...