In this series: Texas 2025-26 Enrollment.
Correction (October 11, 2026): An earlier version of this article said Dallas had shed students faster than Houston since 2005. Houston's enrollment fell more, in both count and percentage; the difference in English learner share comes from Dallas's faster growth in students classified as English learners. The earlier version also described the ratio of English learners to Hispanic students as the share of Hispanic students learning English, called Dallas likely the largest majority-English-learner district in the nation, and called Fort Worth's increase the steepest among large districts. None of those claims is supported by the state's data, and they have been removed. The 2005 to 2025 shift is 19.7 percentage points, not 19.8. Staffing details that relied on a district web page no longer online have been replaced with the district's current published statements.
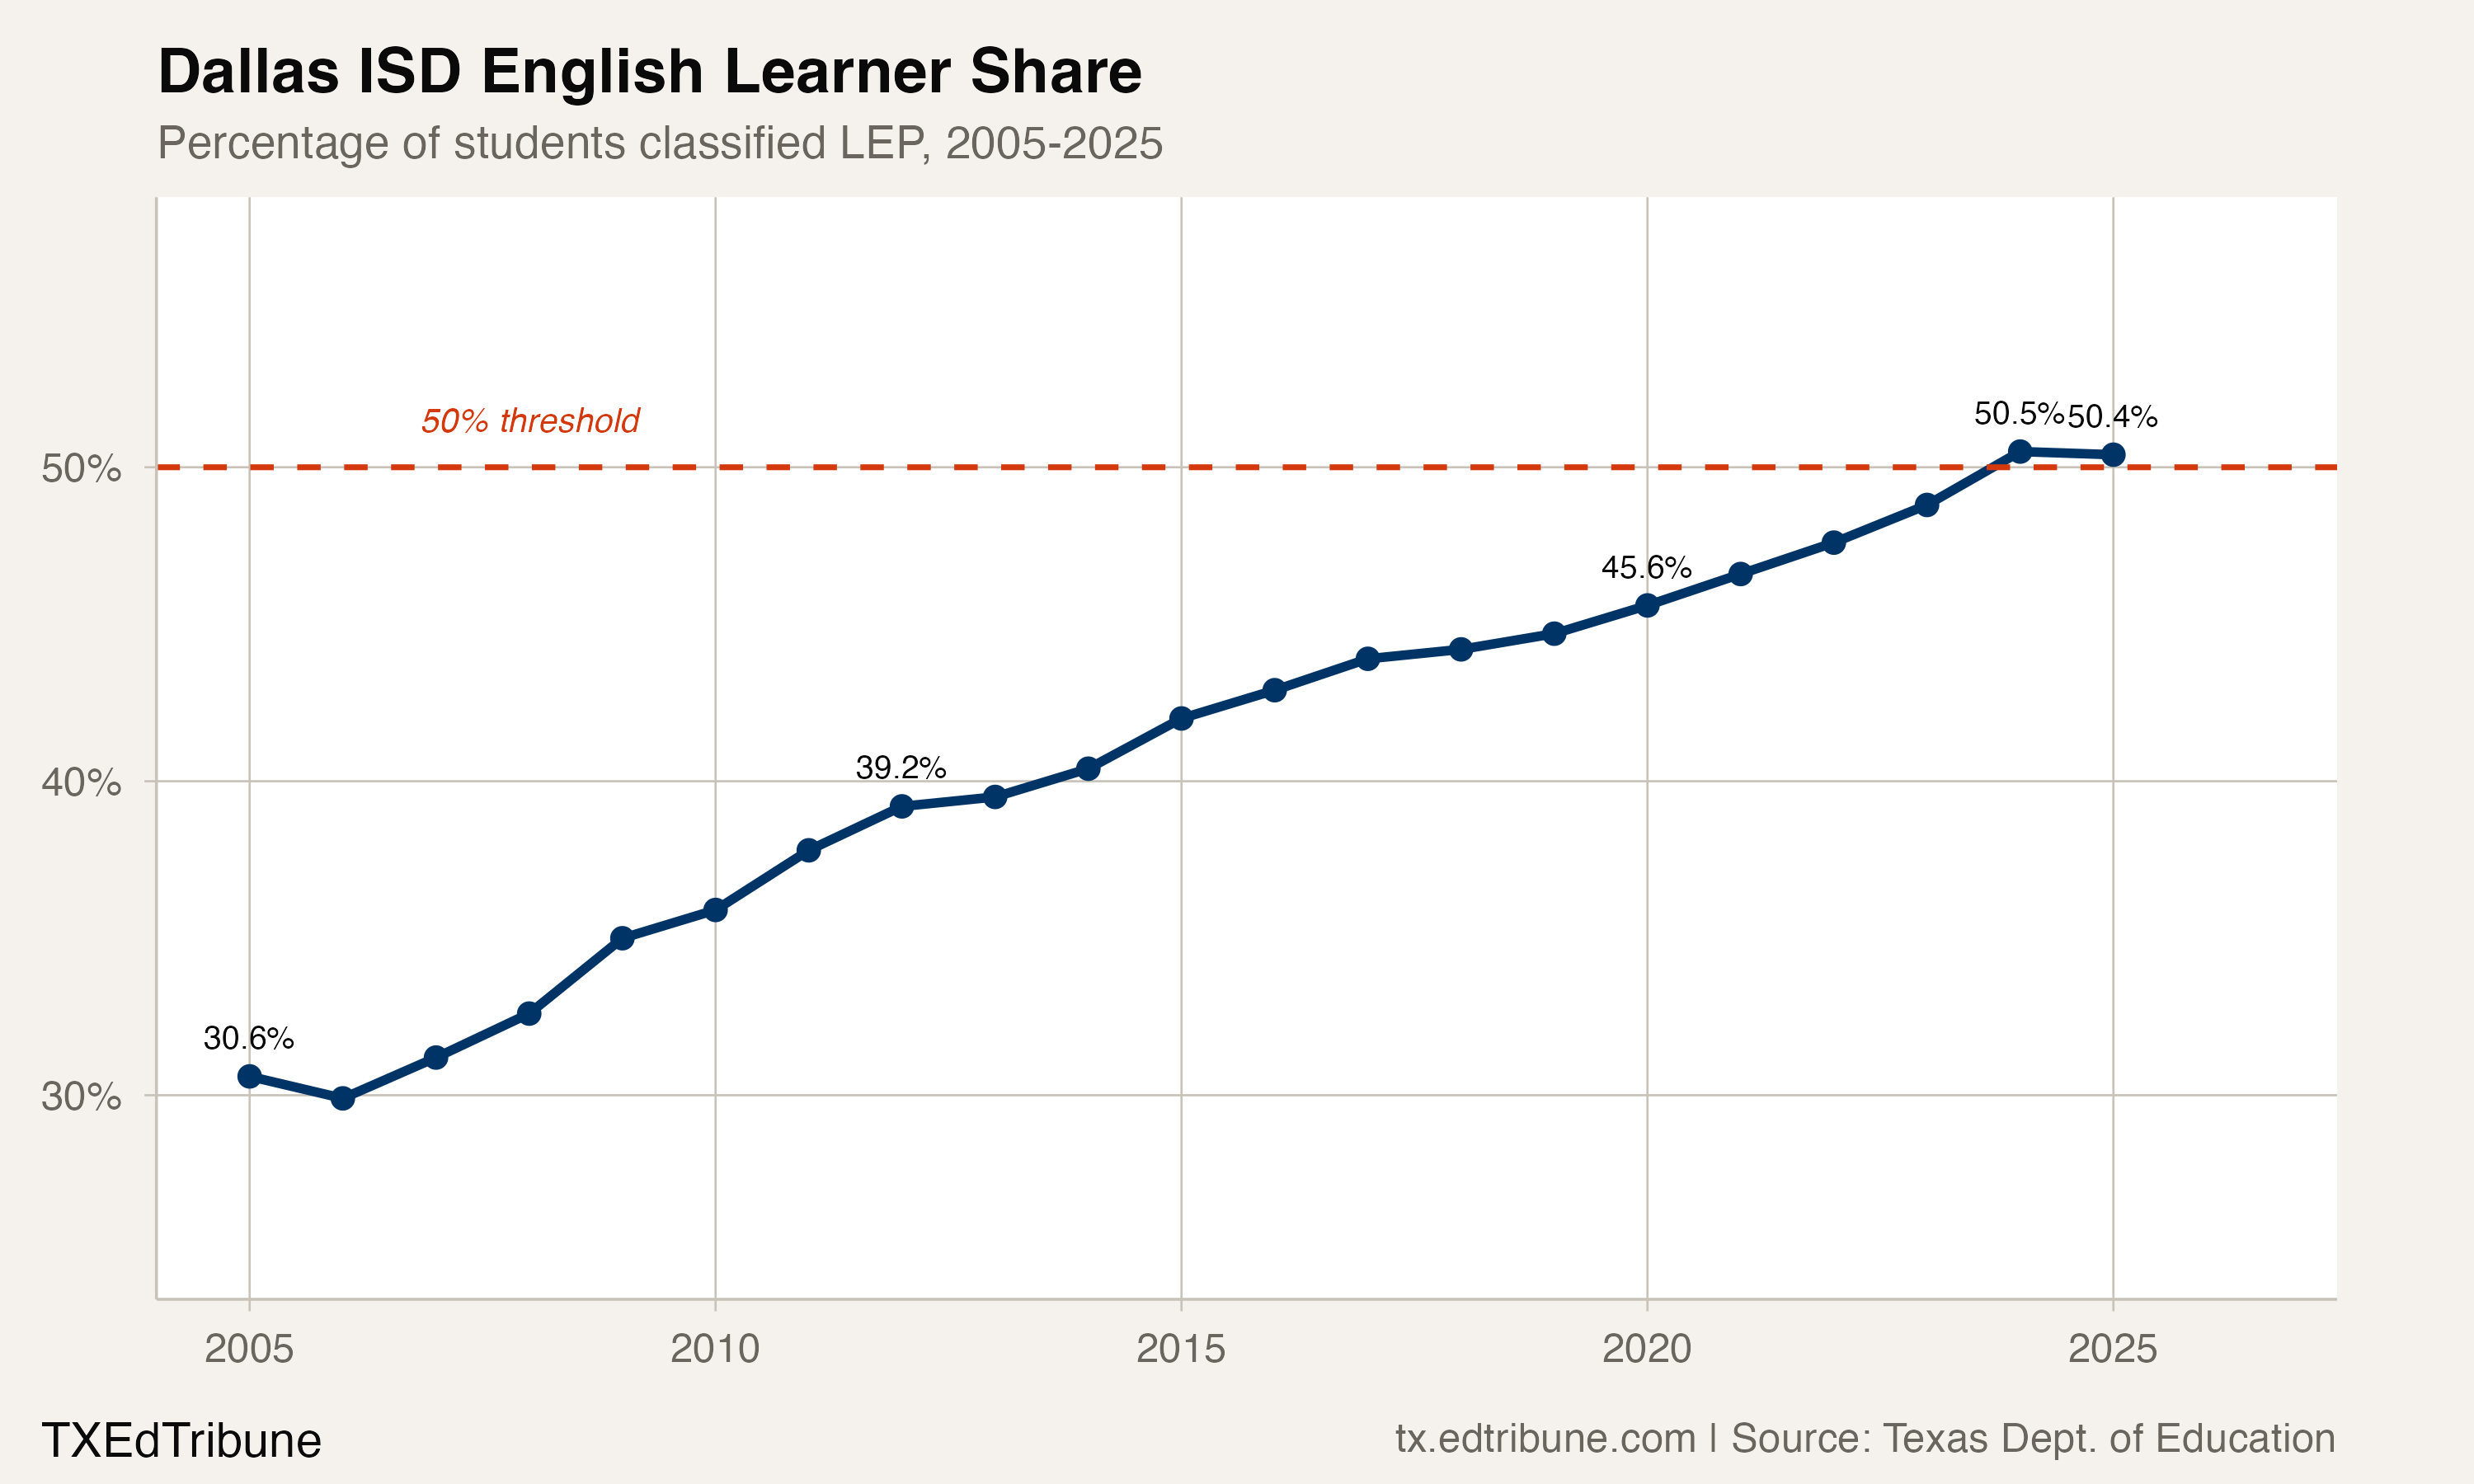
In 2004-05, fewer than one in three Dallas ISD↗ET students was classified as an English learner. Twenty years later, it is one in two. The district's LEP share hit 50.5% in 2023-24 and held at 50.4% in 2024-25, the most recent school year in the state's published data, with 70,422 of the district's 139,776 students learning English alongside every other subject. Dallas is the largest school district in Texas where students classified as English learners now constitute a majority.
The crossing was not abrupt. Dallas's LEP share rose in 18 of the 20 year-over-year transitions since 2004-05, dipping only in 2005-06 and 2024-25, from 30.6% in 2005 to 50.4% in 2025. The gradient is gradual enough that it barely registers as news in any single year. The cumulative result is a 19.7 percentage-point shift that has altered what instruction looks like in the state's second-largest district.
A statewide pattern with a Dallas concentration
Dallas is not alone. Fifty-four Texas districts had LEP-majority student bodies in 2024-25, up from 19 in 2004-05. Statewide, 1,345,031 students are classified as English learners, 24.3% of all enrollment. That is nearly double the 684,007 counted in 2005, a 96.6% increase over two decades. Non-LEP enrollment grew just 13.1% over the same period.
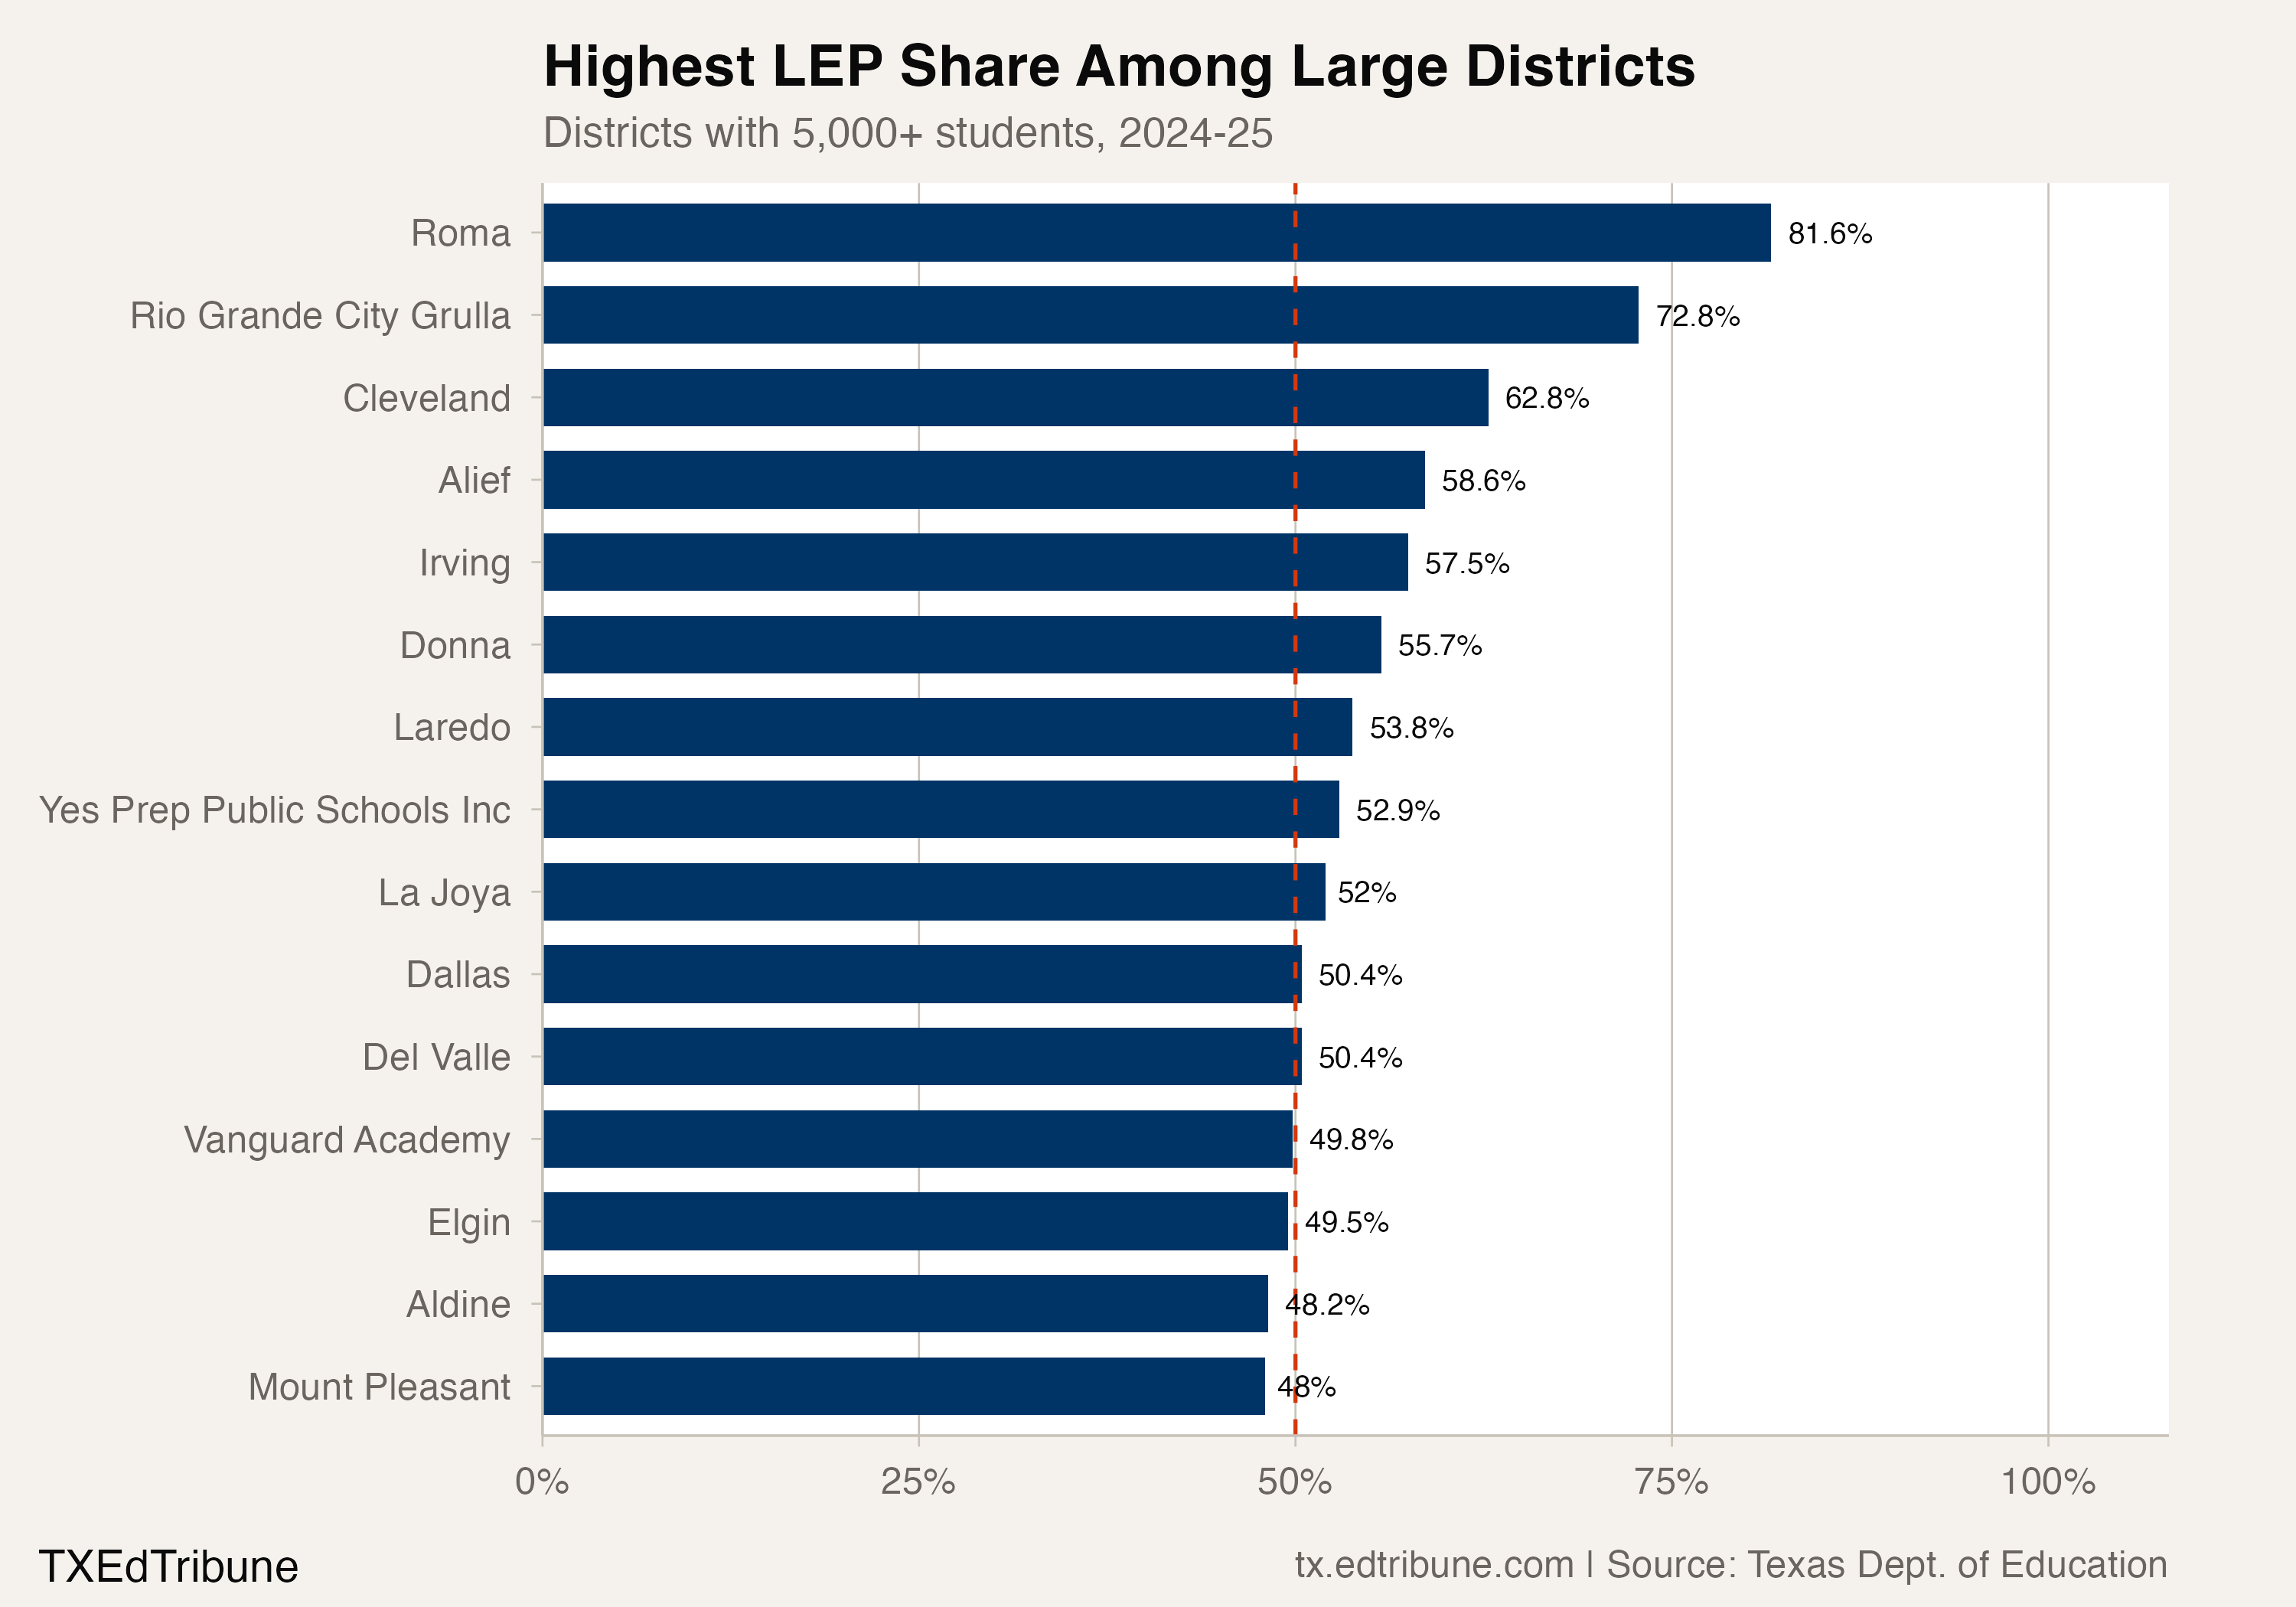
But Dallas stands out for scale. Among districts with at least 5,000 students, border-region districts like Roma ISD (81.6%) and Rio Grande City Grulla ISD (72.8%) have higher shares, but they serve fewer than 10,000 students each. Alief ISD↗ET (58.6%, 22,597 students) and Irving ISD↗ET (57.5%, 17,674 students) have higher shares among the big metro districts. Dallas's distinction is combining a majority LEP share with a total enrollment of nearly 140,000 students.
Houston ISD↗ET, the state's largest district at 176,039 students, has not followed the same trajectory. Houston's LEP share sits at 39.3%, with 69,145 students classified as English learners. In raw count, Houston and Dallas are nearly identical. The gap is in the size of the whole district and in how fast the English learner count has grown. Both districts have lost students since 2005: Houston fell from 208,454 to 176,039, a loss of 32,415, while Dallas fell from 157,743 to 139,776, a loss of 17,967. Over those same two decades, Houston's English learner count rose from 59,481 to 69,145, a 16.2% increase, while Dallas's rose from 48,331 to 70,422, a 45.7% increase. Dallas's share climbed faster because its English learner count grew faster, not because it shed more students.
The 2022-2023 acceleration
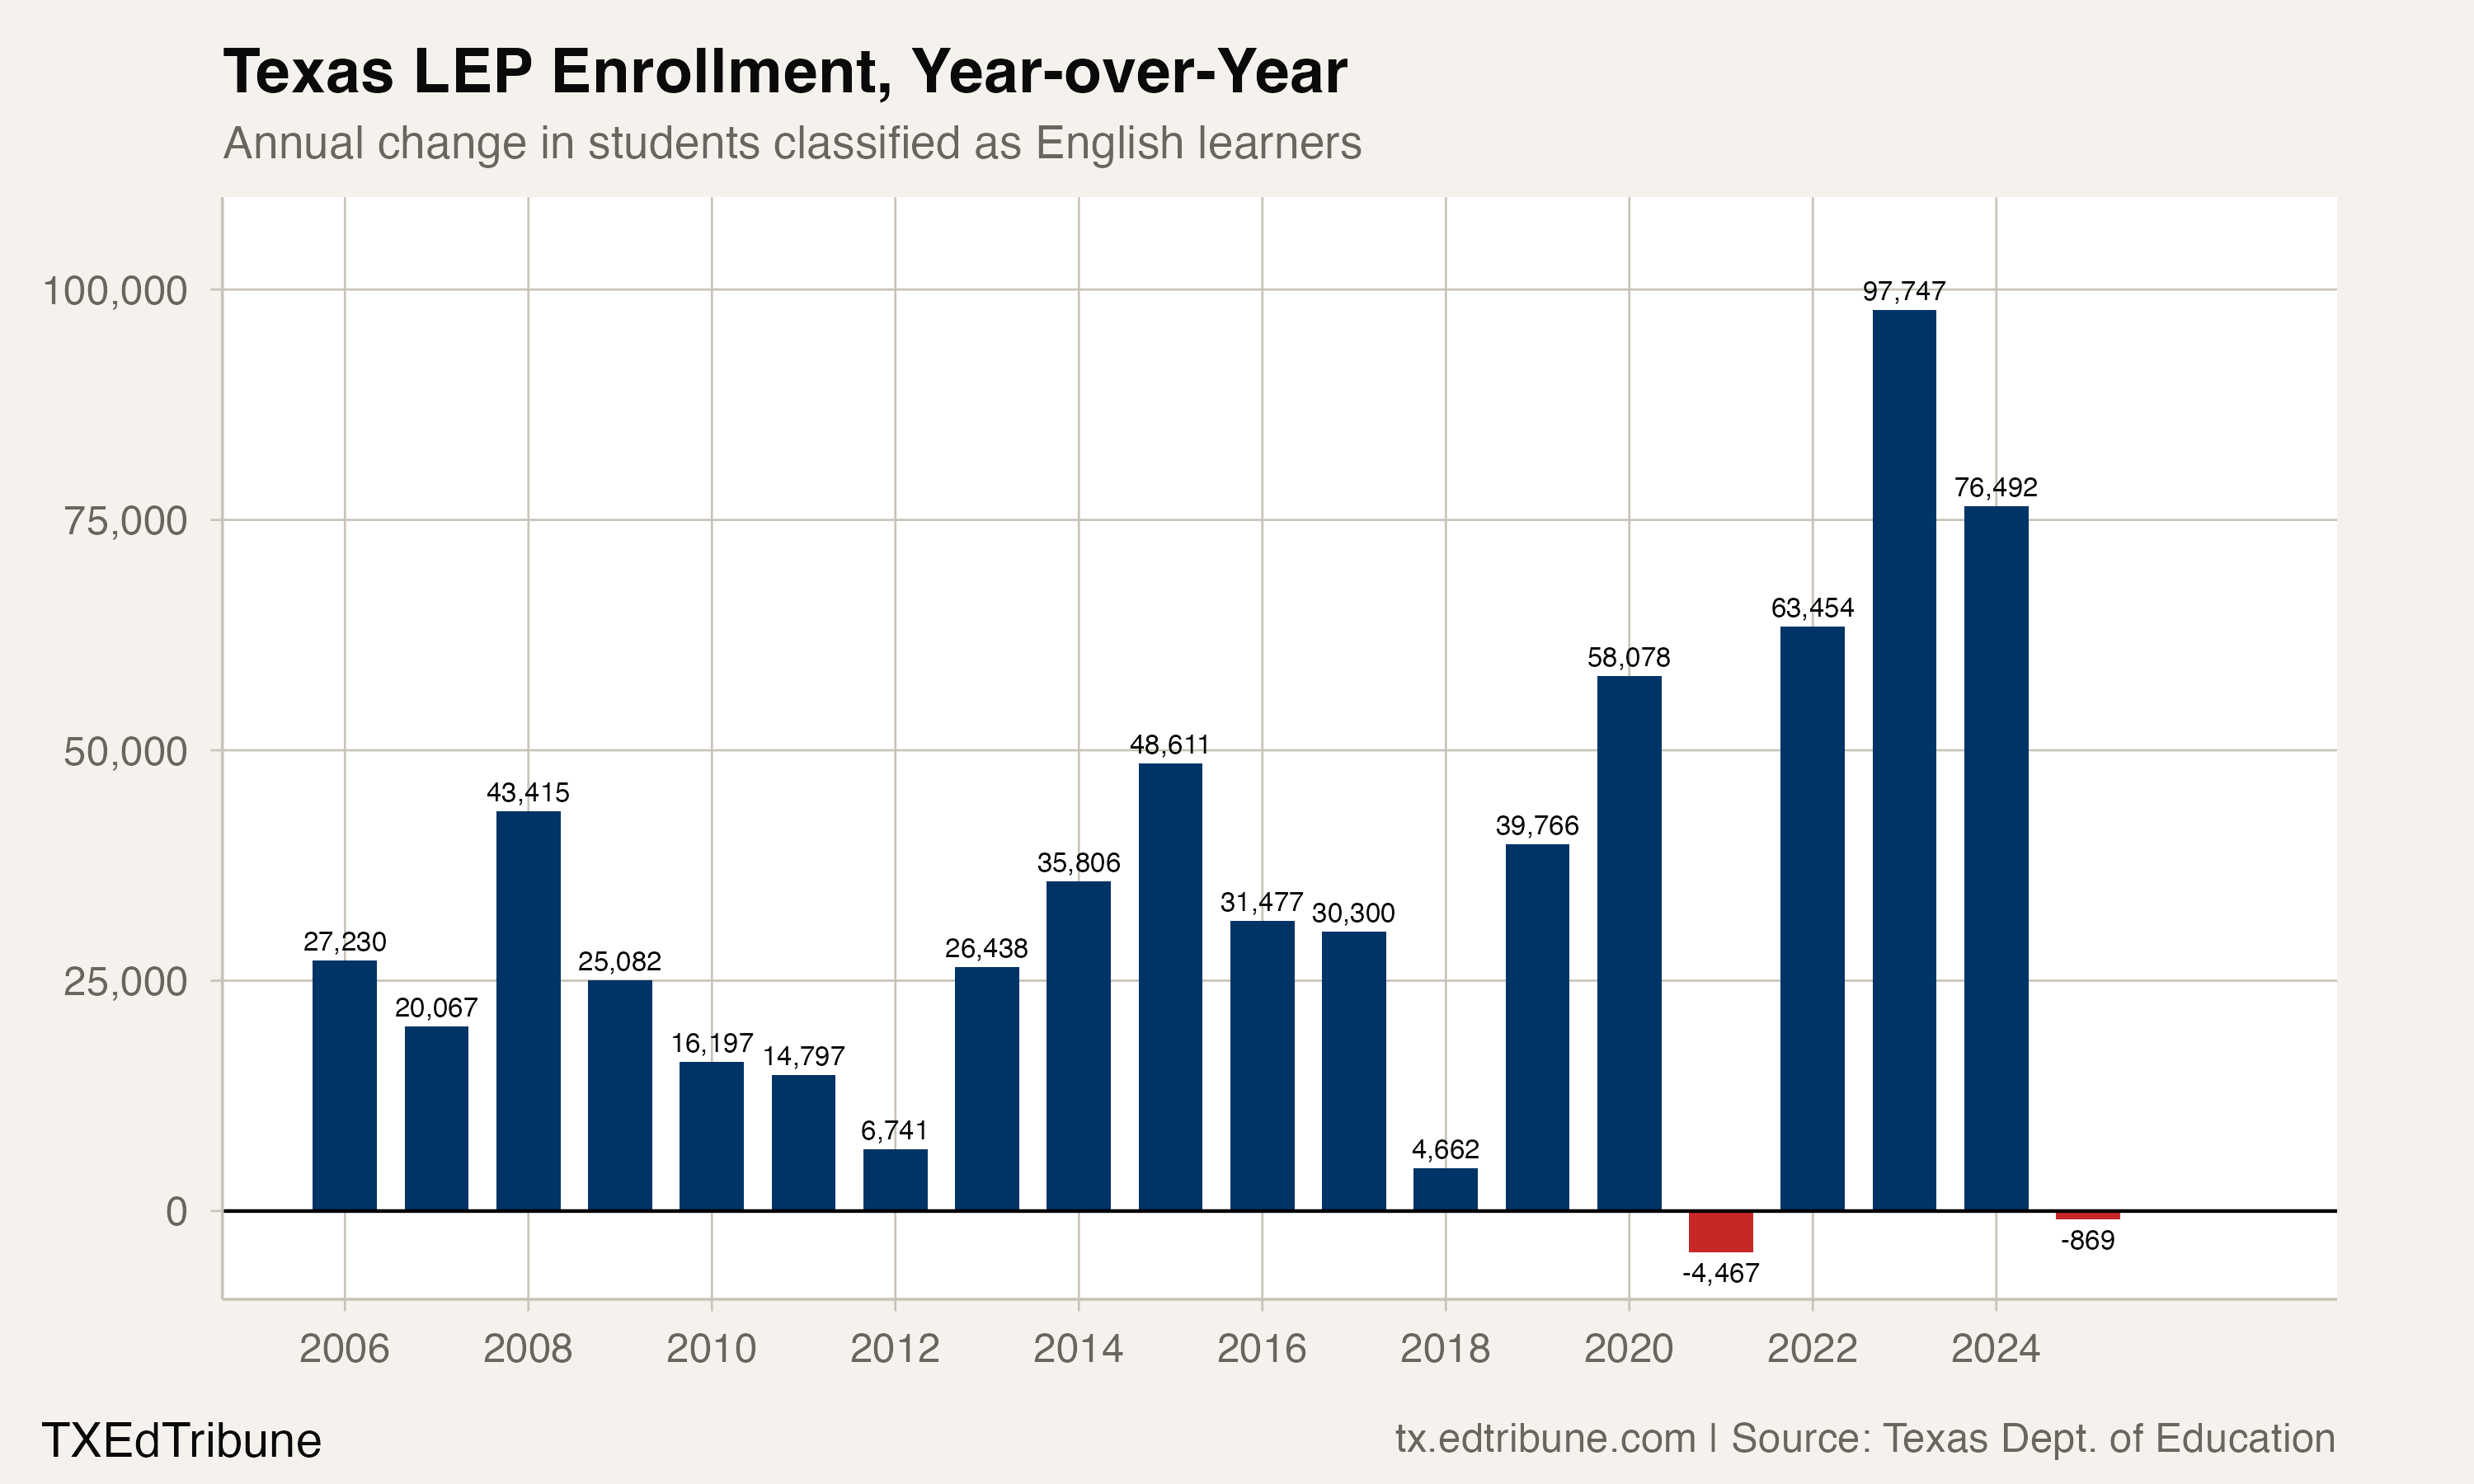
The statewide LEP surge is visible in year-over-year data. Texas added 97,747 English learners in a single year between 2022 and 2023, the largest annual increase on record. The largest prior single-year jump had been 63,454, in 2022. Enrollment counts record the increase; they do not say how much of it came from new arrivals and how much from changes in how existing students are identified.
One documented change falls in that window. In August 2023, the Texas Education Agency adopted revisions to the rules governing emergent bilingual student identification and reclassification. The changes to 19 TAC Chapter 89, Subchapter BB updated the home language survey and the criteria Language Proficiency Assessment Committees (LPACs) use when deciding which students qualify for services and when they can exit, effective August 9, 2023. The same letter notes that some 2022-23 reclassification decisions were held open into the fall of 2023-24 pending assessment scores, which could keep some students classified as emergent bilingual longer than in a typical year.
Disentangling reclassification effects from actual new arrivals is difficult with enrollment data alone. Some of the growth reflects new immigration. Some reflects evolving identification practices. The data cannot separate the two.
Across the metroplex, every direction points up
Fort Worth ISD↗ET climbed from 28.0% LEP in 2012 to 42.2% in 2025, a 14.2 percentage-point increase in 13 years. Aldine ISD↗ET in north Houston reached 48.2% in 2025.
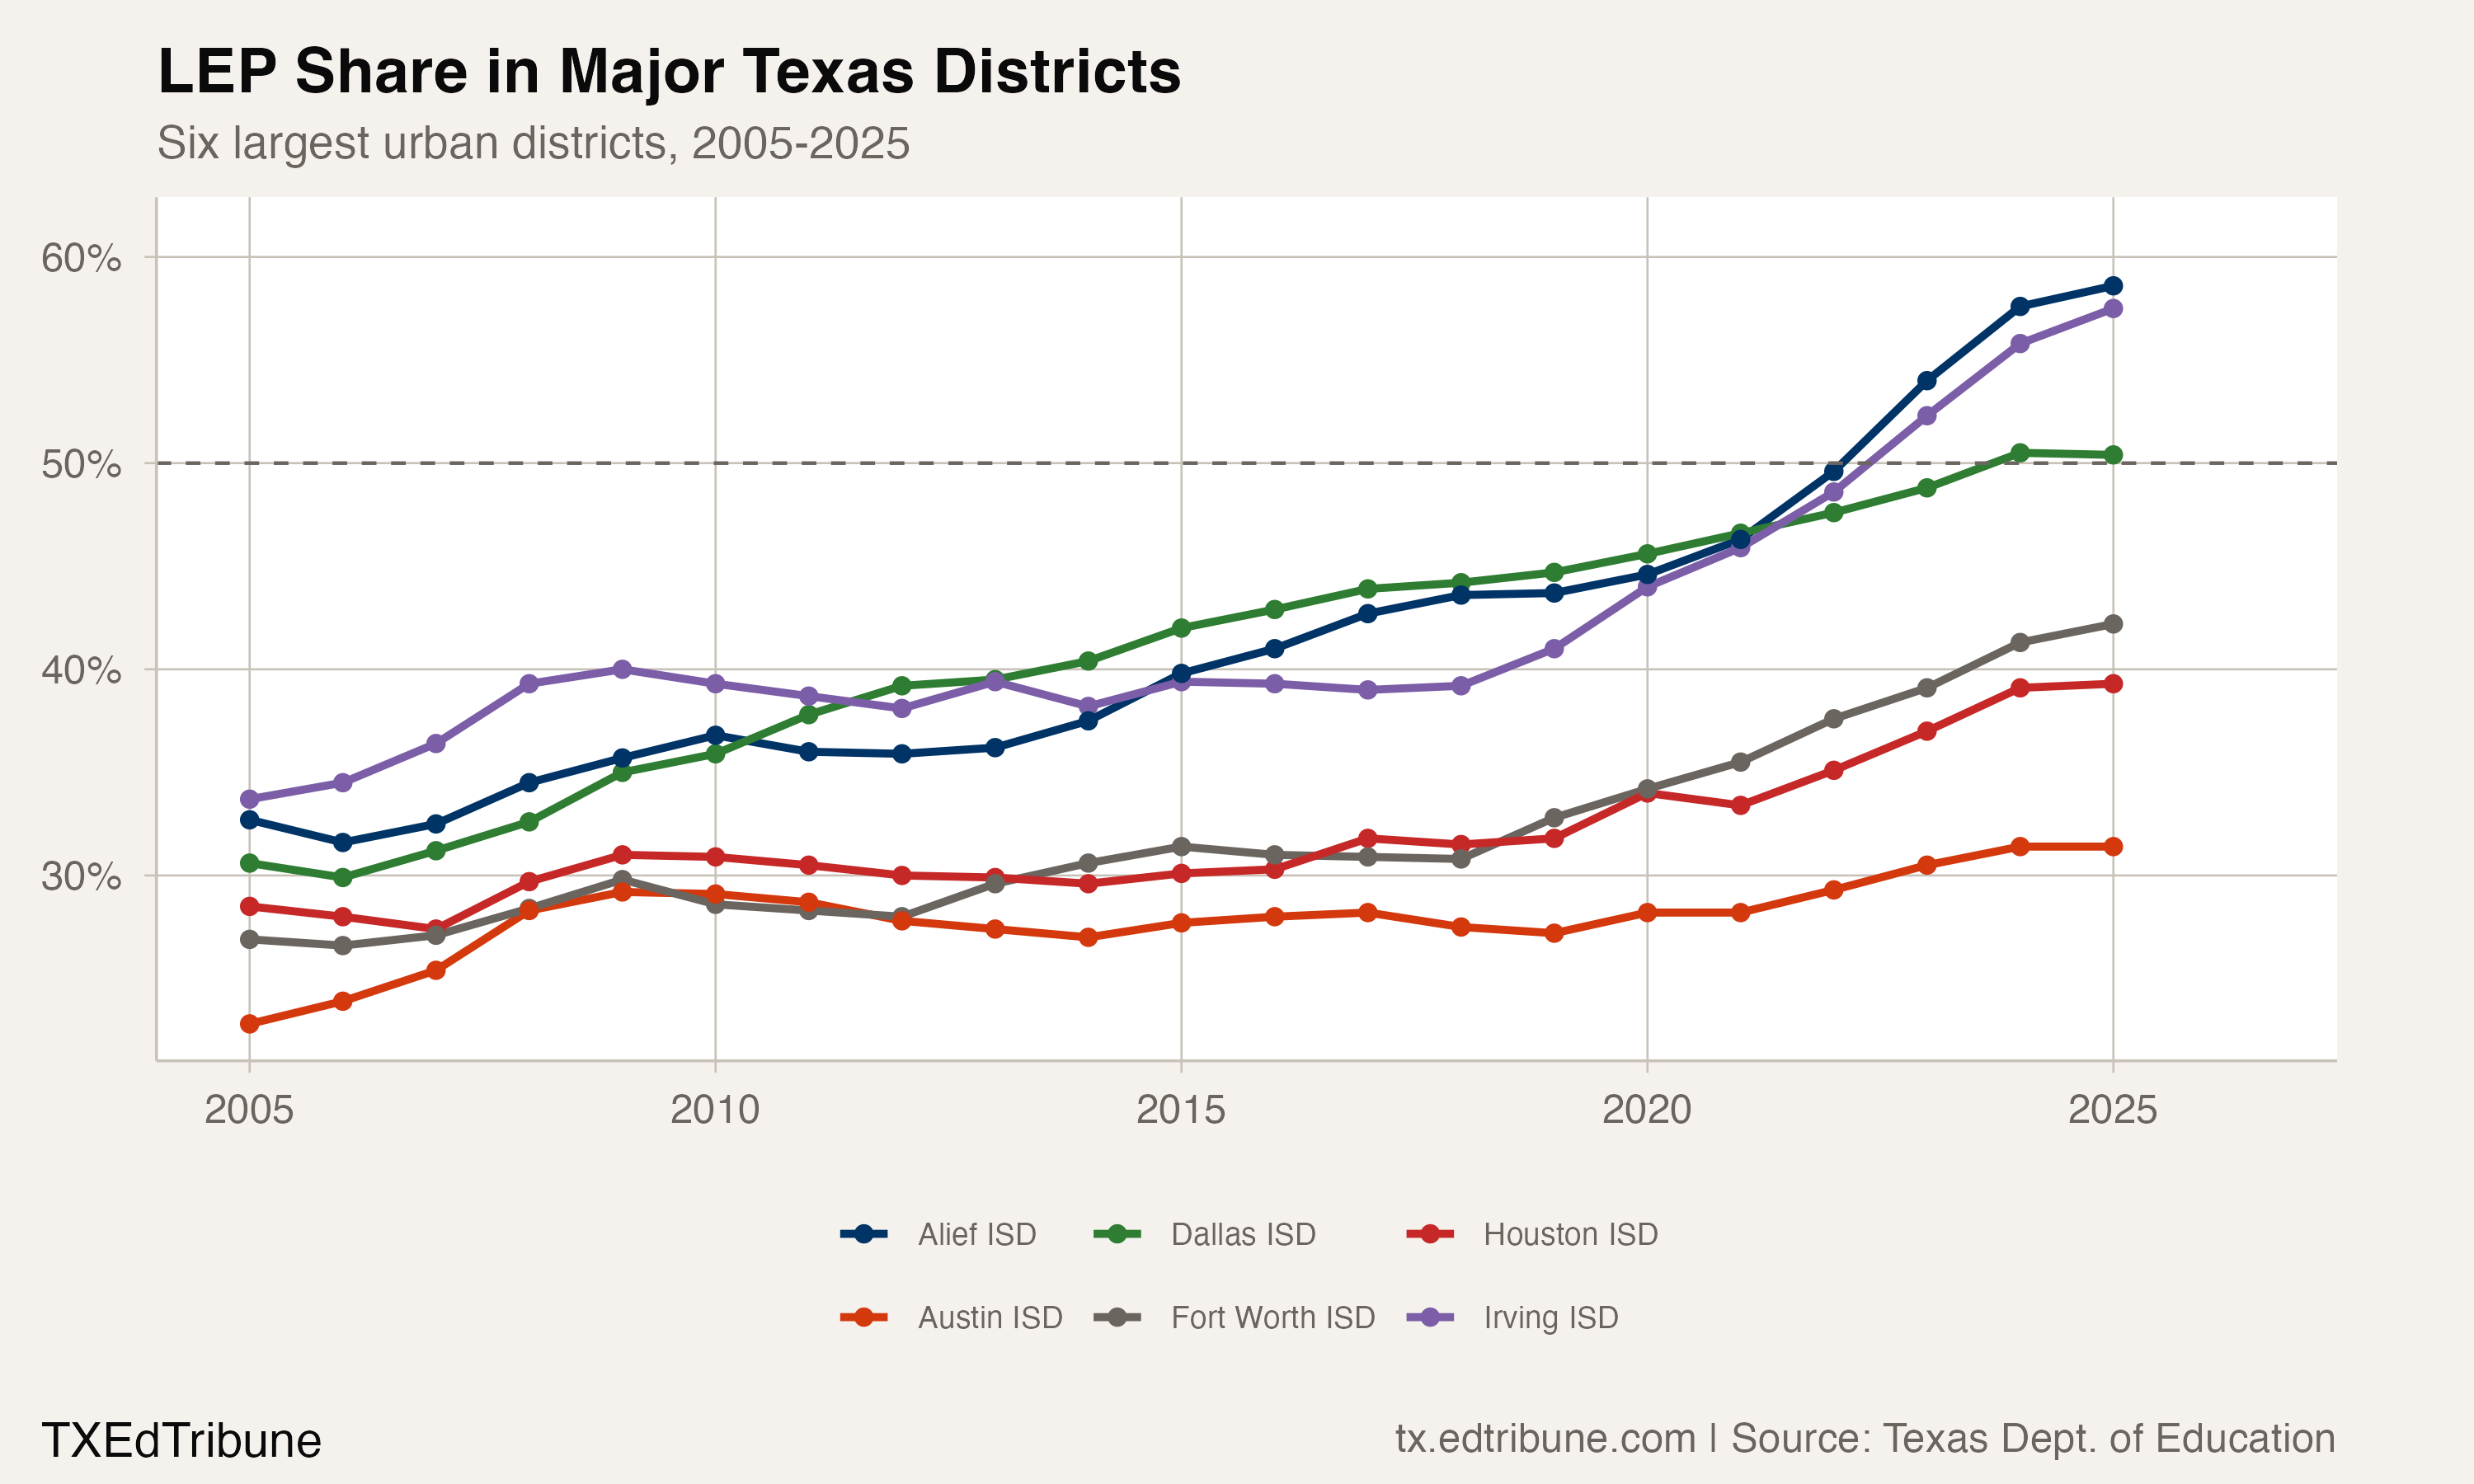
Alief and Irving both crossed the 50% threshold a year before Dallas. Alief reached 54.0% in 2023 and Irving hit 52.3% the same year. Both are mid-sized districts in the Houston and DFW metro areas, respectively. Their trajectories put Dallas's crossing inside a broader pattern among urban Texas districts rather than marking it as an anomaly specific to one district.
The staffing equation
Dallas ISD's bilingual and ESL department describes its students as coming from more than 90 countries and speaking over 120 languages, and says the district has offered a free dual language program at every campus for more than 20 years. To fill bilingual teaching positions, the district has recruited educators through partnerships with Spain, Mexico, Puerto Rico and other countries, according to the Texas Early Childhood English Learner Initiative, which calls hiring and retaining bilingual educators a significant challenge.
The same initiative reports that 49% of Dallas ISD's pre-K through third-grade students were English learners in 2019-20, above both the Dallas County figure of 40% and the statewide figure of 27%. The youngest grades, by that count, were already at roughly the share the district as a whole reached five years later.
Two enrollment trajectories, one state
The divergence between LEP and non-LEP enrollment growth in Texas is the sharpest pattern in the state's data. Since 2005, LEP enrollment has nearly doubled while non-LEP enrollment has grown just 13.1%. The two lines, indexed to 2005, separated most sharply in 2023 and 2024 and held their gap in 2025.
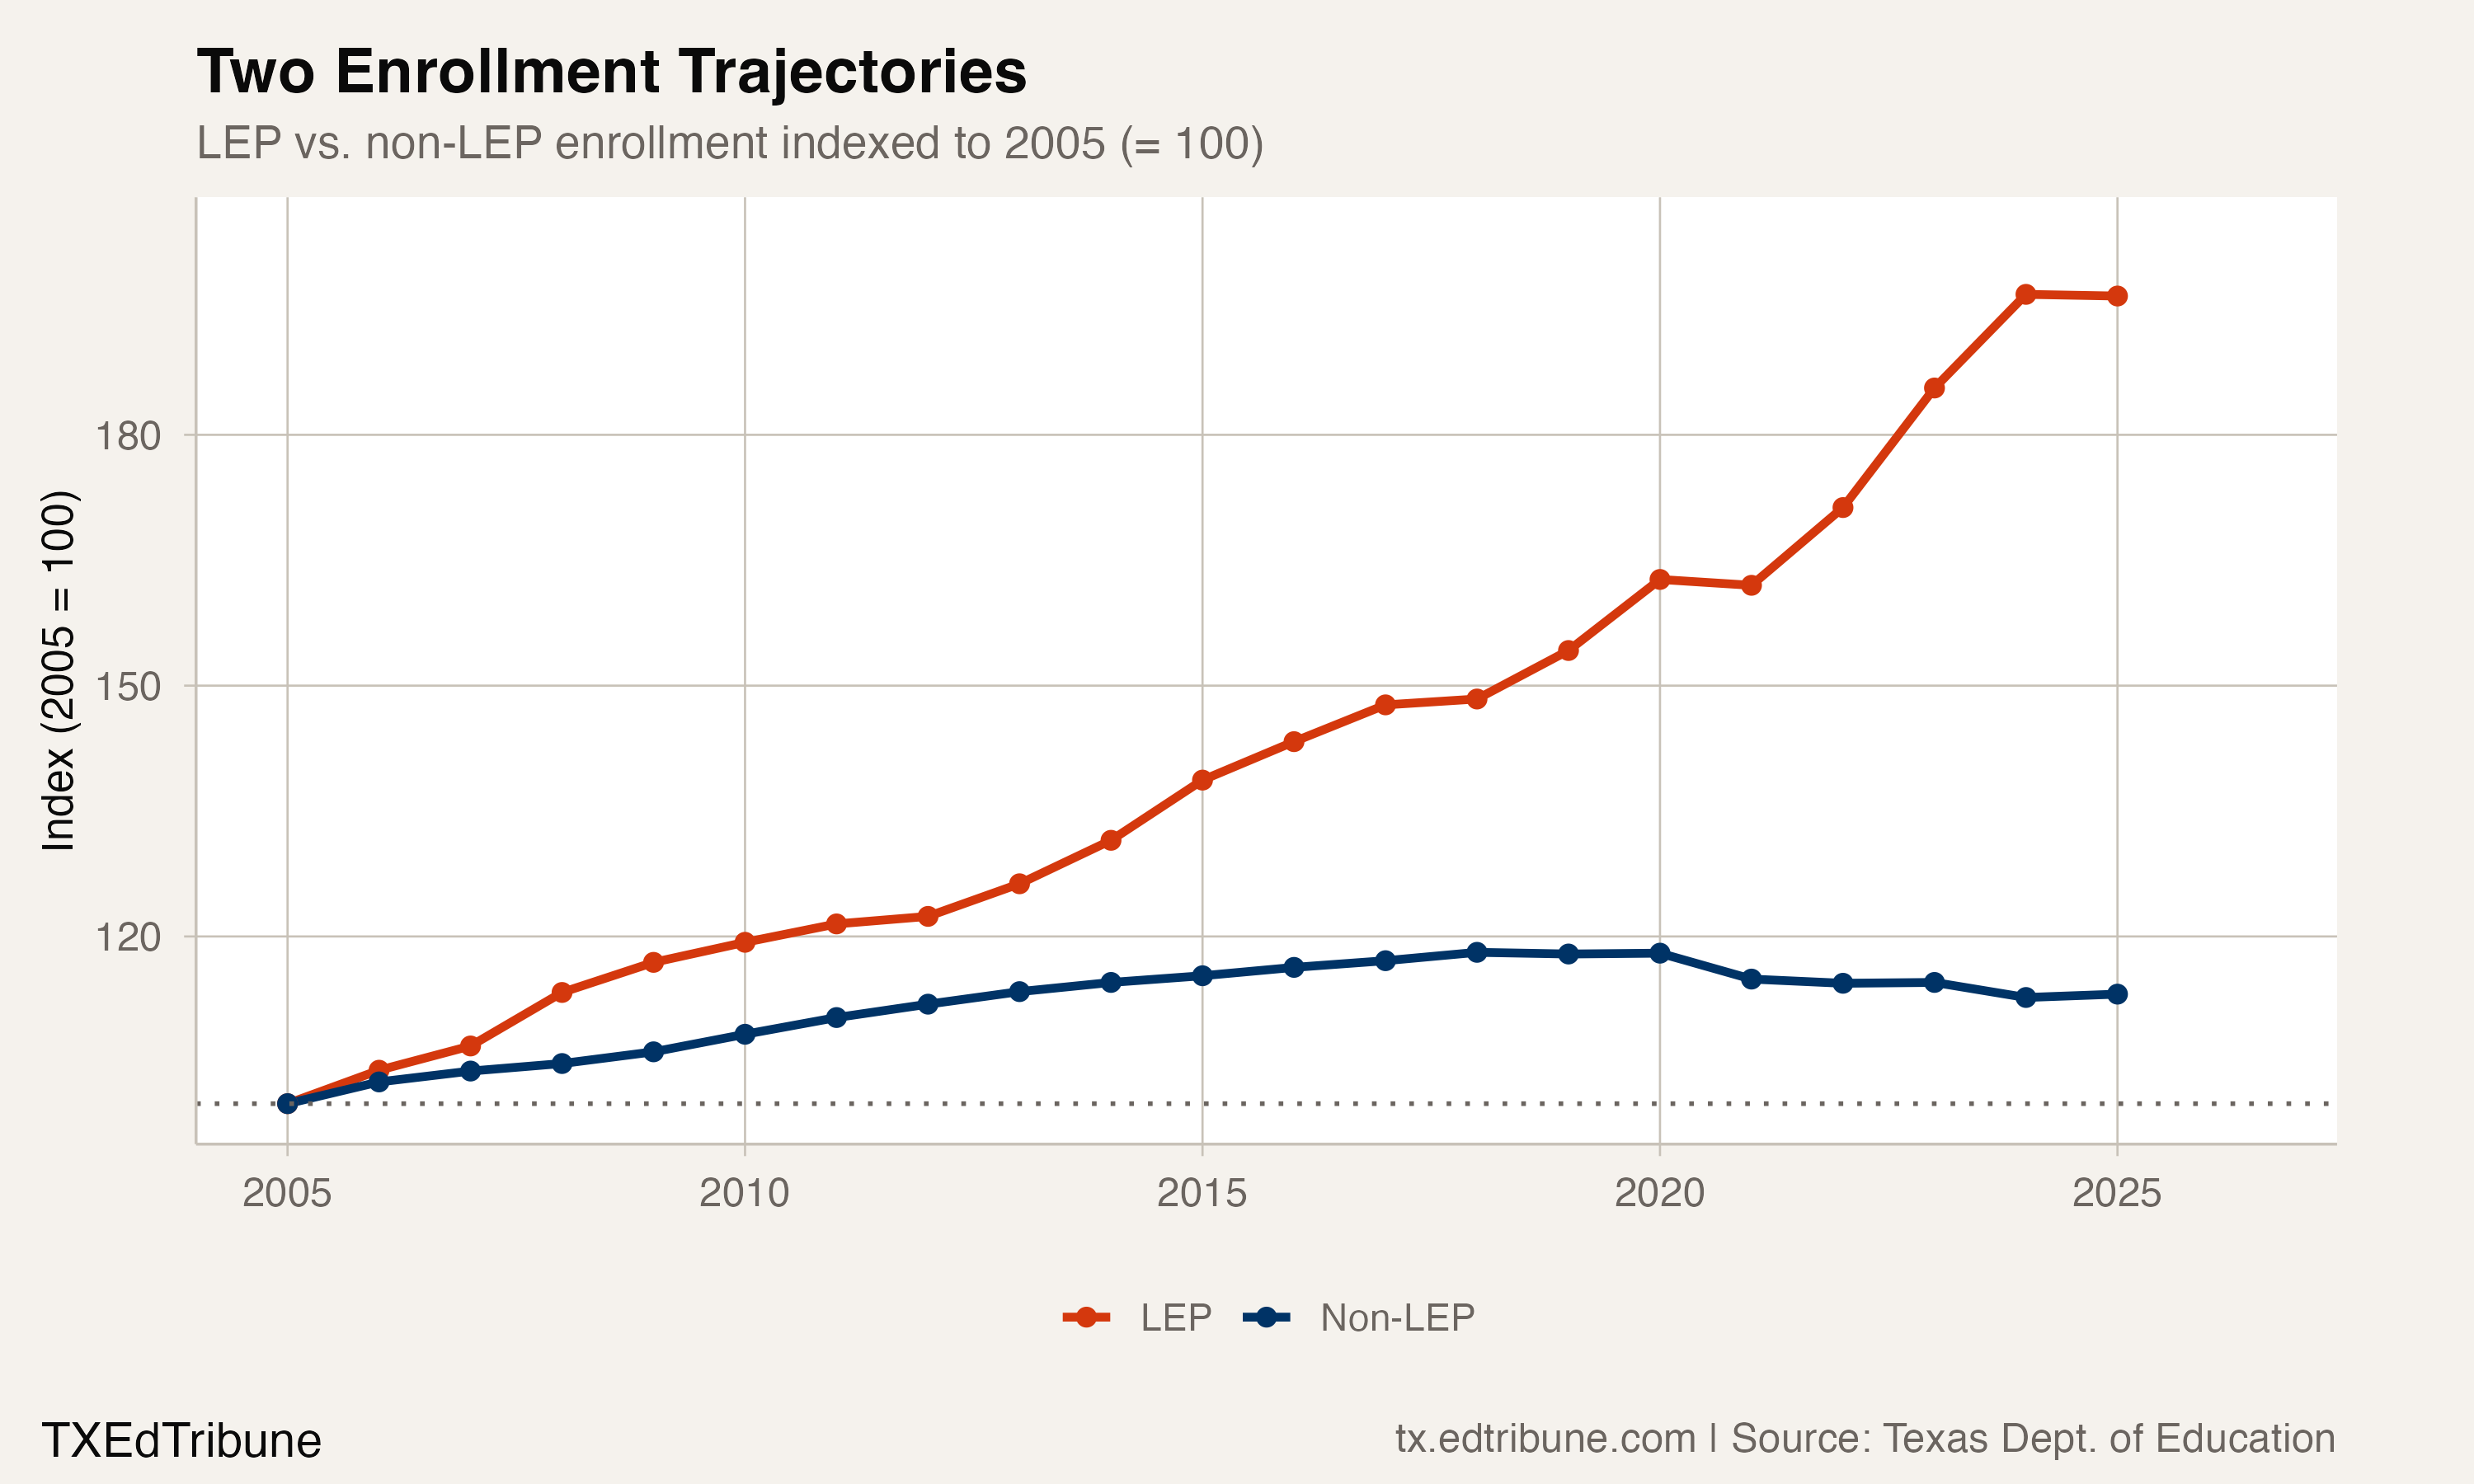
In 2025, the statewide LEP count essentially flatlined for the first time since 2021, declining by 869 students. Whether this marks the end of the post-2020 surge or a one-year pause is unknowable from a single data point. The state's 2025-26 enrollment reports available for this analysis publish district totals but not a comparable English learner count, so the series here ends with 2024-25.
The question for Dallas is not whether the district can serve a majority-English-learner student body. It already is. The question is whether the instructional infrastructure, the bilingual teaching pipeline, and the per-pupil funding formulas that drive resource allocation were designed for a district where the typical student is learning English. For 70,422 students in Dallas, that is no longer a hypothetical.
Detailed code that reproduces the analysis and figures in this article is available exclusively to EdTribune subscribers.
Discussion
Sign in to join the discussion.
Loading comments...