Correction: An earlier version called five years of package data “all-time,” mixed changing district samples, omitted the overlap between highs and lows, and reported an incorrect statewide rate. It also treated a district-name suffix as a charter-versus-traditional classification and attached unsupported explanations to that split. This version uses a fixed panel and labels the name-based screen for what it is.
Texas's statewide all-student graduation rate was 90.7% for the Class of 2024. A fixed district panel shows more movement beneath that statewide result, but not the published story of simultaneous growth in highs and lows.
Among 1,038 district IDs with one reported rate in every year from 2020 through 2024, 423 were at their five-year panel high in 2024 and 248 were at their panel low. Sixty-five flat-rate districts counted in both groups. The union was 606 districts, or 58.4% of the panel.
Classifying the overlap explicitly leaves 358 districts at a high only, 183 at a low only, 65 flat at both, and 432 at neither.
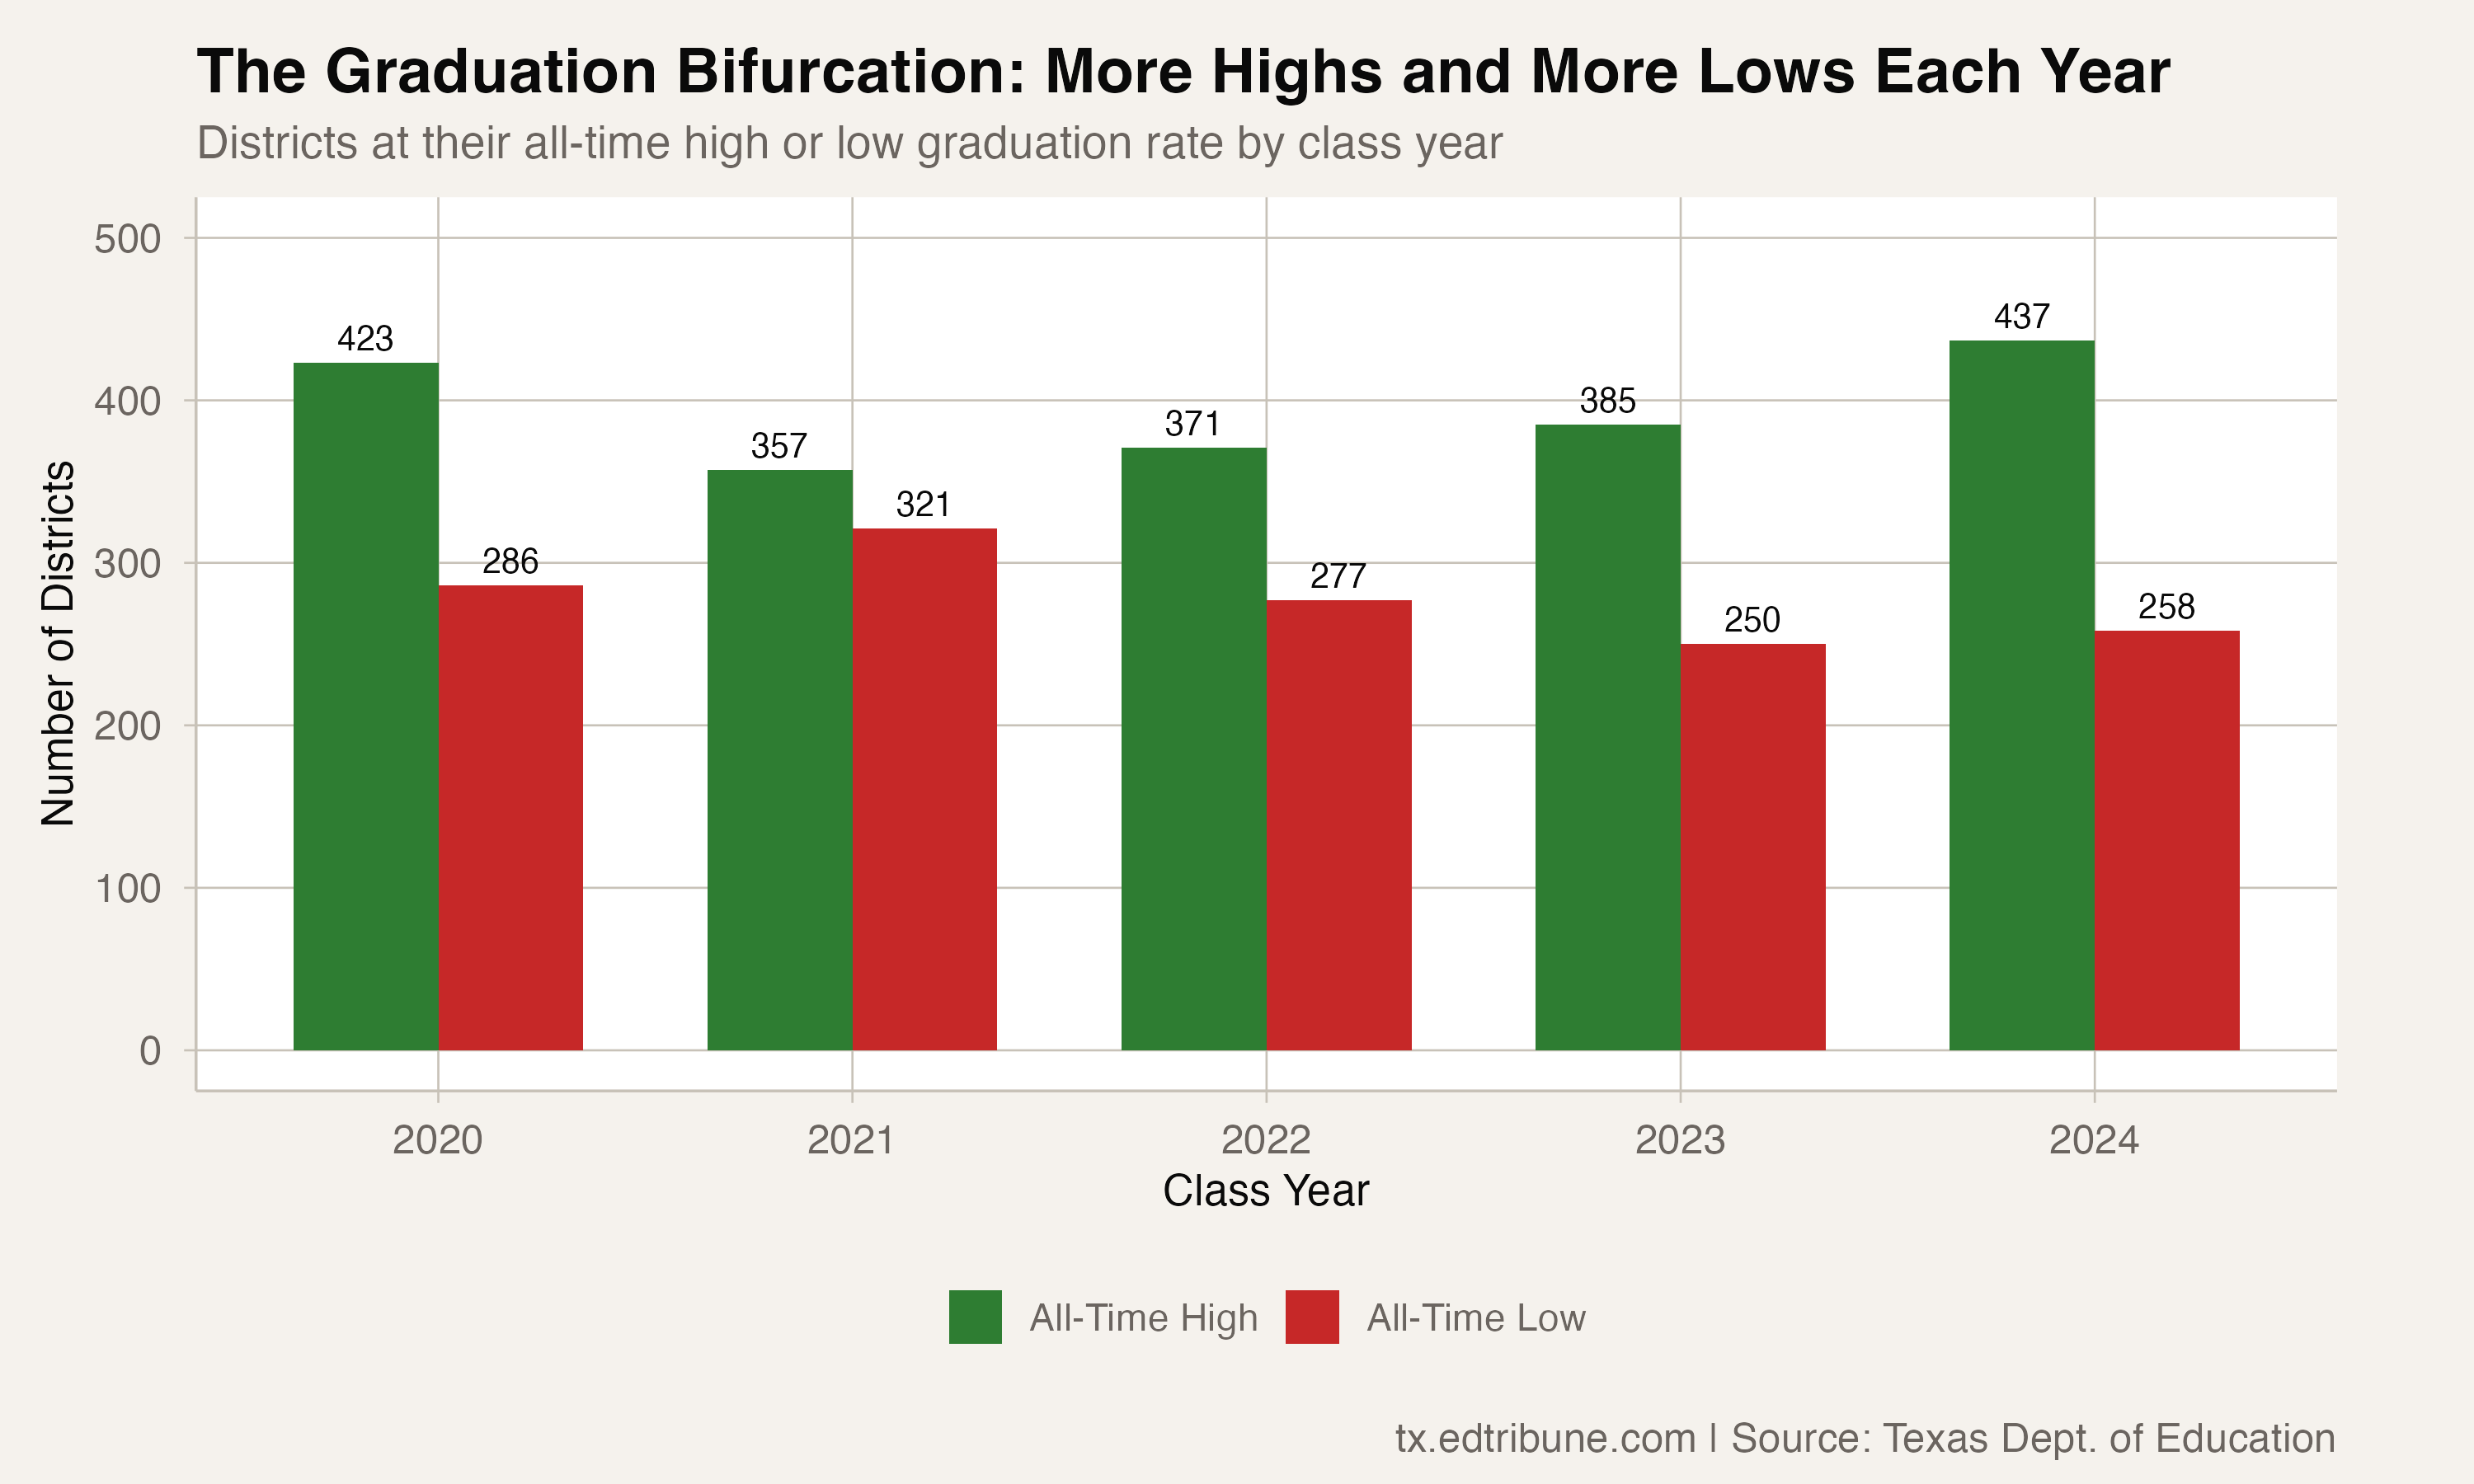
Highs rose and lows fell after 2021
The fixed-panel comparison changes the trend. In 2020, 408 districts were at their eventual five-year high and 274 were at their eventual low. The 2021 counts were 345 highs and 308 lows. By 2024, the high count had risen to 423 while the low count had fallen to 248.
The middle years were not monotonic. The panel recorded 350 highs and 264 lows in 2022, then 368 highs and 237 lows in 2023. These are nonexclusive comparisons with each district's minimum and maximum across the same five reported years; they do not establish a longer “all-time” record.
The supposed sector split was a name screen
The 2024 package contained 1,069 current district rows. Of those, 960 district names ended in “ISD” or “CISD,” while 109 did not. That text rule does not establish legal charter status, alternative-school mission, or which students an organization serves.
Under the name screen, the ISD/CISD-suffix group had a 95.6% unweighted mean and a 96.9% median. The other-name group had an 83.4% mean and a 95.0% median. The mean gap was 12.3 points, but the median gap was 1.9 points.
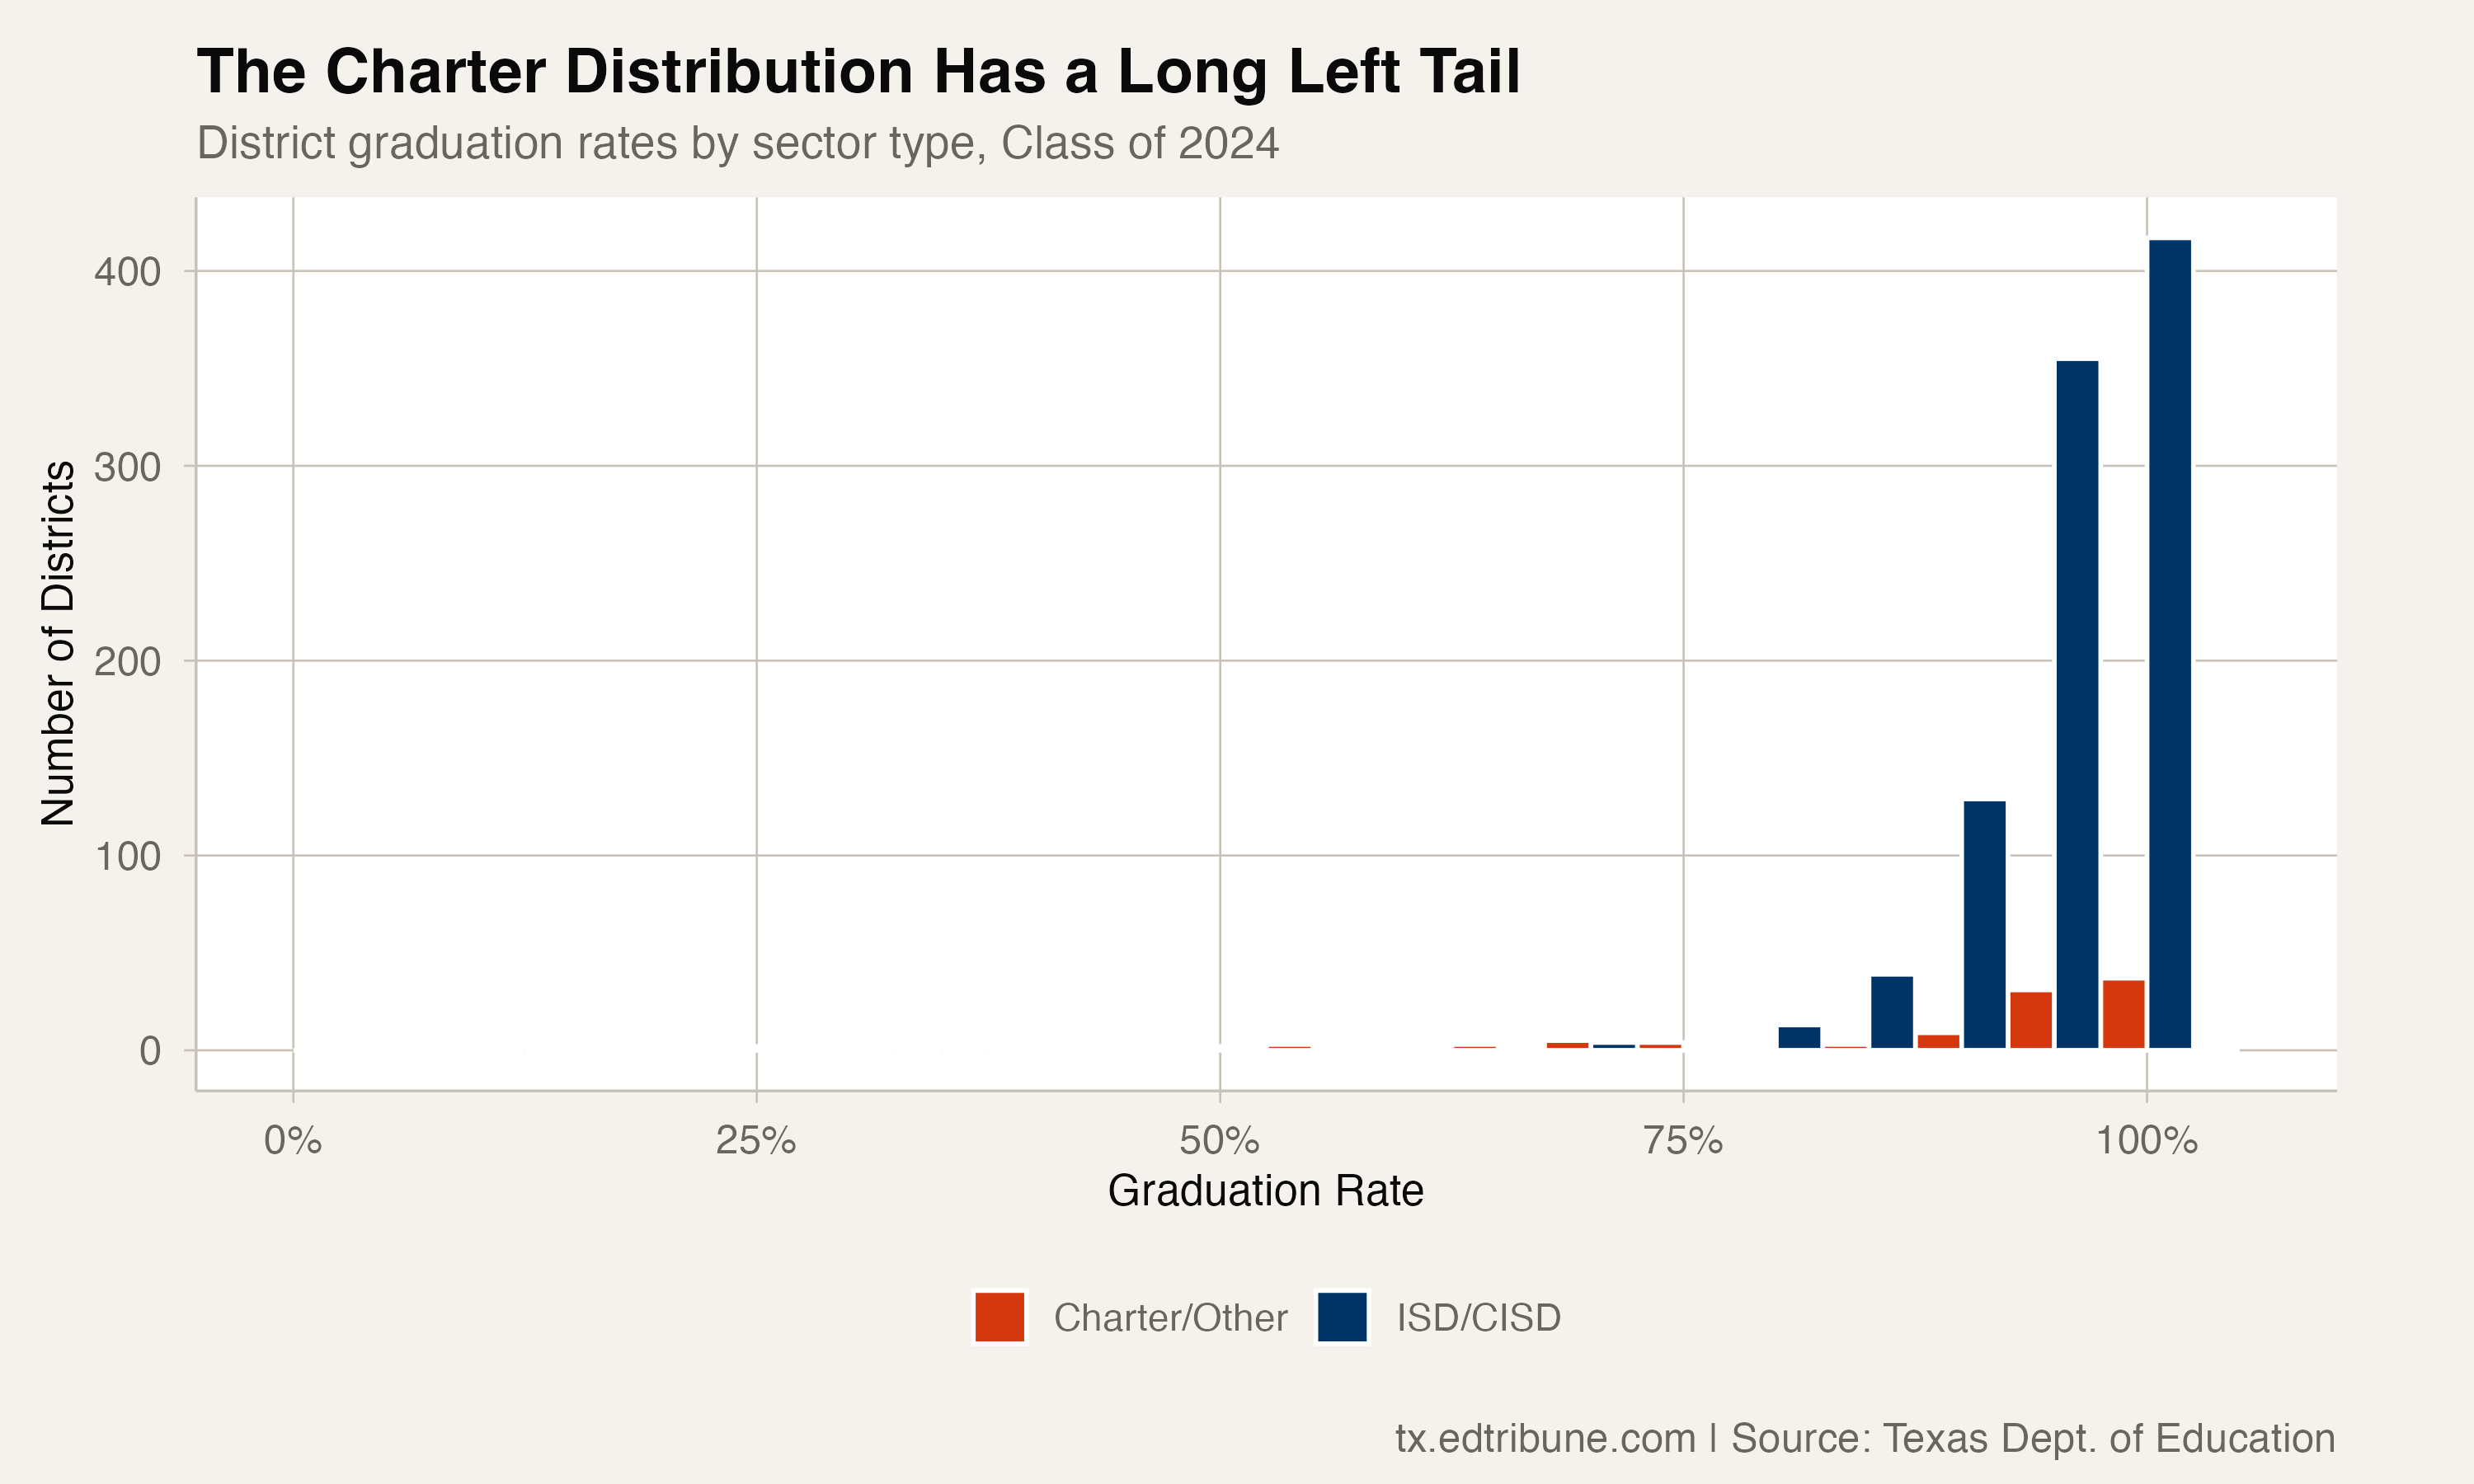
The distributions explain the arithmetic without establishing a cause. Twenty-six current district rows were below 70%: 22 in the other-name group and four in the ISD/CISD-suffix group. At the other end, 644 suffix-group rows and 55 other-name rows were at or above 95%.
The four ISD/CISD-suffix rows below 70% were Karnes City ISD↗ET at 41.4%, Fort Stockton ISD at 67.6%, Hallsville ISD↗ET at 67.9%, and Edgewood ISD at 69.9%.
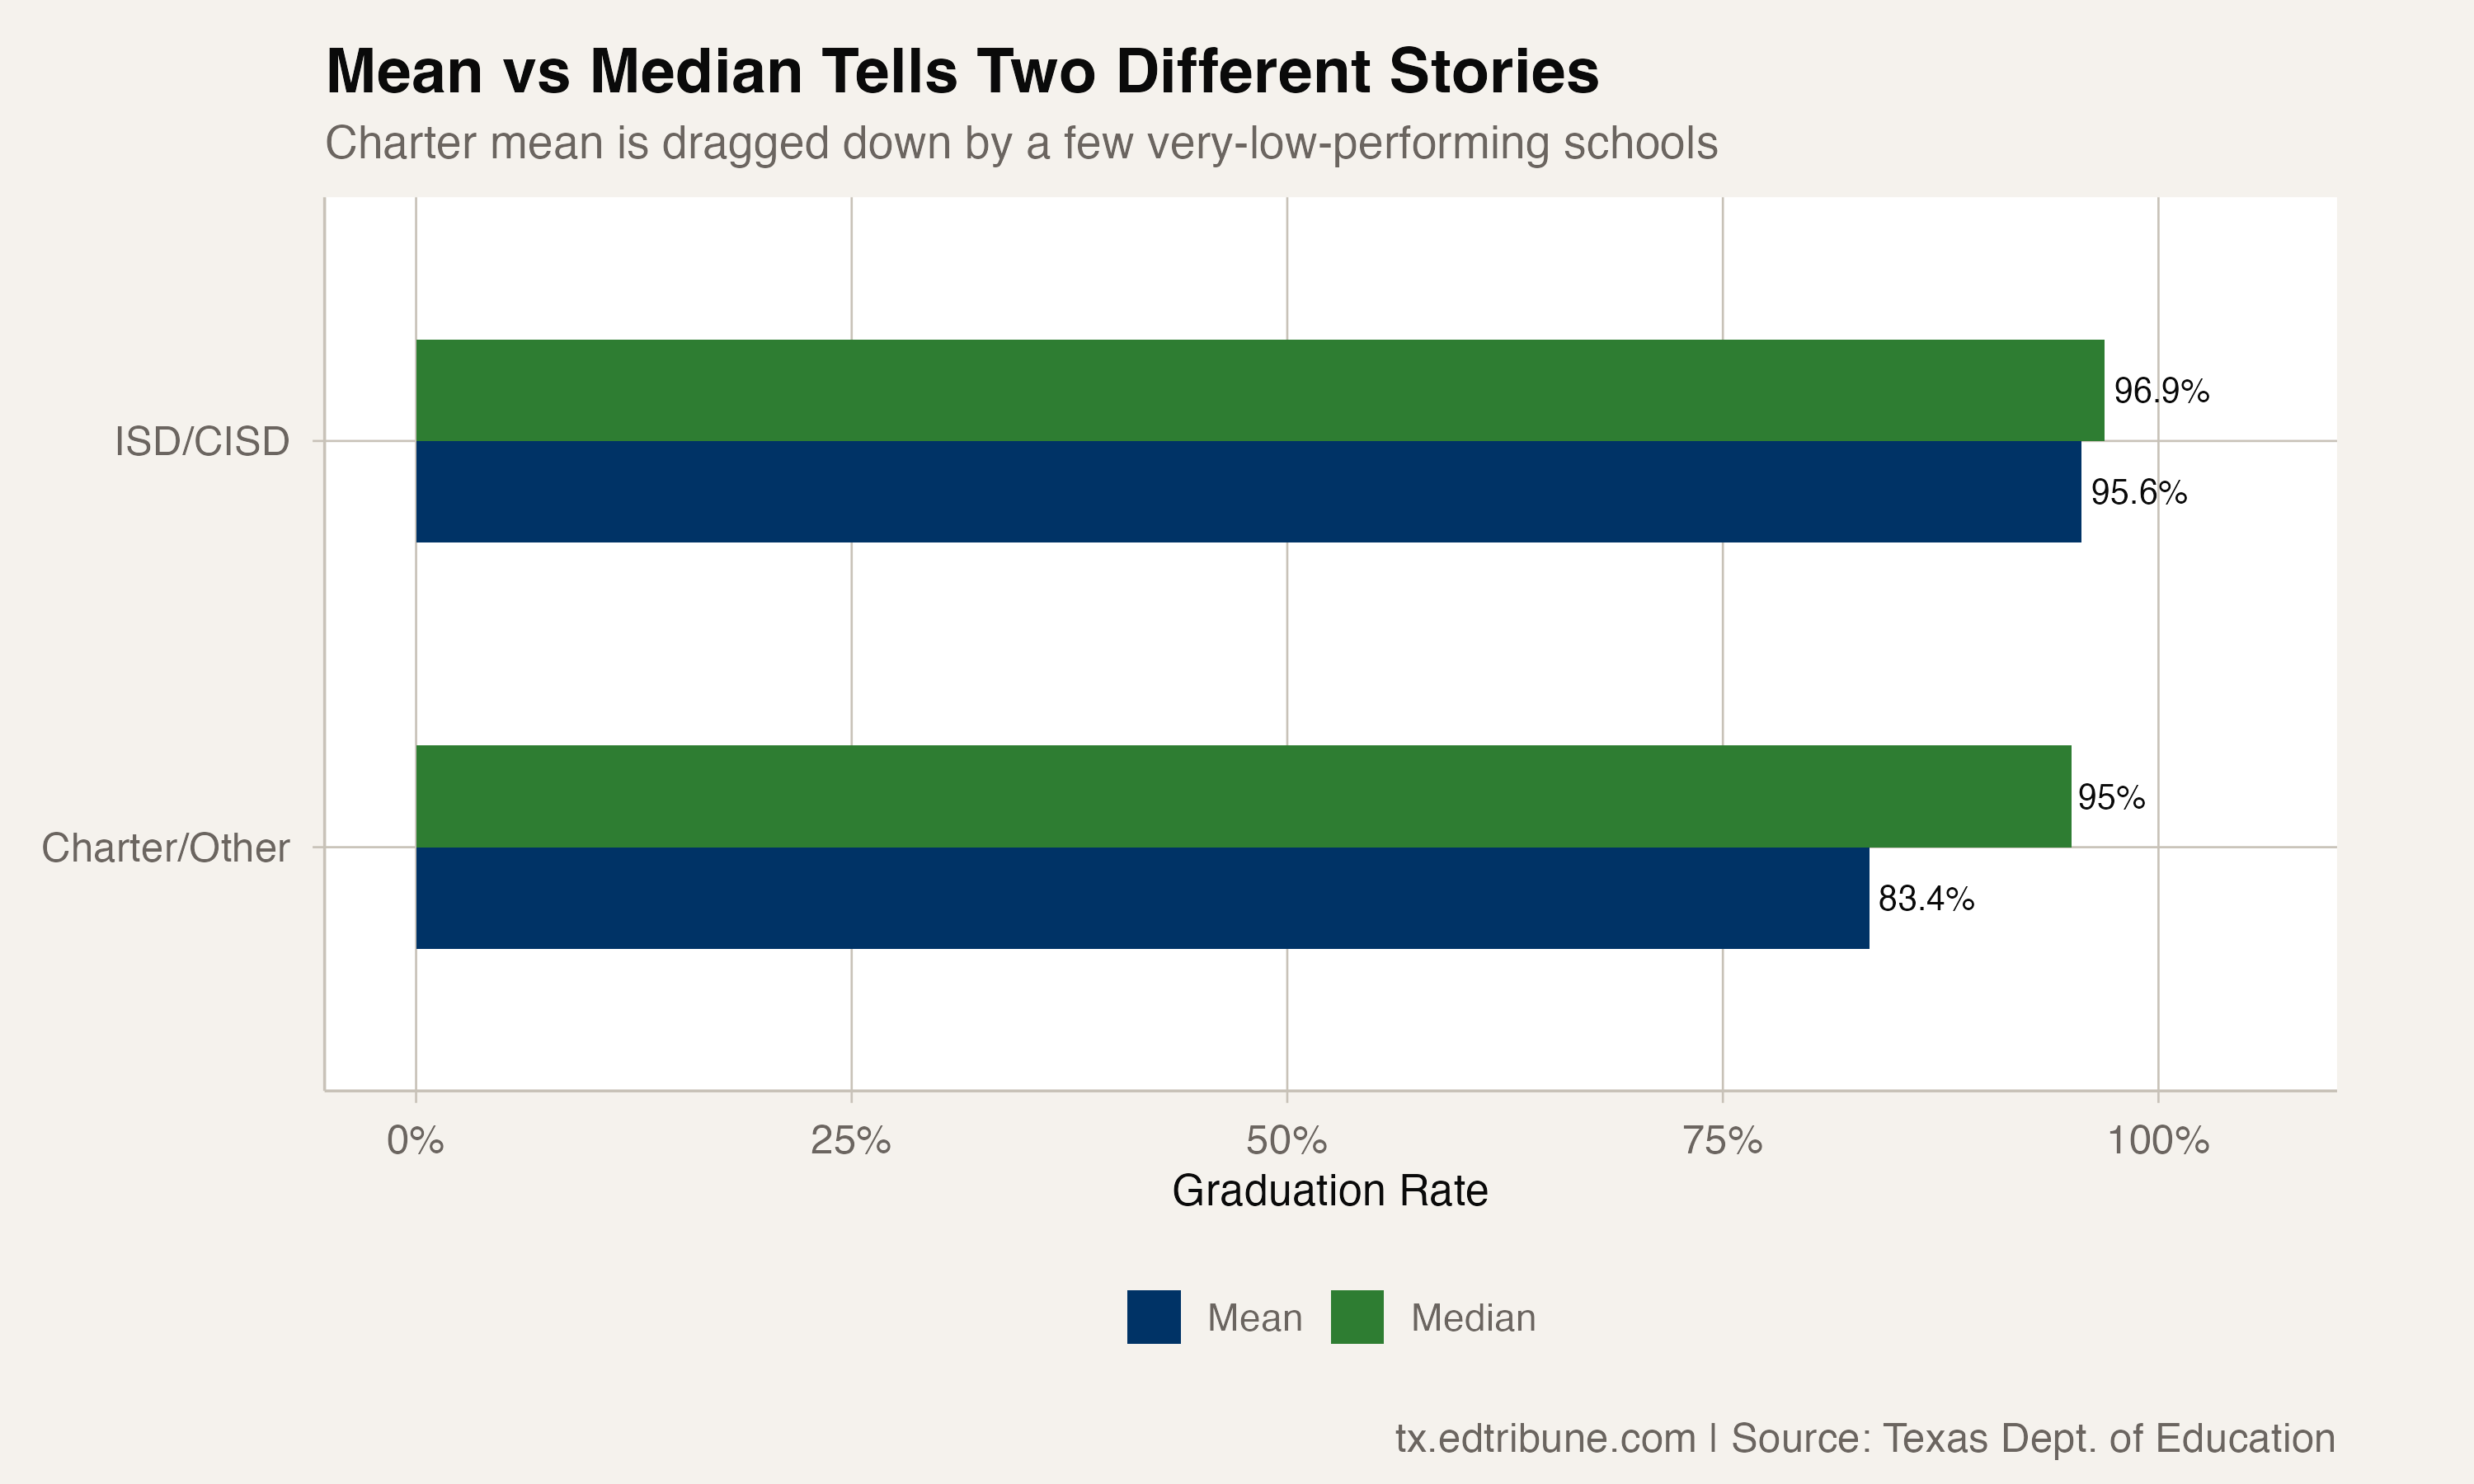
The gap between the two unweighted means is therefore a description of groups created by a naming convention. It is not a legal-sector performance estimate, a student-level comparison, or evidence about why the lowest rates occurred.
Detailed code that reproduces the analysis and figures in this article is available exclusively to EdTribune subscribers.
Discussion
Sign in to join the discussion.
Loading comments...