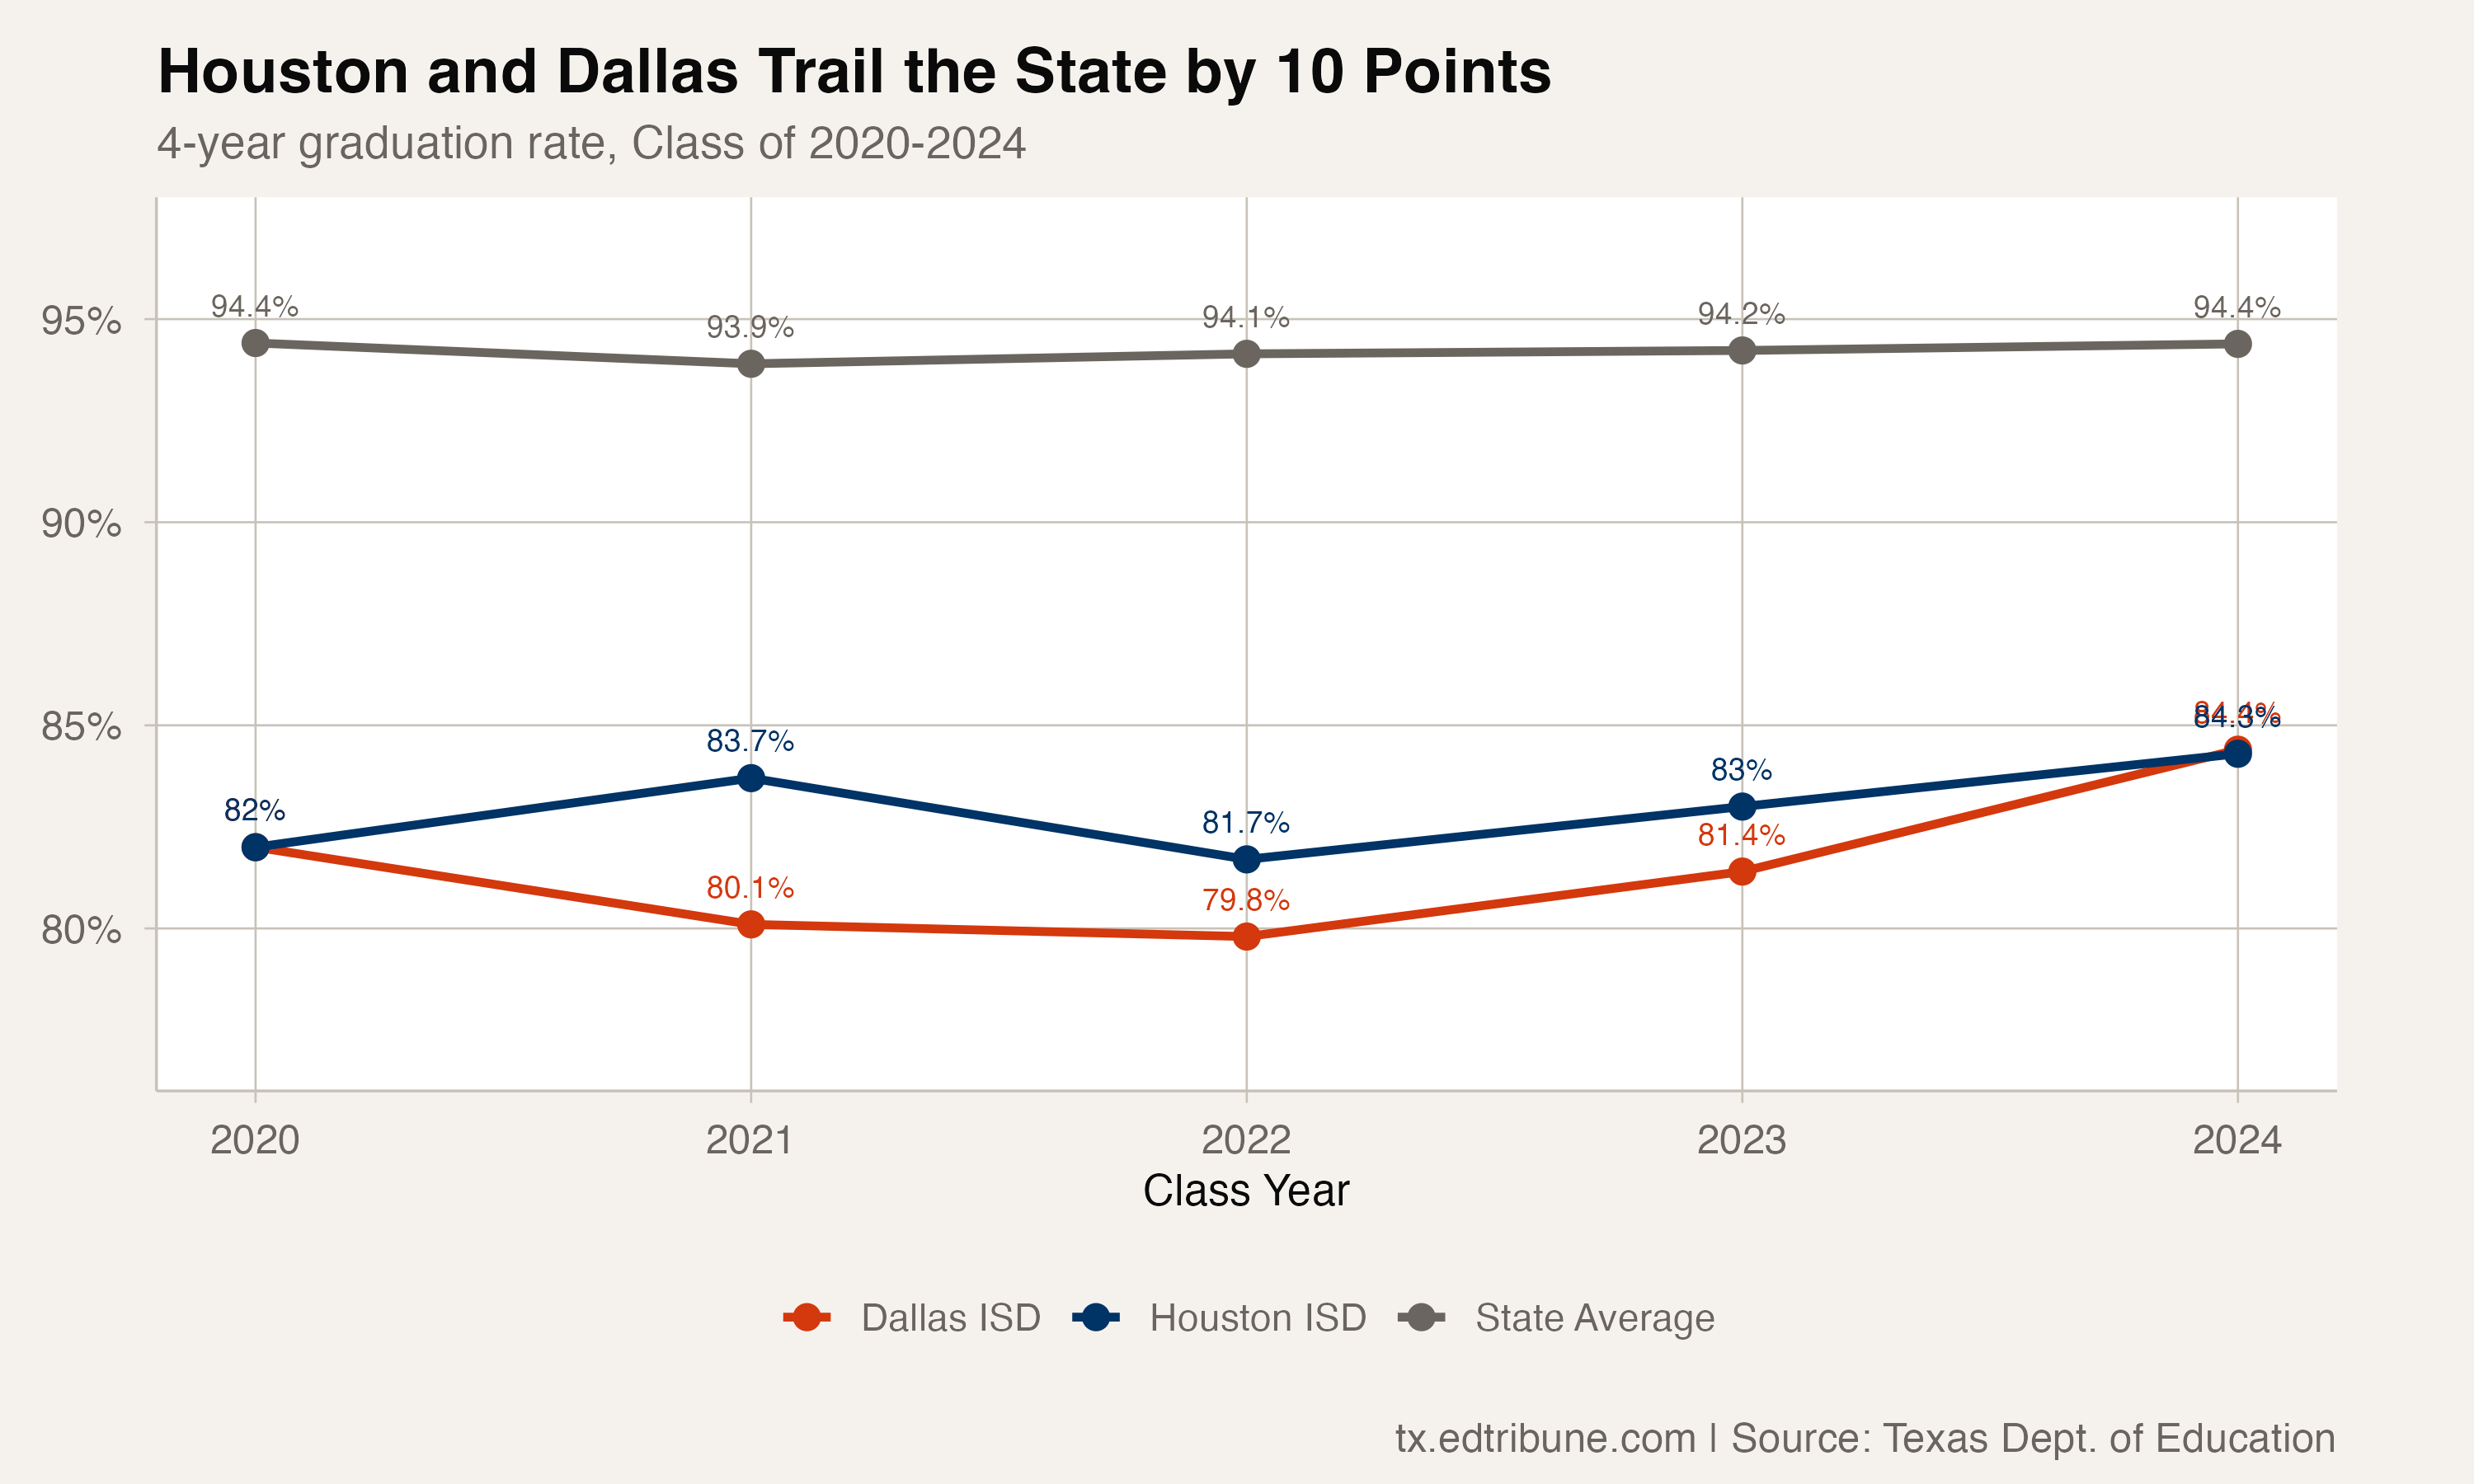
Houston ISD↗ET and Dallas ISD↗ET both improved their graduation rates between the classes of 2020 and 2024. Houston rose from 82.0% to 84.3%, a gain of 2.3 percentage points. Dallas rose from 82.0% to 84.4%, adding 2.4 points.
They were Texas's two largest districts by published enrollment in 2023-24. For the Class of 2024, Houston's graduation rate was 6.4 percentage points below the published statewide rate of 90.7%; Dallas's was 6.3 points below it. The state reported 367,549 graduates from a four-year cohort of 405,019 students. These figures describe the Class of 2024, rather than students now enrolled.
Different paths across five classes
Houston's rate was 82.0% for the Class of 2020. It rose to 83.7% in 2021, fell to 81.7% in 2022, then rose to 83.0% in 2023 and 84.3% in 2024. Its net gain across those classes was 2.3 points.
Dallas also started at 82.0%. Its rate fell to 80.1% for the Class of 2021 and 79.8% for the Class of 2022, then rose to 81.4% in 2023 and 84.4% in 2024. Its gain from the Class of 2022 trough was 4.6 points.
Reported at-risk rates
Houston's Class of 2024 rate for at-risk students was 80.5%, and Dallas's was 82.3%. The state's separately published at-risk cohort recorded 163,349 graduates from 187,893 students and a rate of 86.9%.
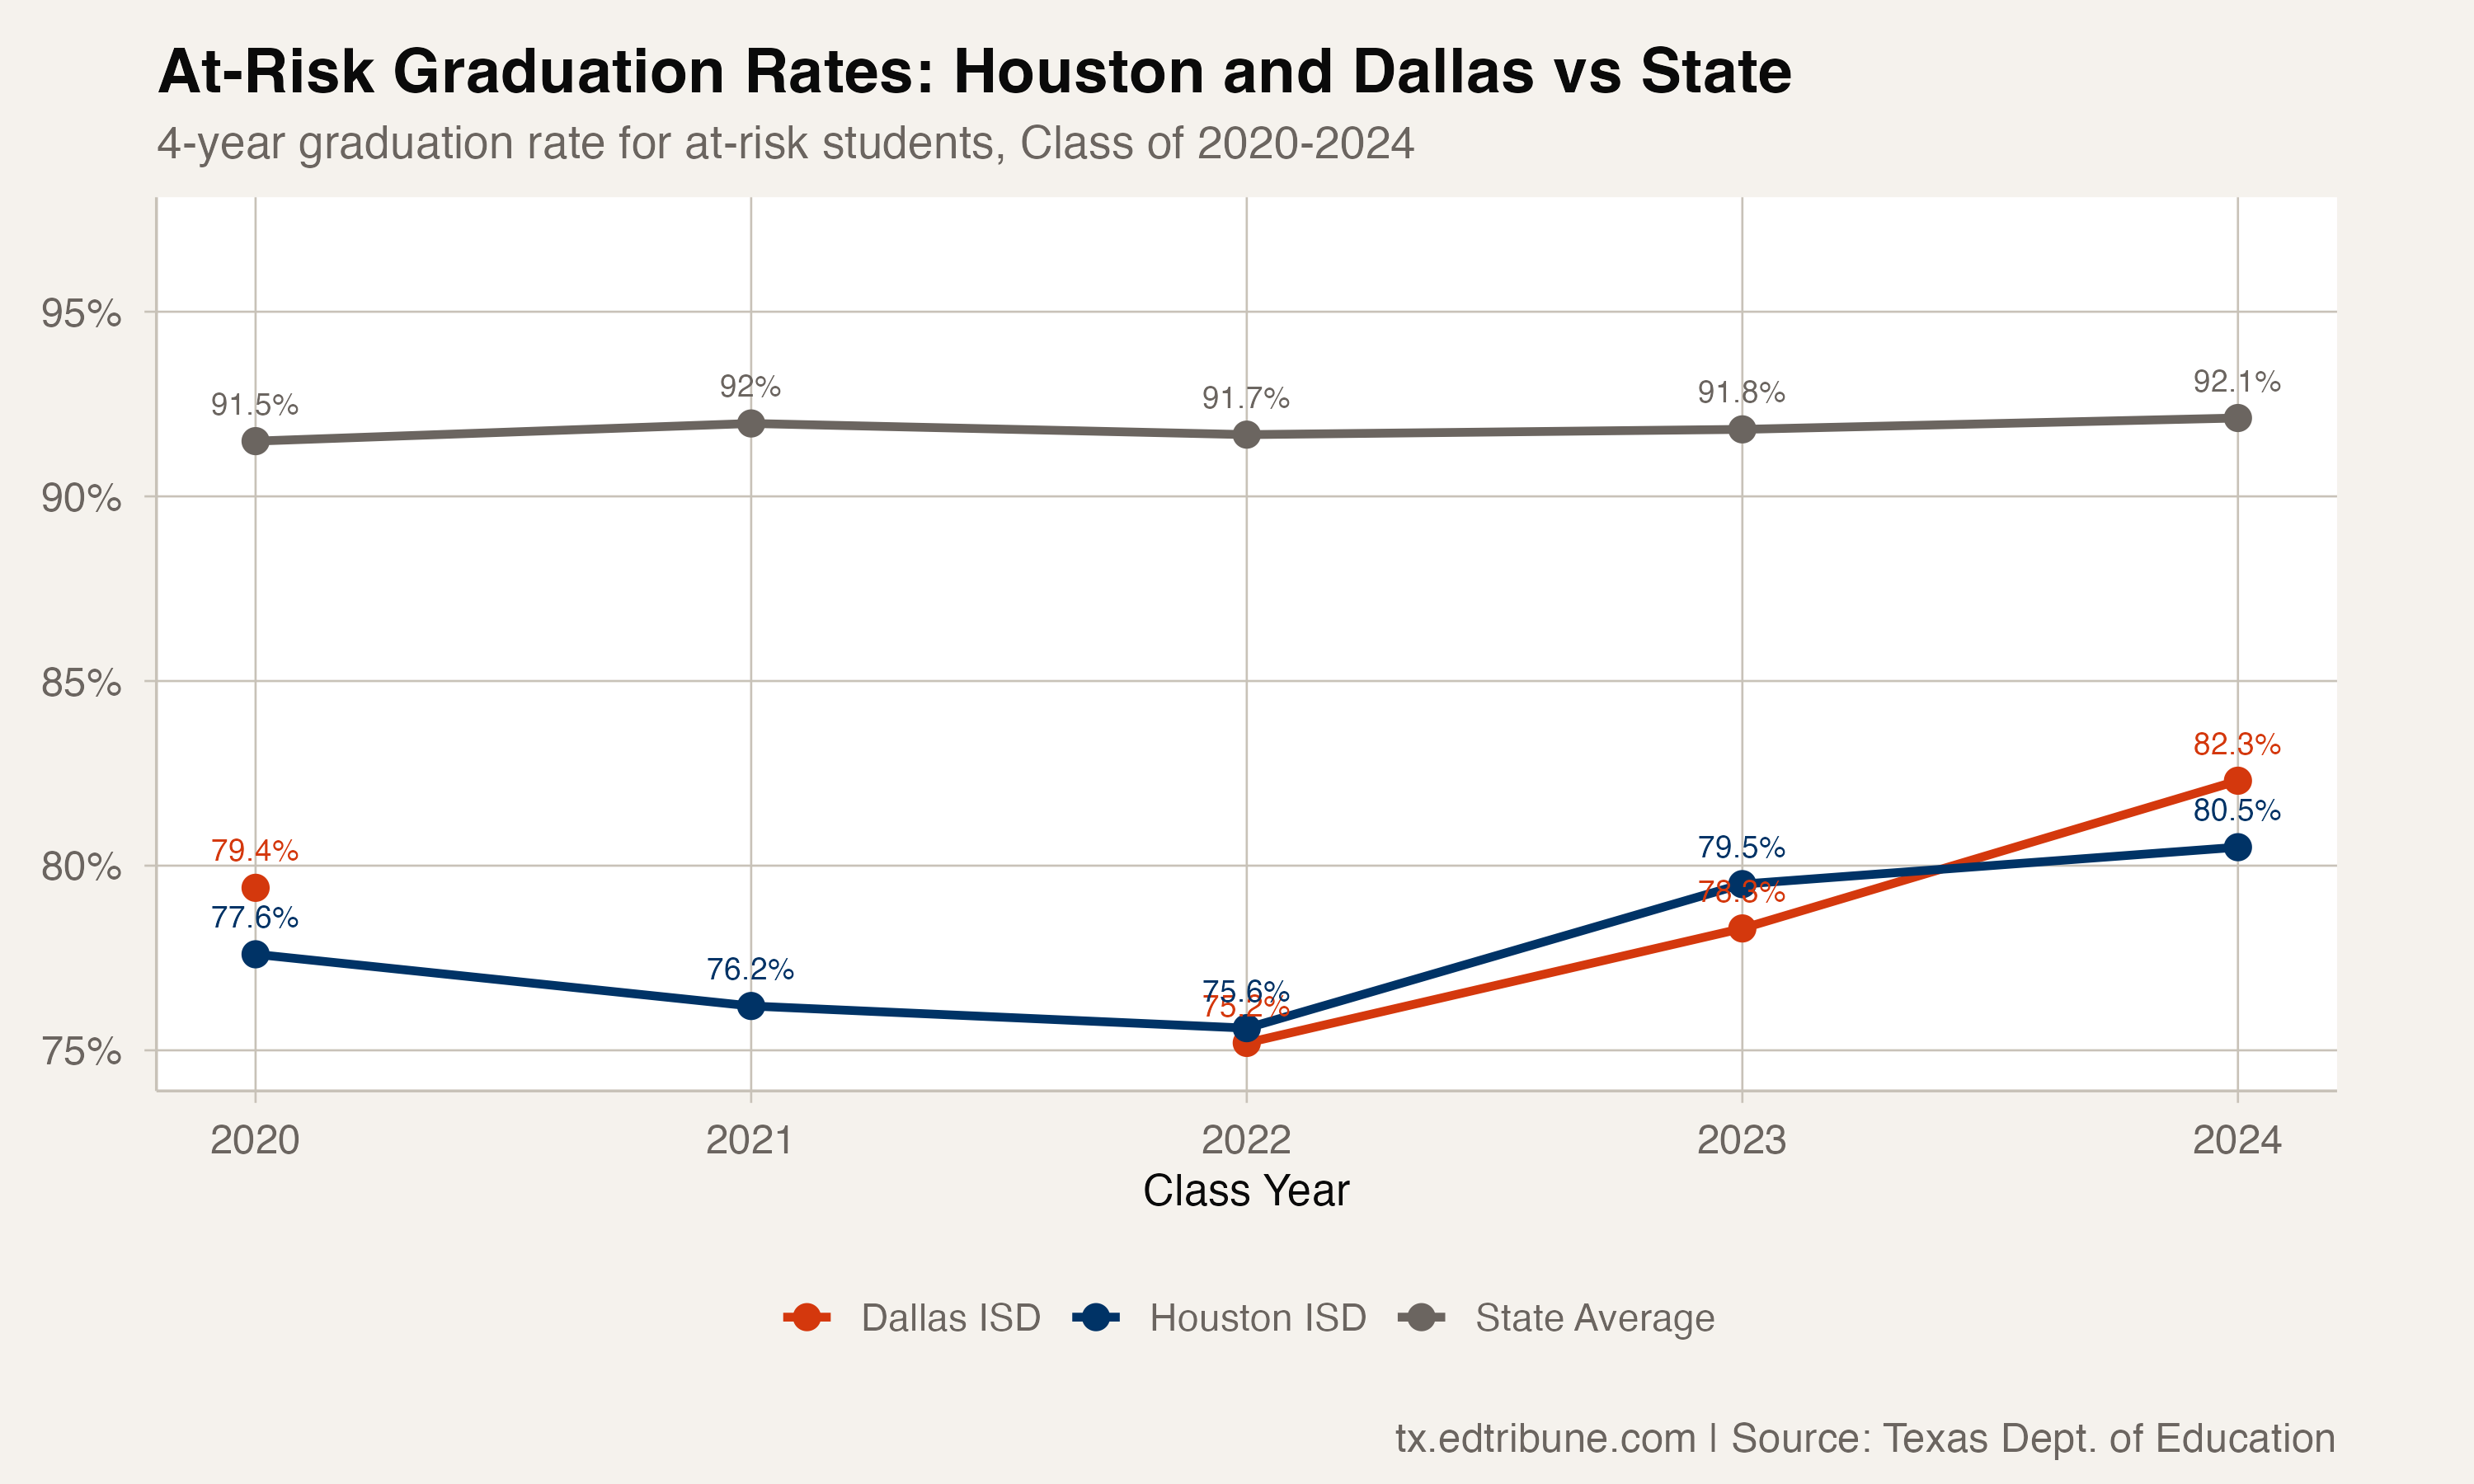
Dallas's at-risk rate fell from 79.4% for the Class of 2020 to 72.5% for the Class of 2021 before reaching 82.3% for the Class of 2024. The records do not establish why the rate changed.
A fixed district comparison
Among the seven named districts in this comparison—Houston, Dallas, San Antonio, Austin, Arlington, El Paso and Aldine—Austin ISD↗ET had the highest Class of 2024 rate, at 90.2%. Its rate had been 92.8% for the Class of 2020. San Antonio ISD↗ET reported 85.5% for the Class of 2024, and El Paso ISD↗ET reported 82.3%.
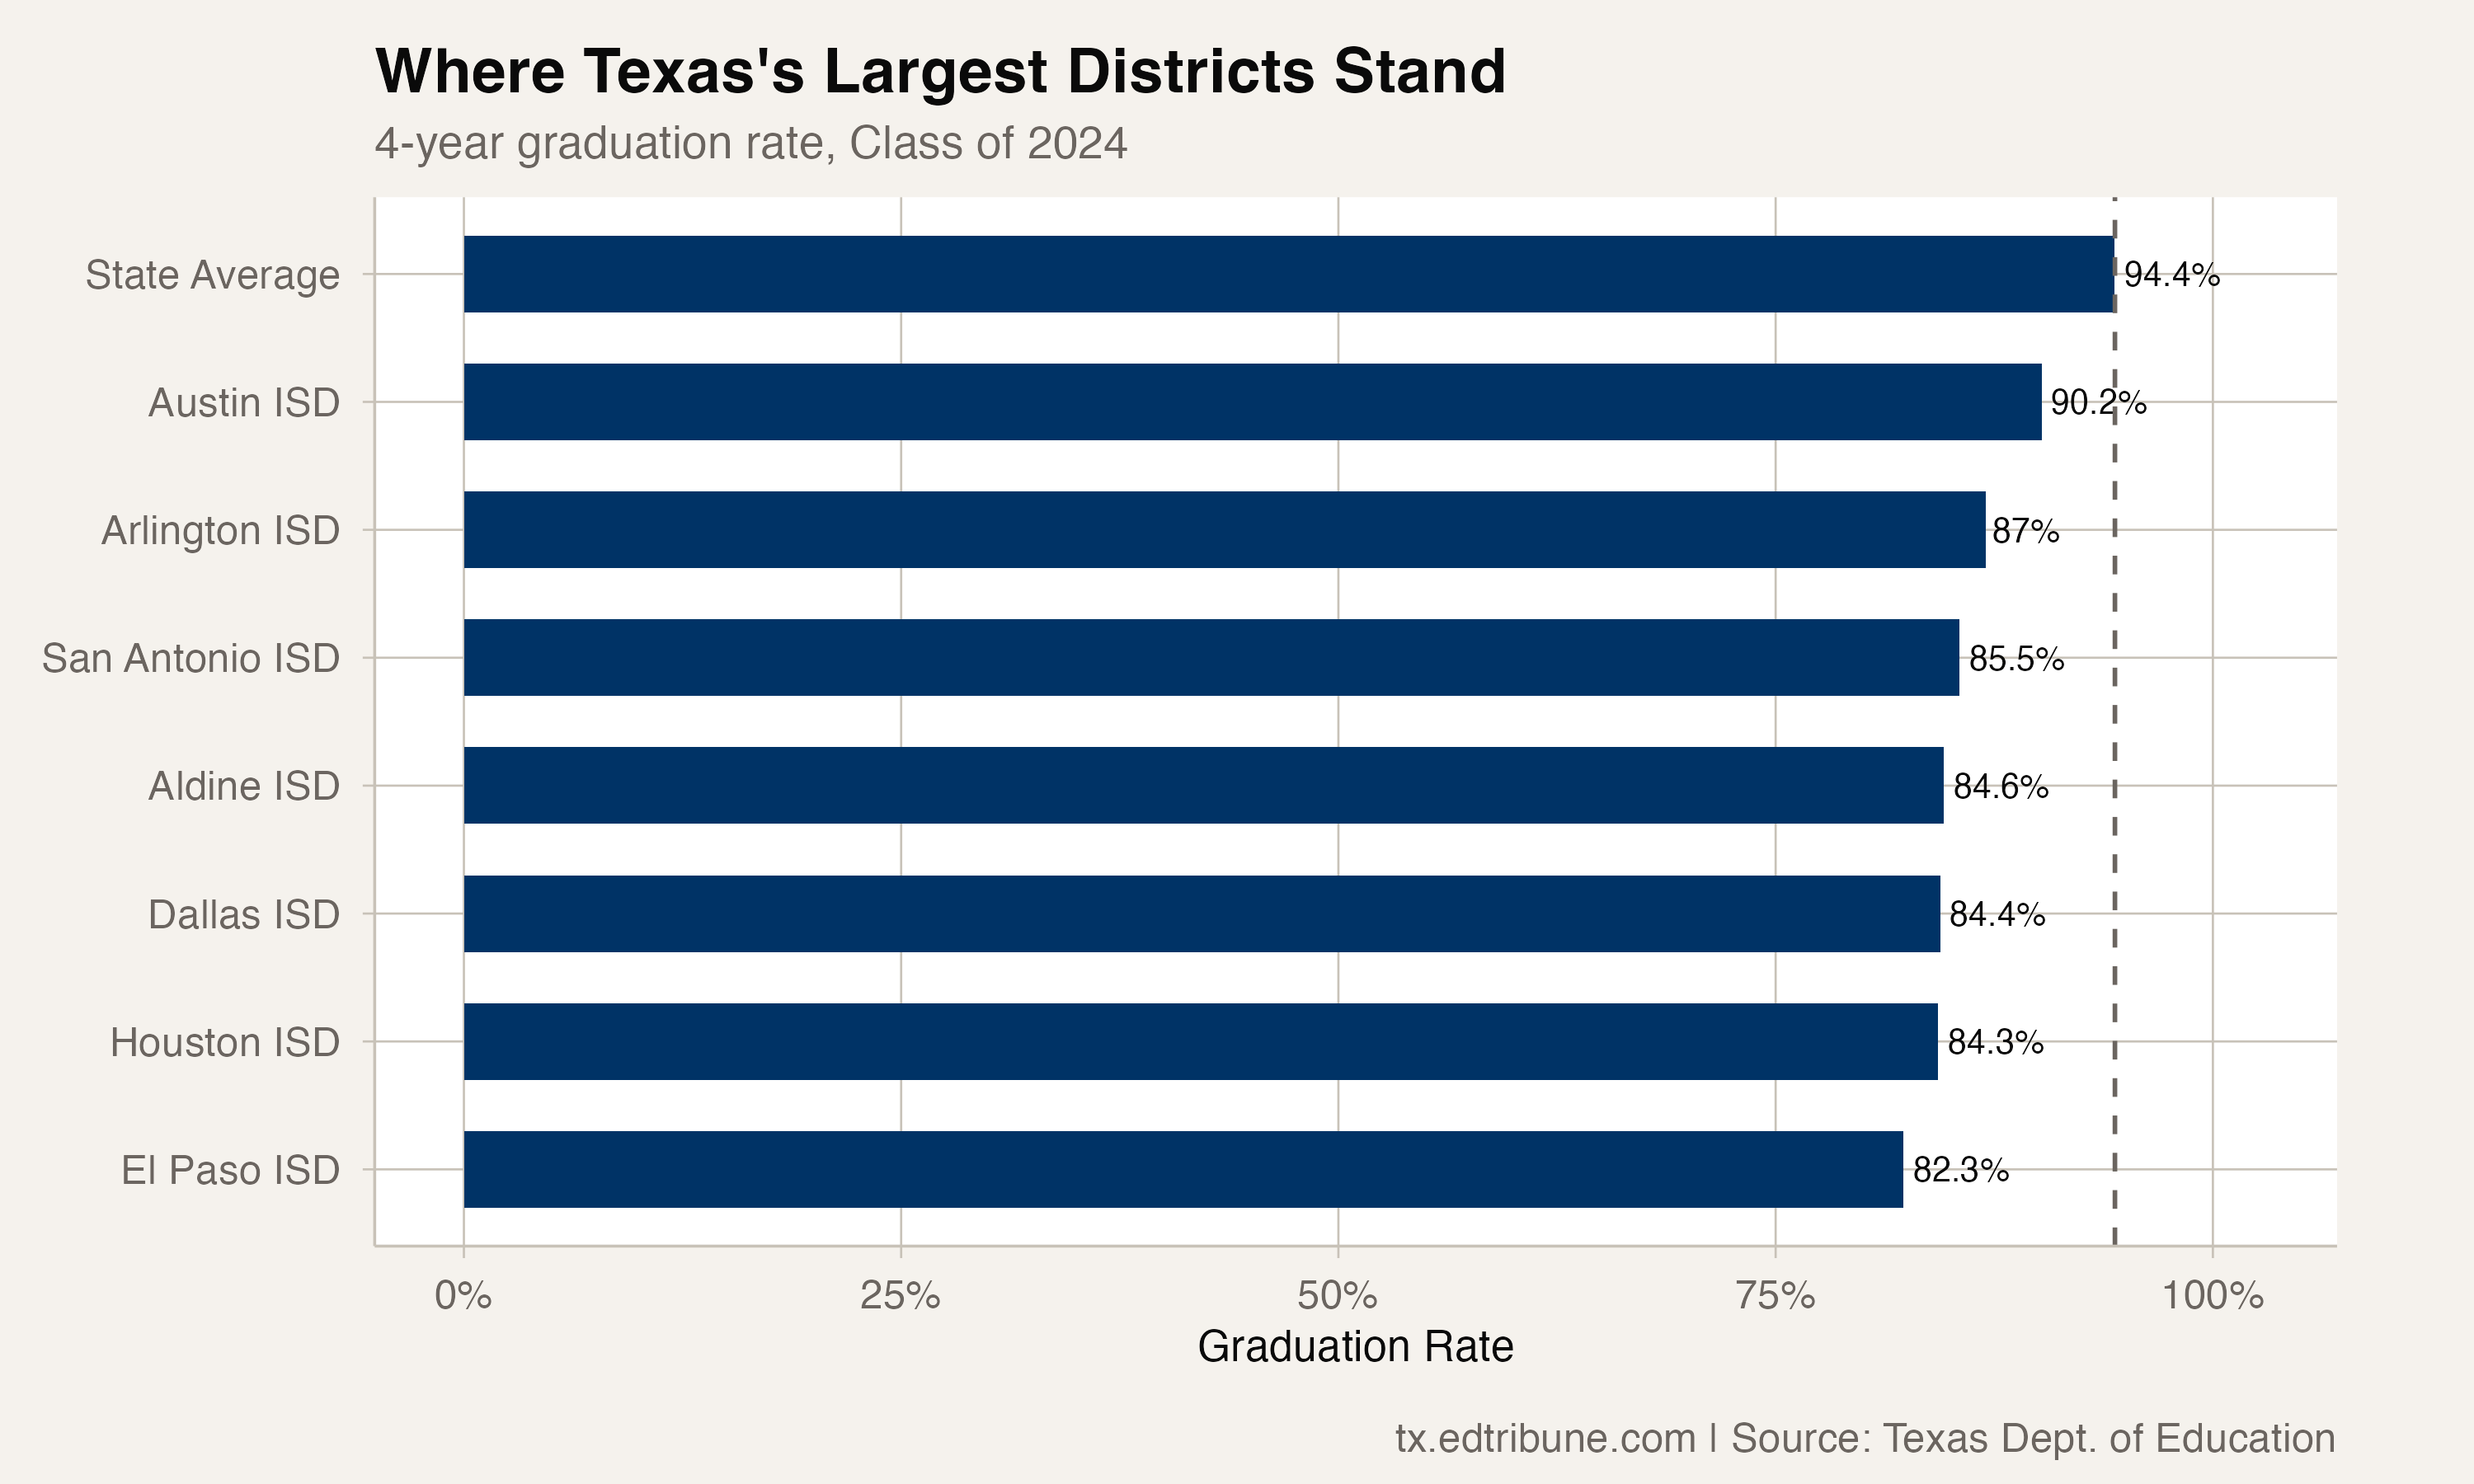
Aldine ISD↗ET had about 58,000 students in its published total enrollment for the 2023–2024 school year. Its graduation rate rose from 79.0% to 84.6% across the classes of 2020–2024, a gain of 5.6 points. Its rate rose by 6.2 points between the final two classes. These are reported rates for the same district; they do not identify a cause for the increase.
The comparisons cover reported records and fixed class-year endpoints. They do not fill missing subgroup cells or establish the effects of management or policy changes.
The Texas Education Agency's graduation records provide the four-year cohort measures used here.
Detailed code that reproduces the analysis and figures in this article is available exclusively to EdTribune subscribers.
Discussion
Sign in to join the discussion.
Loading comments...