Correction: An earlier version described a decline in every class year and equated the starting rate with the state average. It also included hypothetical class sizes and causal explanations that were not supported by the graduation records. Those statements have been corrected or removed; the reported district and subgroup rates are unchanged.
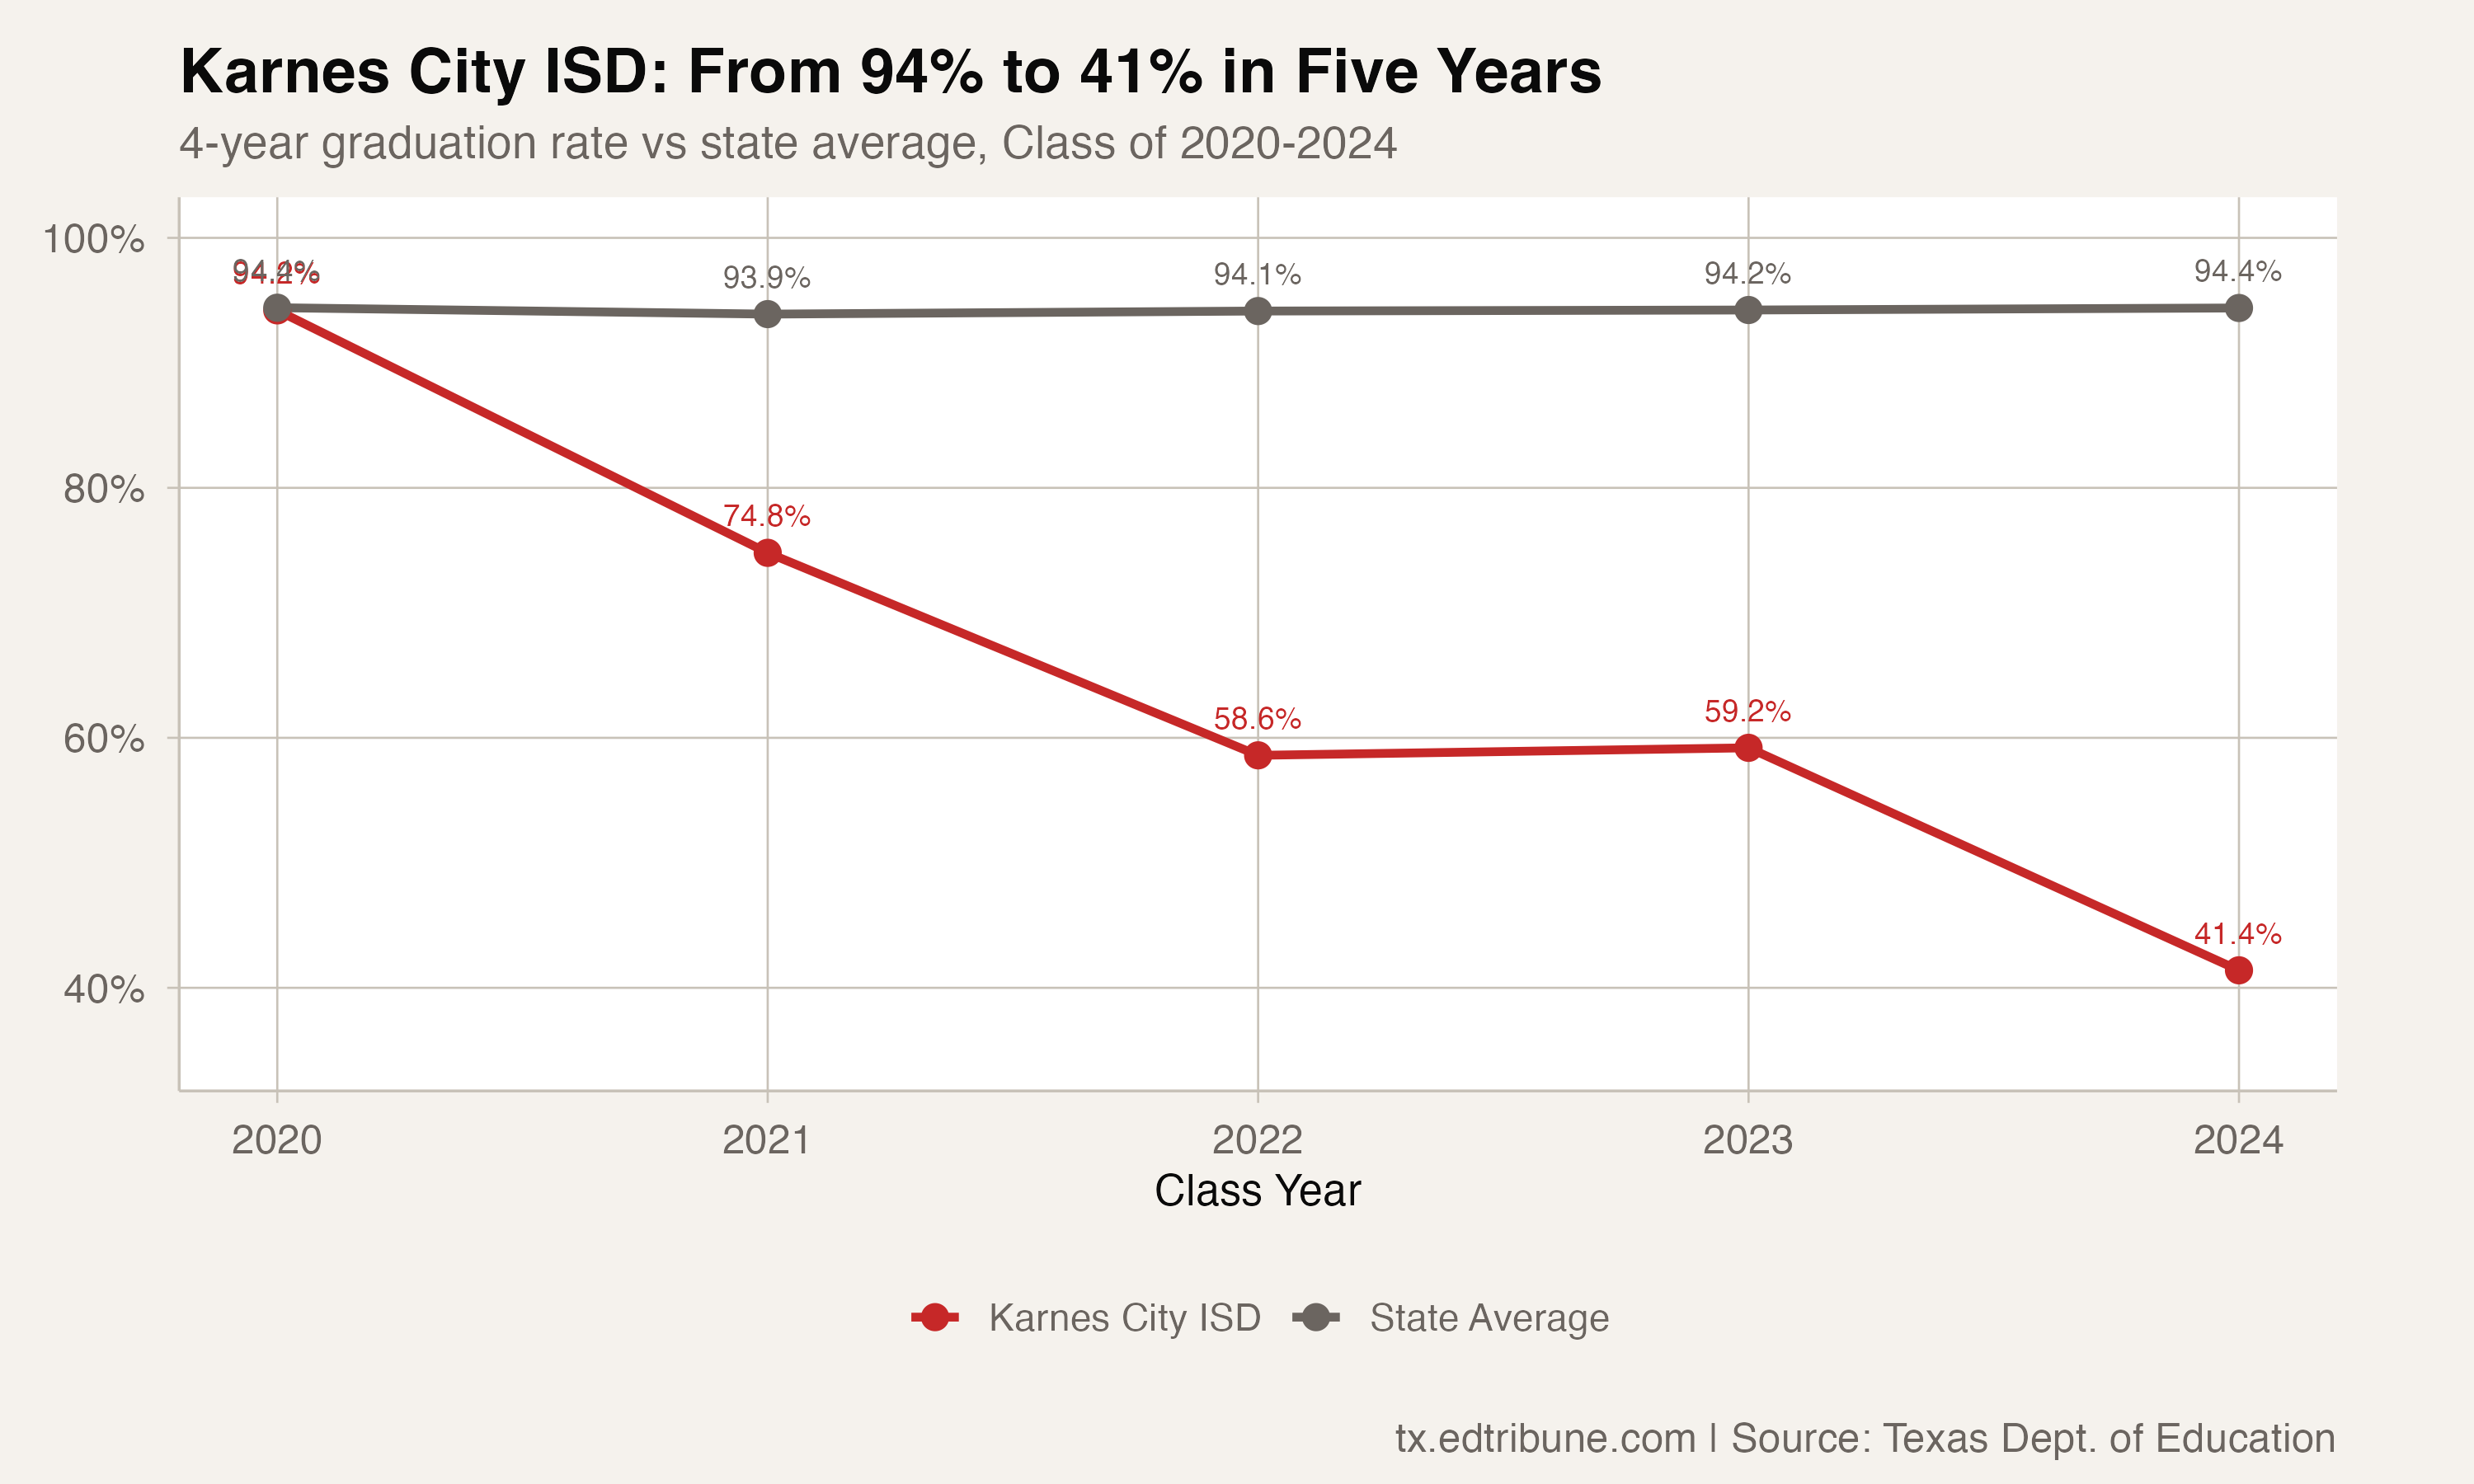
Karnes City ISD↗ET graduated 94.2% of its Class of 2020, above the statewide rate of 90.3%. By the Class of 2024, its rate was 41.4%.
That 52.8-point decline was the largest among Texas district records with reported rates for both classes. Among districts whose reported names end in ISD or CISD, Fort Stockton ISD↗ET had the next-largest decline, at 24.2 points.
A small rise interrupted the decline
Karnes City's five reported class-year rates were 94.2%, 74.8%, 58.6%, 59.2%, and 41.4%. The increase from 2022 to 2023 was 0.6 points. It interrupted the downward path before the rate fell again in 2024.
The 19.4-point drop from the Class of 2020 to the Class of 2021 ranked among the seven largest single-year declines in matched Texas district records. The next decline, into the Class of 2022, was 16.2 points.
Declines across reported groups
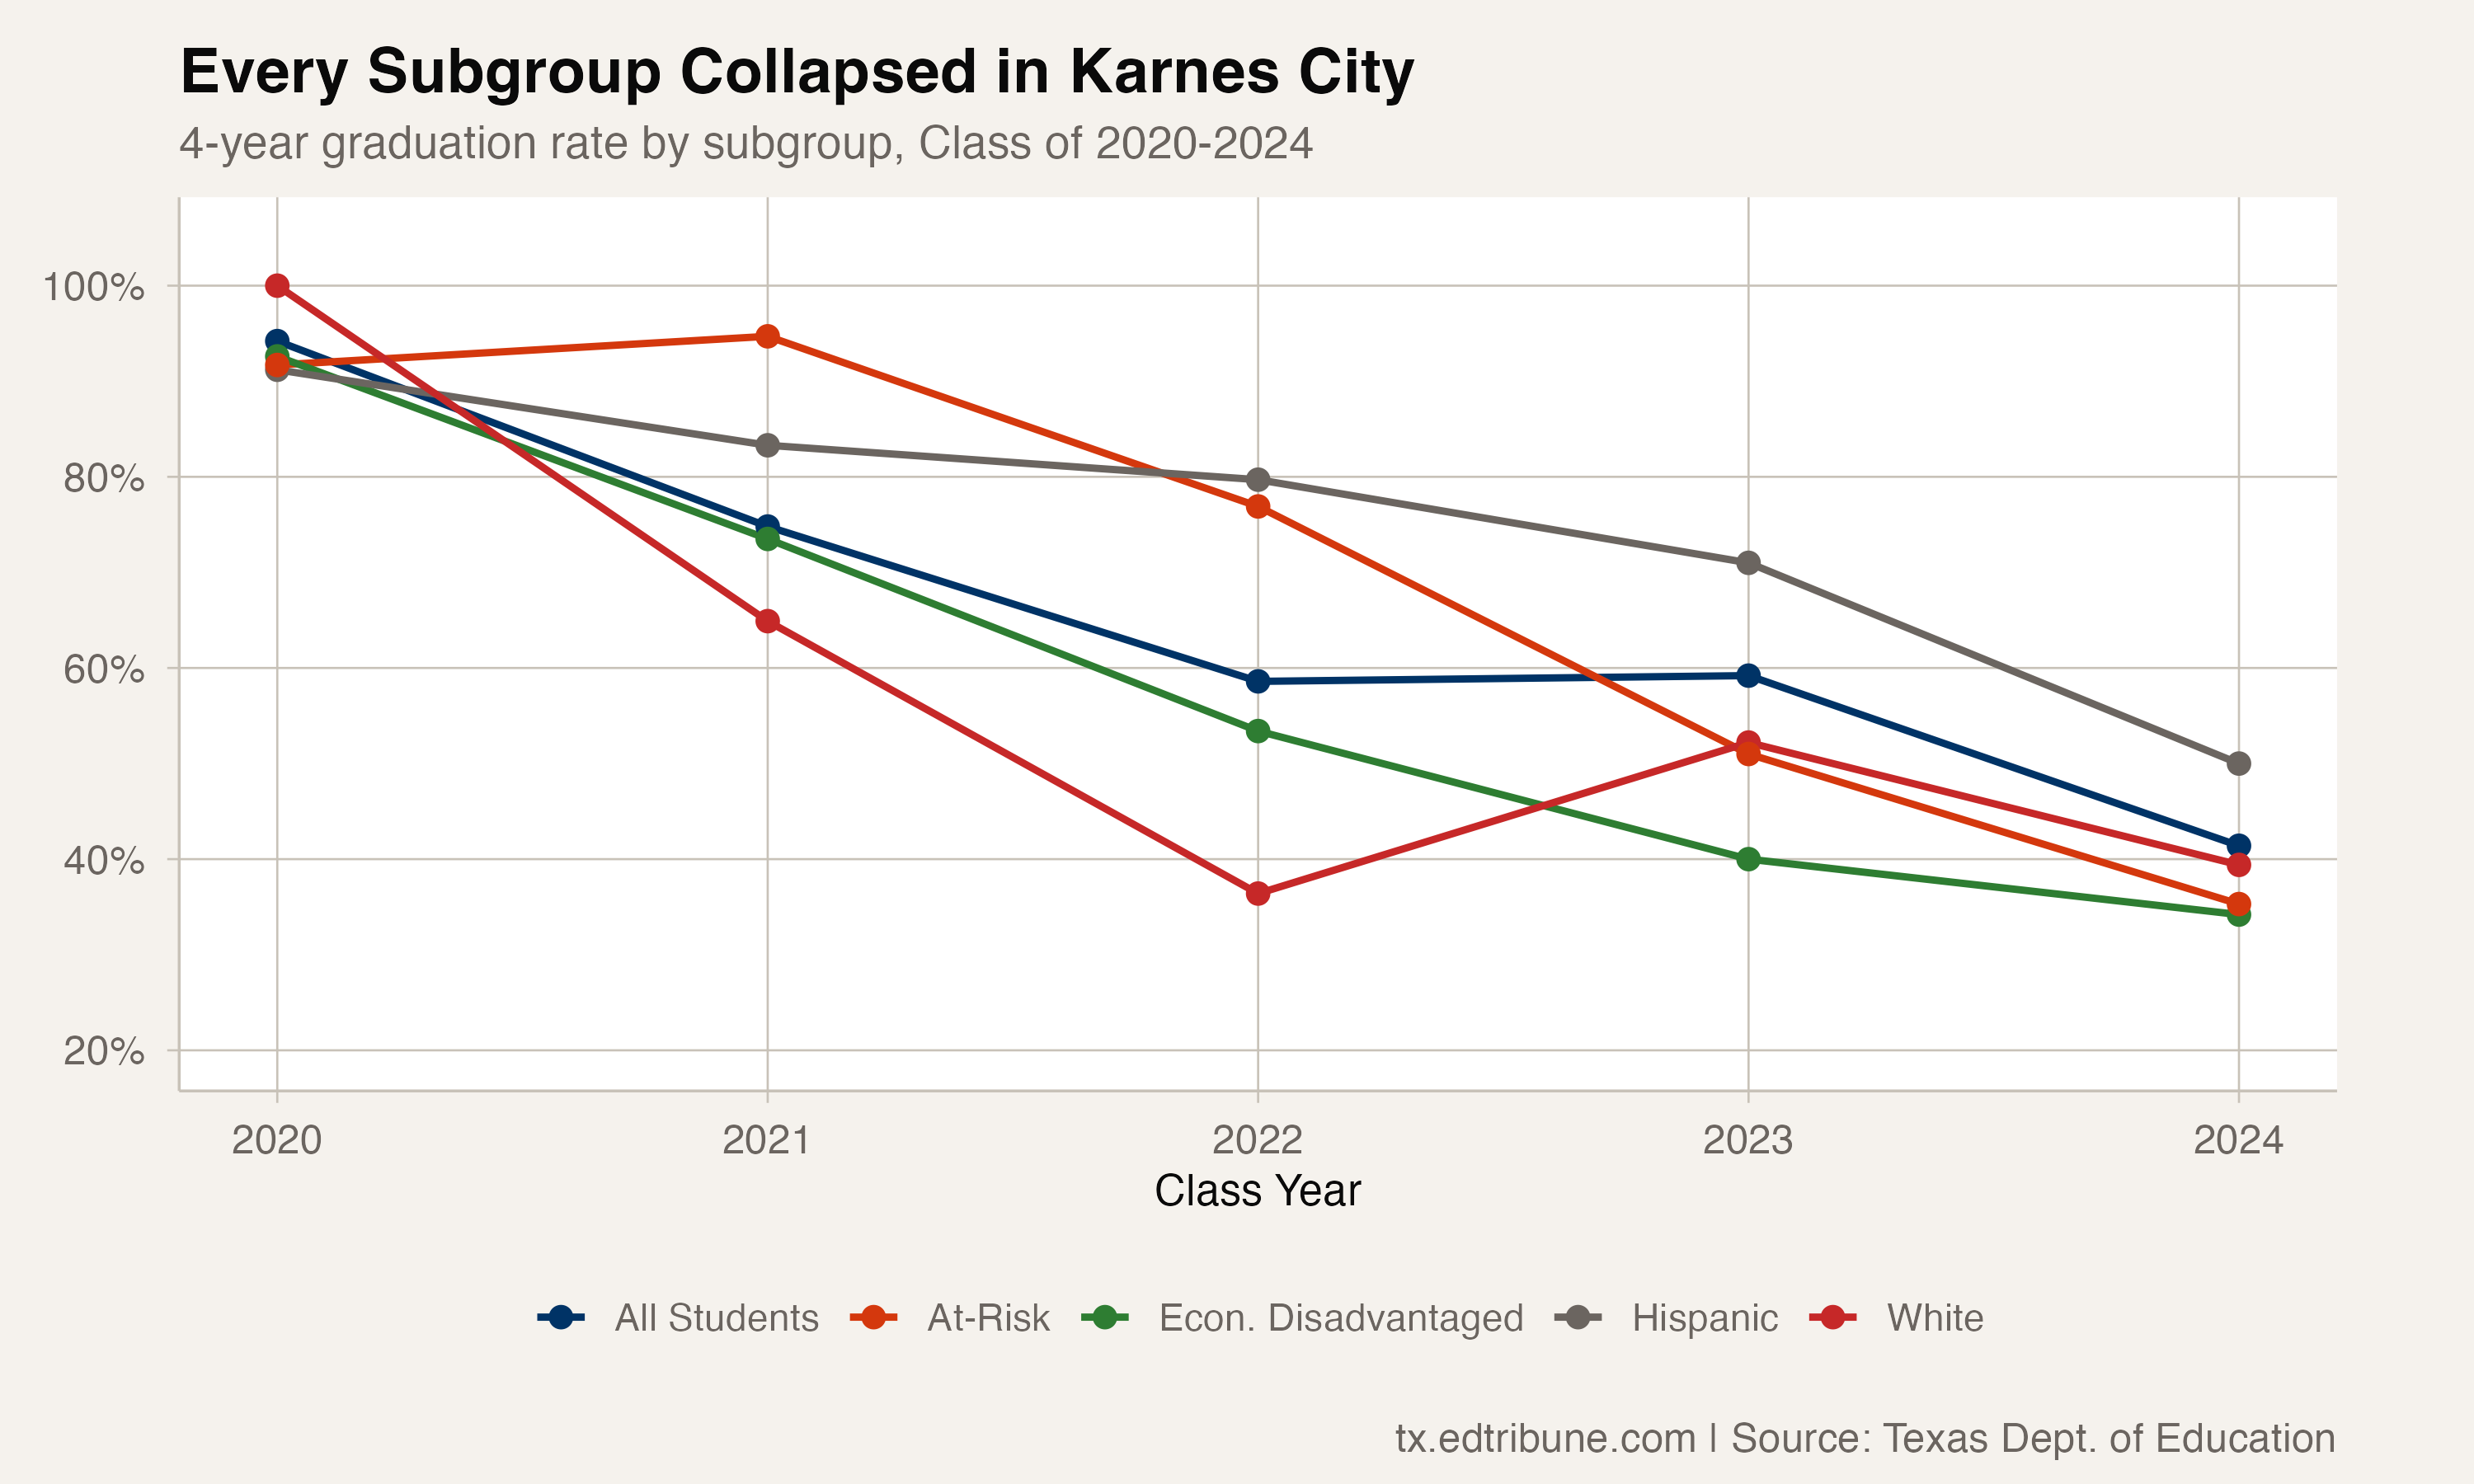
Students who were economically disadvantaged saw their reported graduation rate fall from 92.6% to 34.2%. Students identified as at risk went from 91.7% to 35.3%, following a path of 91.7% in 2020, 94.7% in 2021, 76.9%, 51.0%, and 35.3%.
The rate for White students fell from 100% to 39.4%; for Hispanic students, it fell from 91.2% to 50.0%. Economic-status and at-risk groups overlap with racial and ethnic groups. These are separate outcome comparisons, rather than parts that sum to a student body.
The district comparisons
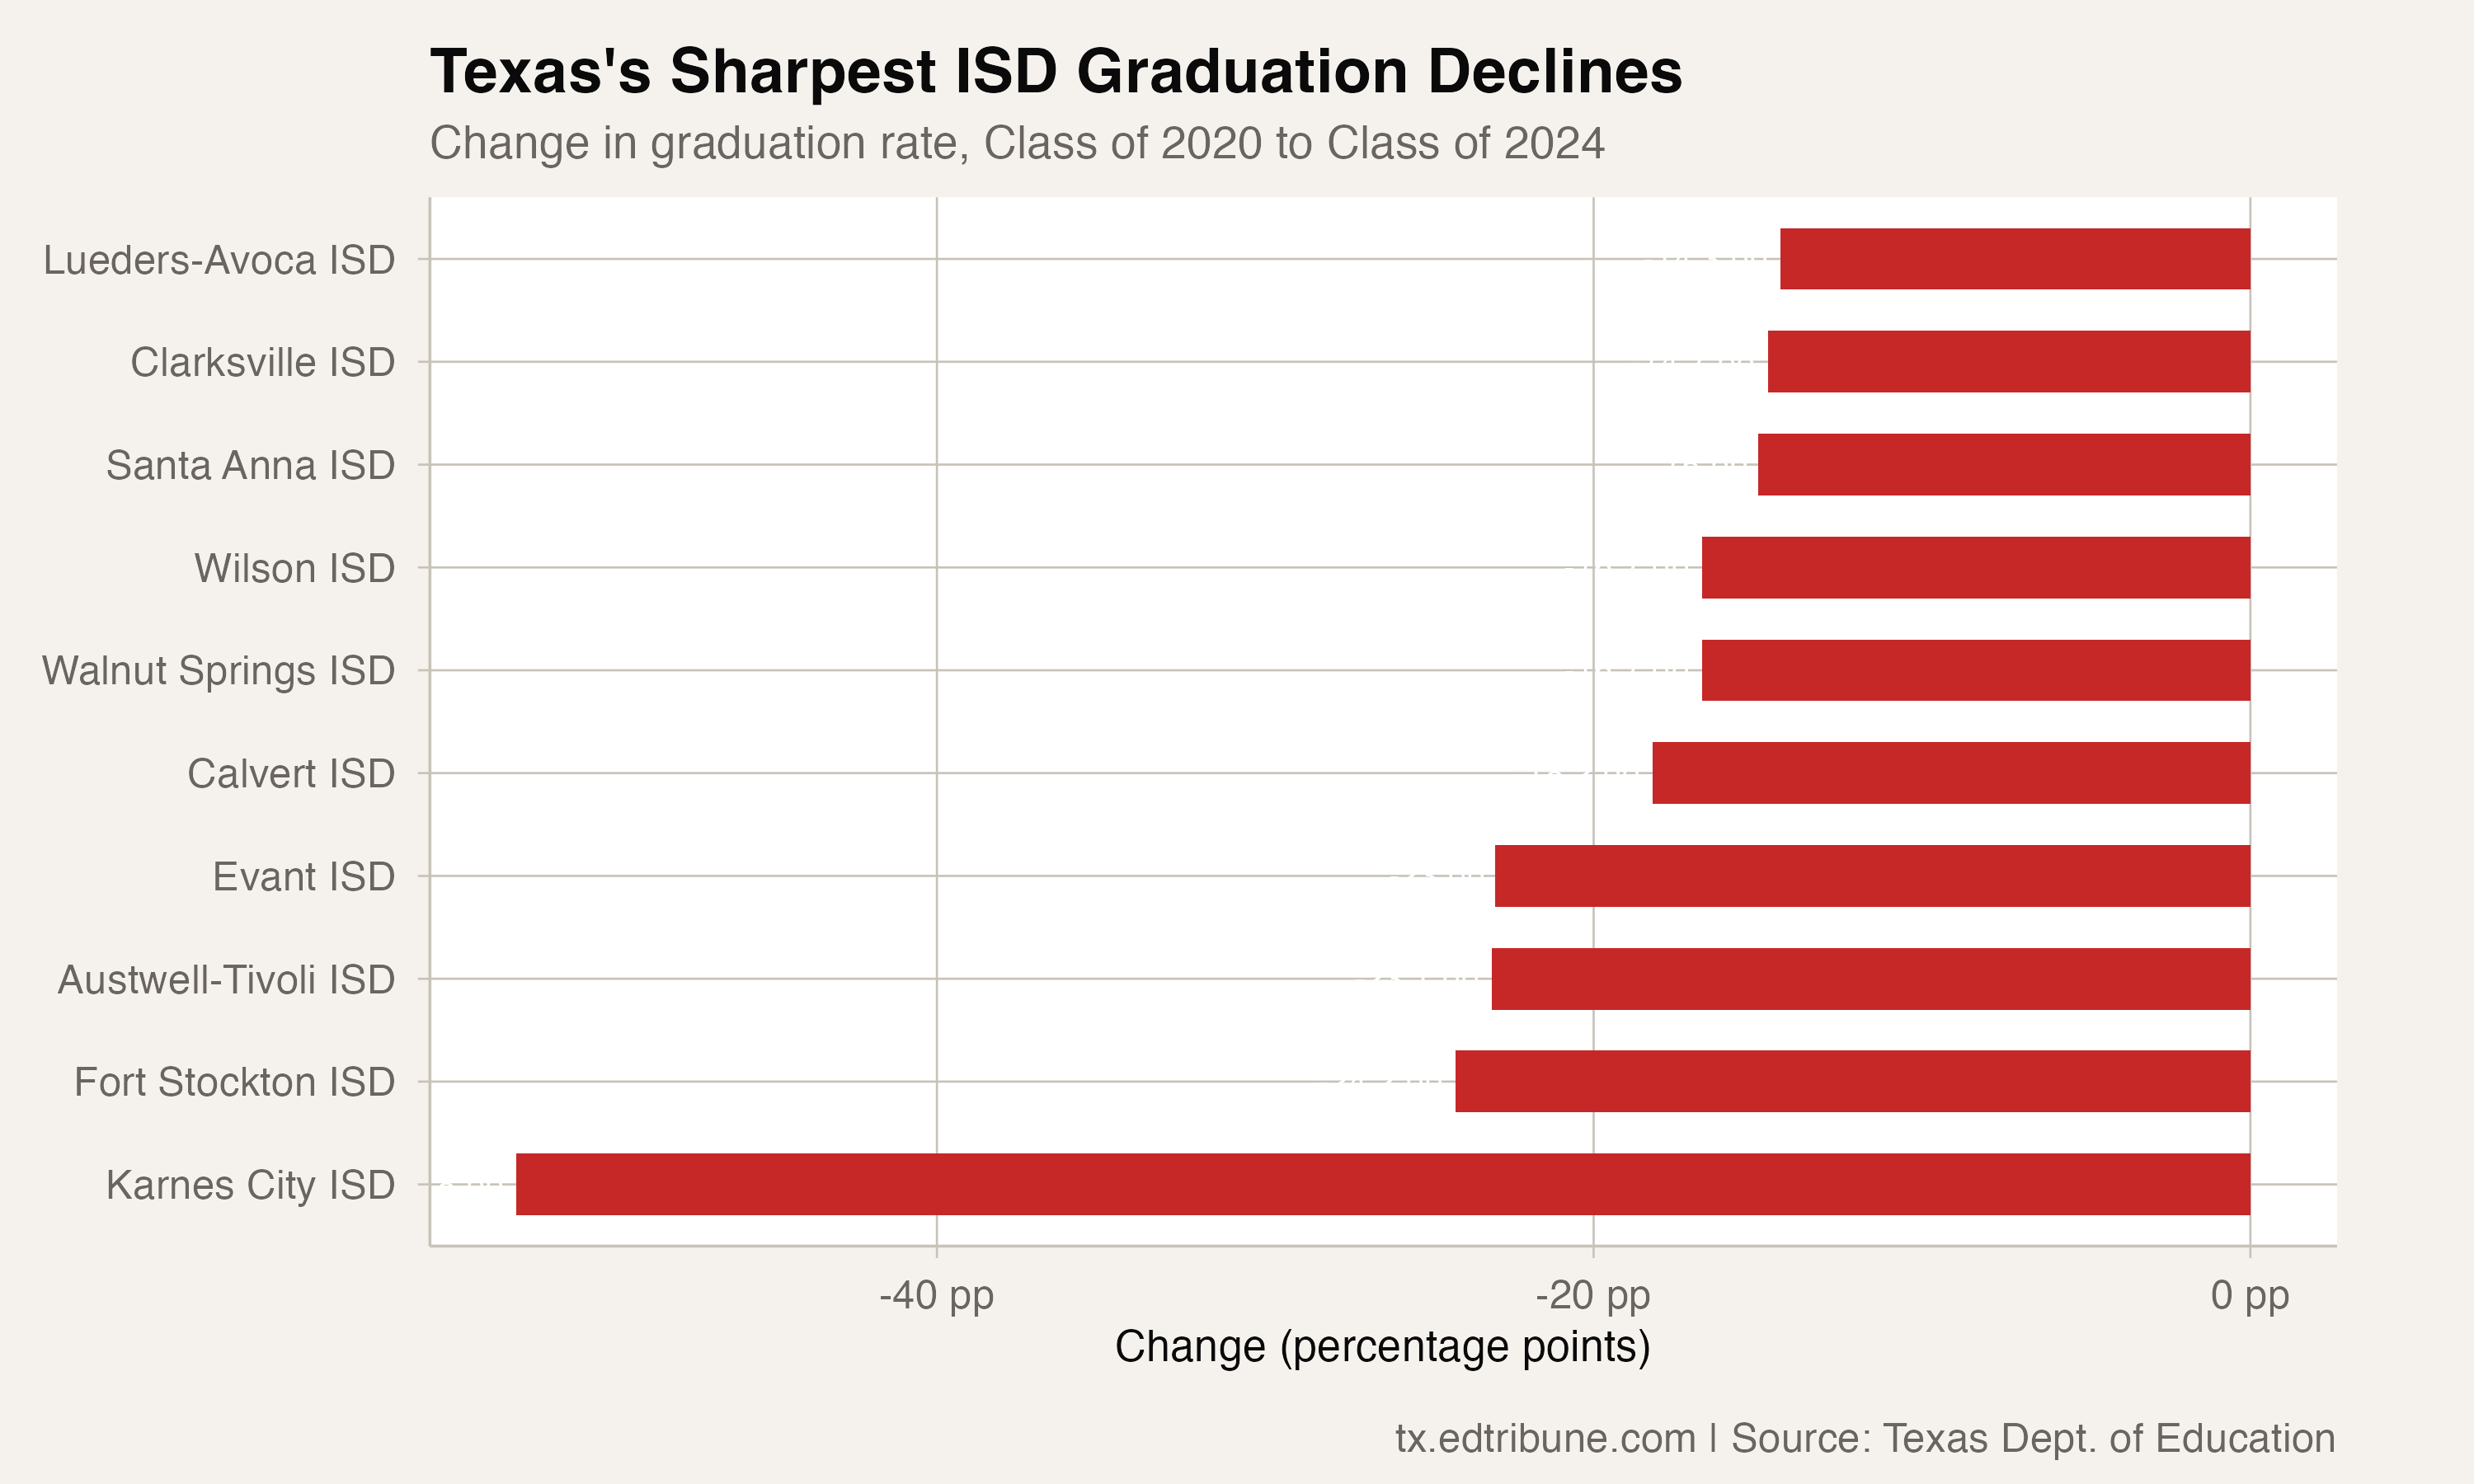
Fort Stockton ISD dropped 24.2 points to 67.6%. Austwell-Tivoli ISD fell 23.1 points to 76.9%. Evant ISD lost 23.0 points to 71.4%. Each ended above Karnes City's reported rate.
At 41.4%, Karnes City's rate was the lowest among the 960 district records with names ending in ISD or CISD and a reported Class of 2024 rate. The decline comparisons use only districts with reported rates at both endpoints; they do not fill missing records.
The rates come from the Texas Education Agency's graduation records. They establish the scale and timing of the change. They do not establish its cause or show which district response would improve the next result.
Detailed code that reproduces the analysis and figures in this article is available exclusively to EdTribune subscribers.
Discussion
Sign in to join the discussion.
Loading comments...