Correction: An earlier version understated reported graduation rates and gaps and incorrectly described some subgroup rates as unavailable. The figures and interpretation have been corrected.
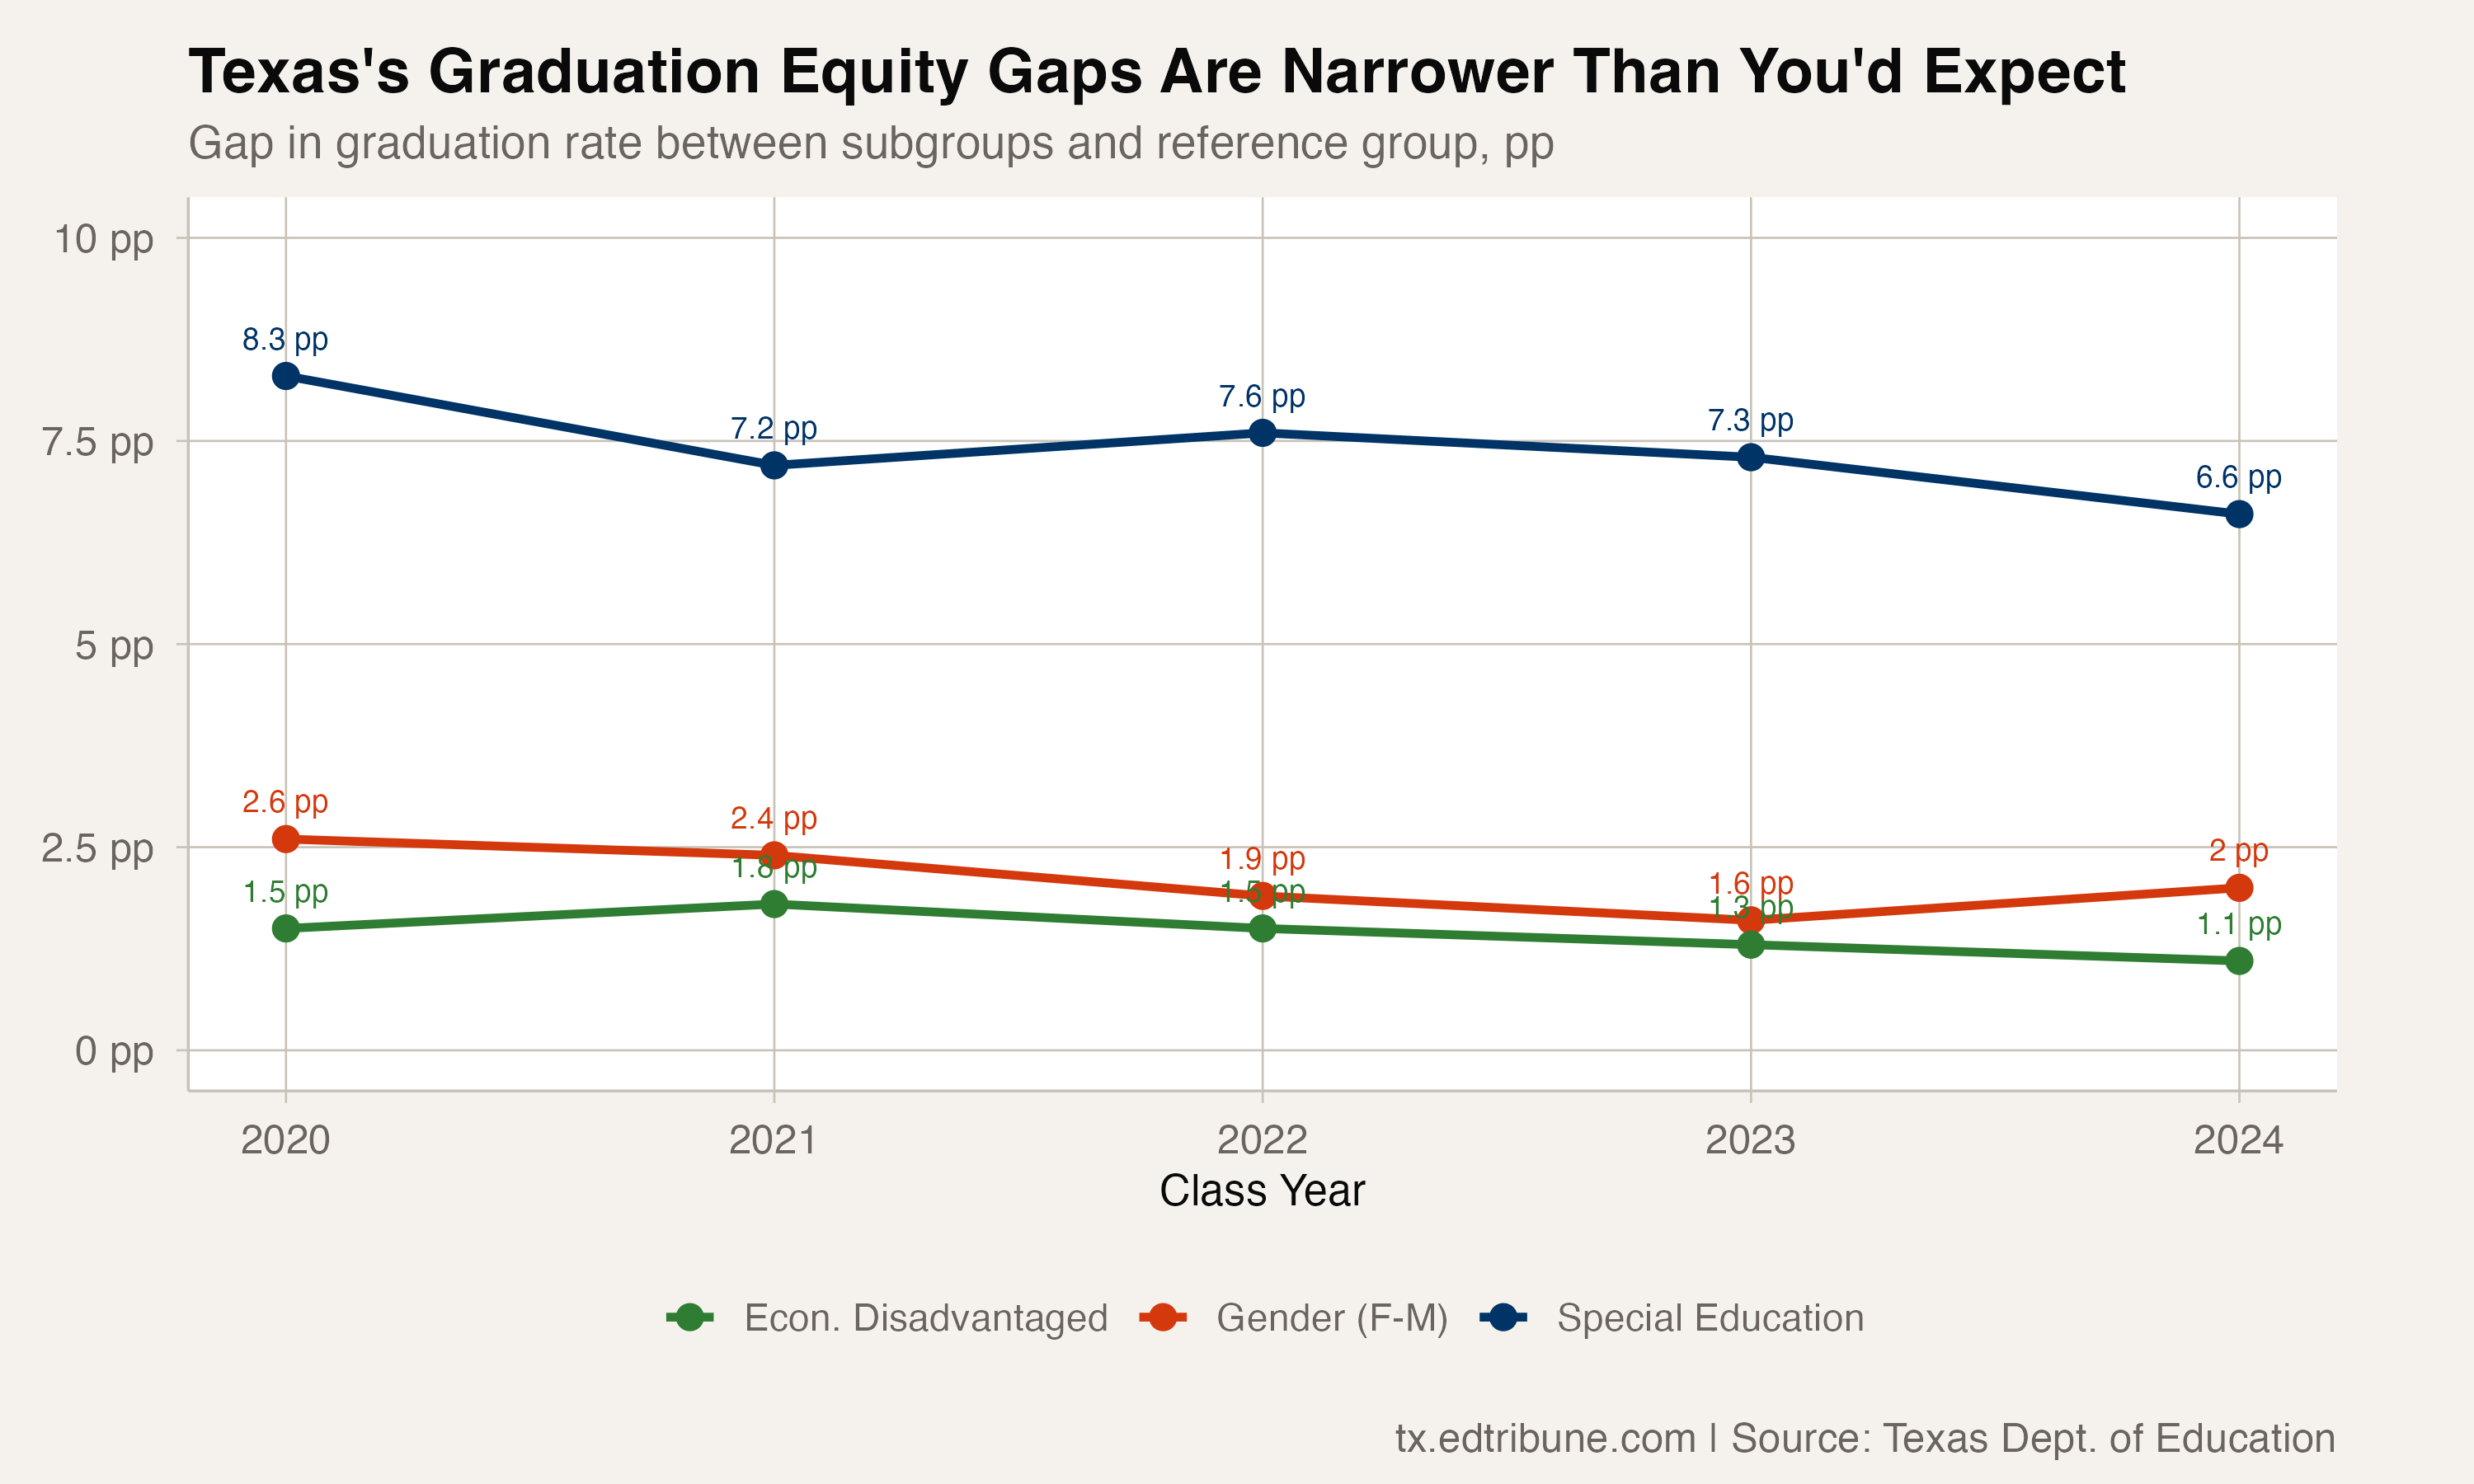
Texas's Class of 2024 graduation file tells an uneven equity story. Economically disadvantaged students trail the all-student rate by 2.5 percentage points. The special education gap is 9.9 points, and boys trail girls by 3.2 points. Across the 14 subgroups with published 2024 rates, the range is 16.3 points.
The poverty gap is smaller, but not steadily shrinking
Economically disadvantaged students graduated at 88.2% for the Class of 2024, compared with 90.7% for all students. The 2.5-point gap is slightly narrower than the 2.8-point gap in 2020.
That change was not steady: the gap widened to 3.3 points in both 2021 and 2022, then narrowed to 2.9 points in 2023 before reaching 2.5 in 2024. The graduation file reports the pattern but cannot explain it.
Special education: a five-year high, with a large gap
Special education students reached a five-year high of 80.9% for the Class of 2024, up from 78.8% in 2020. The gap with all students narrowed from 11.5 points to 9.9 points over that span, though it did not narrow every year.
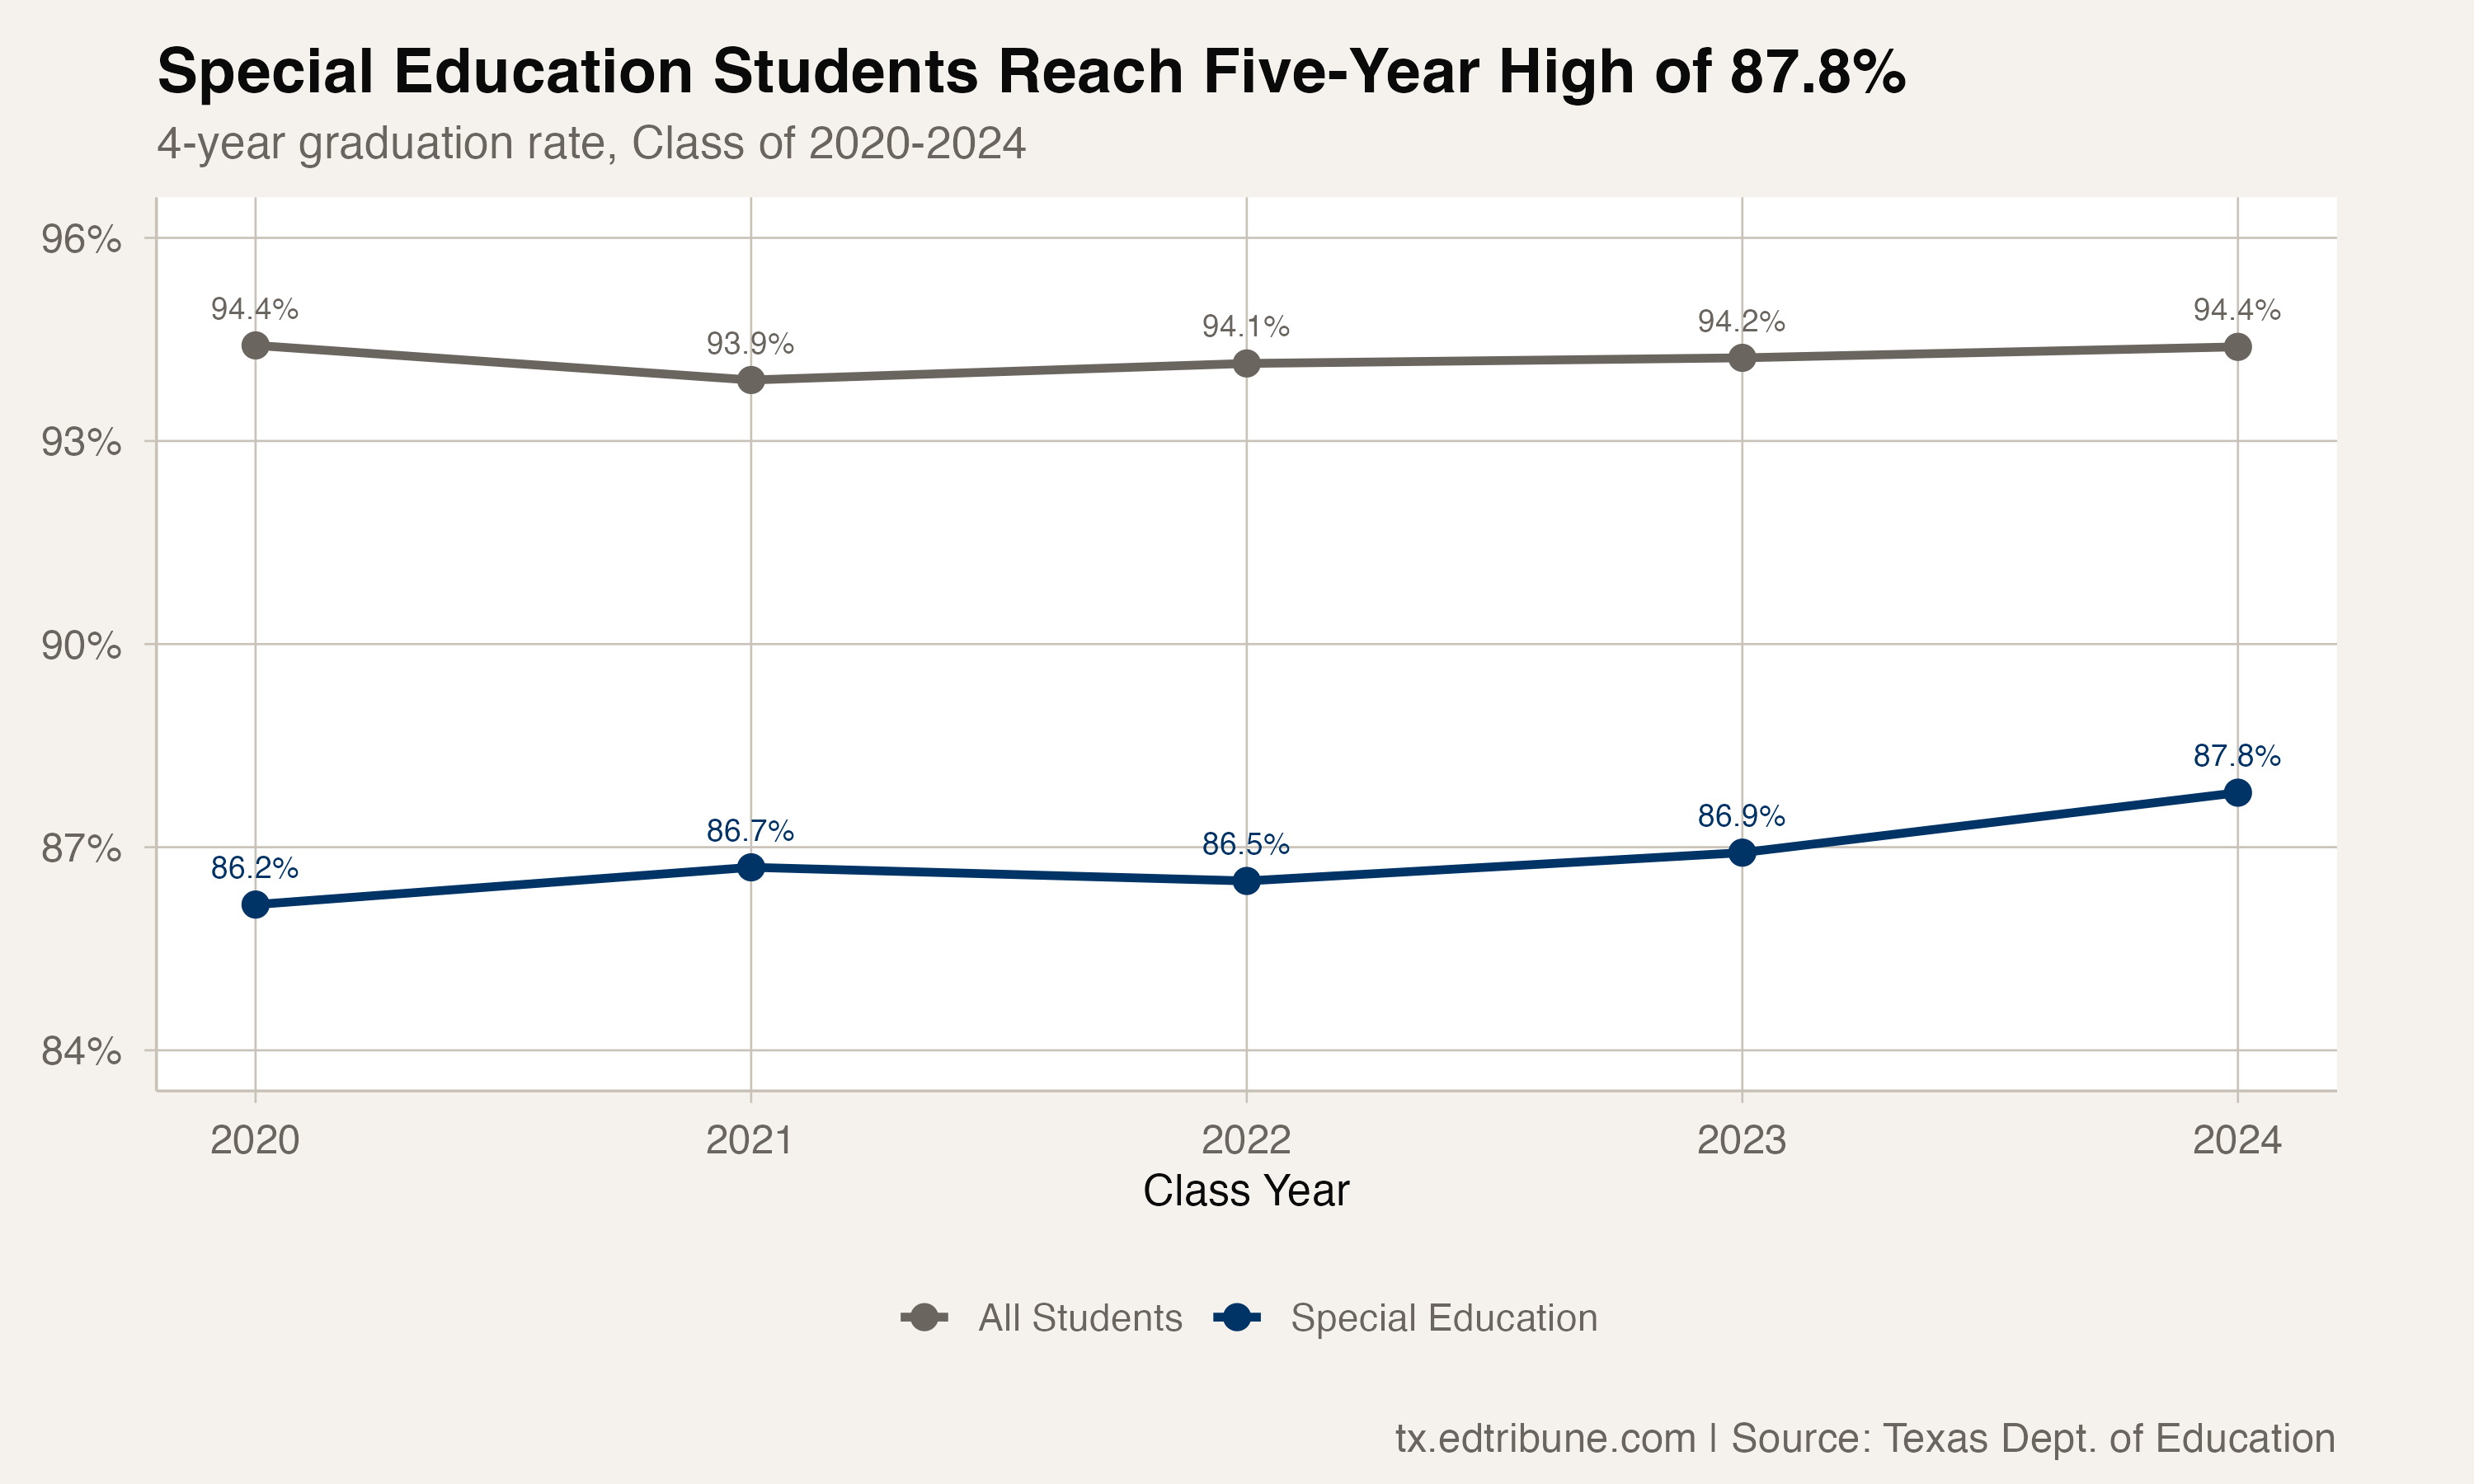
At the district level, the gap varies widely. Among districts with both rates published for 2024, London ISD↗ET had the widest special education gap at 37.7 points, with a 60.0% special education graduation rate against a 97.7% overall rate. Rockdale ISD↗ET had a 35.8-point gap.
The gender gap narrowed after first widening
Female students graduated at 92.4% in 2024, compared with 89.2% for male students. The 3.2-point gap is narrower than the 4.5-point gap in 2020, but it first widened to 4.7 points in 2021.
The subsequent decline in the gap is a reported pattern, not evidence about its cause.
What all the subgroups look like together
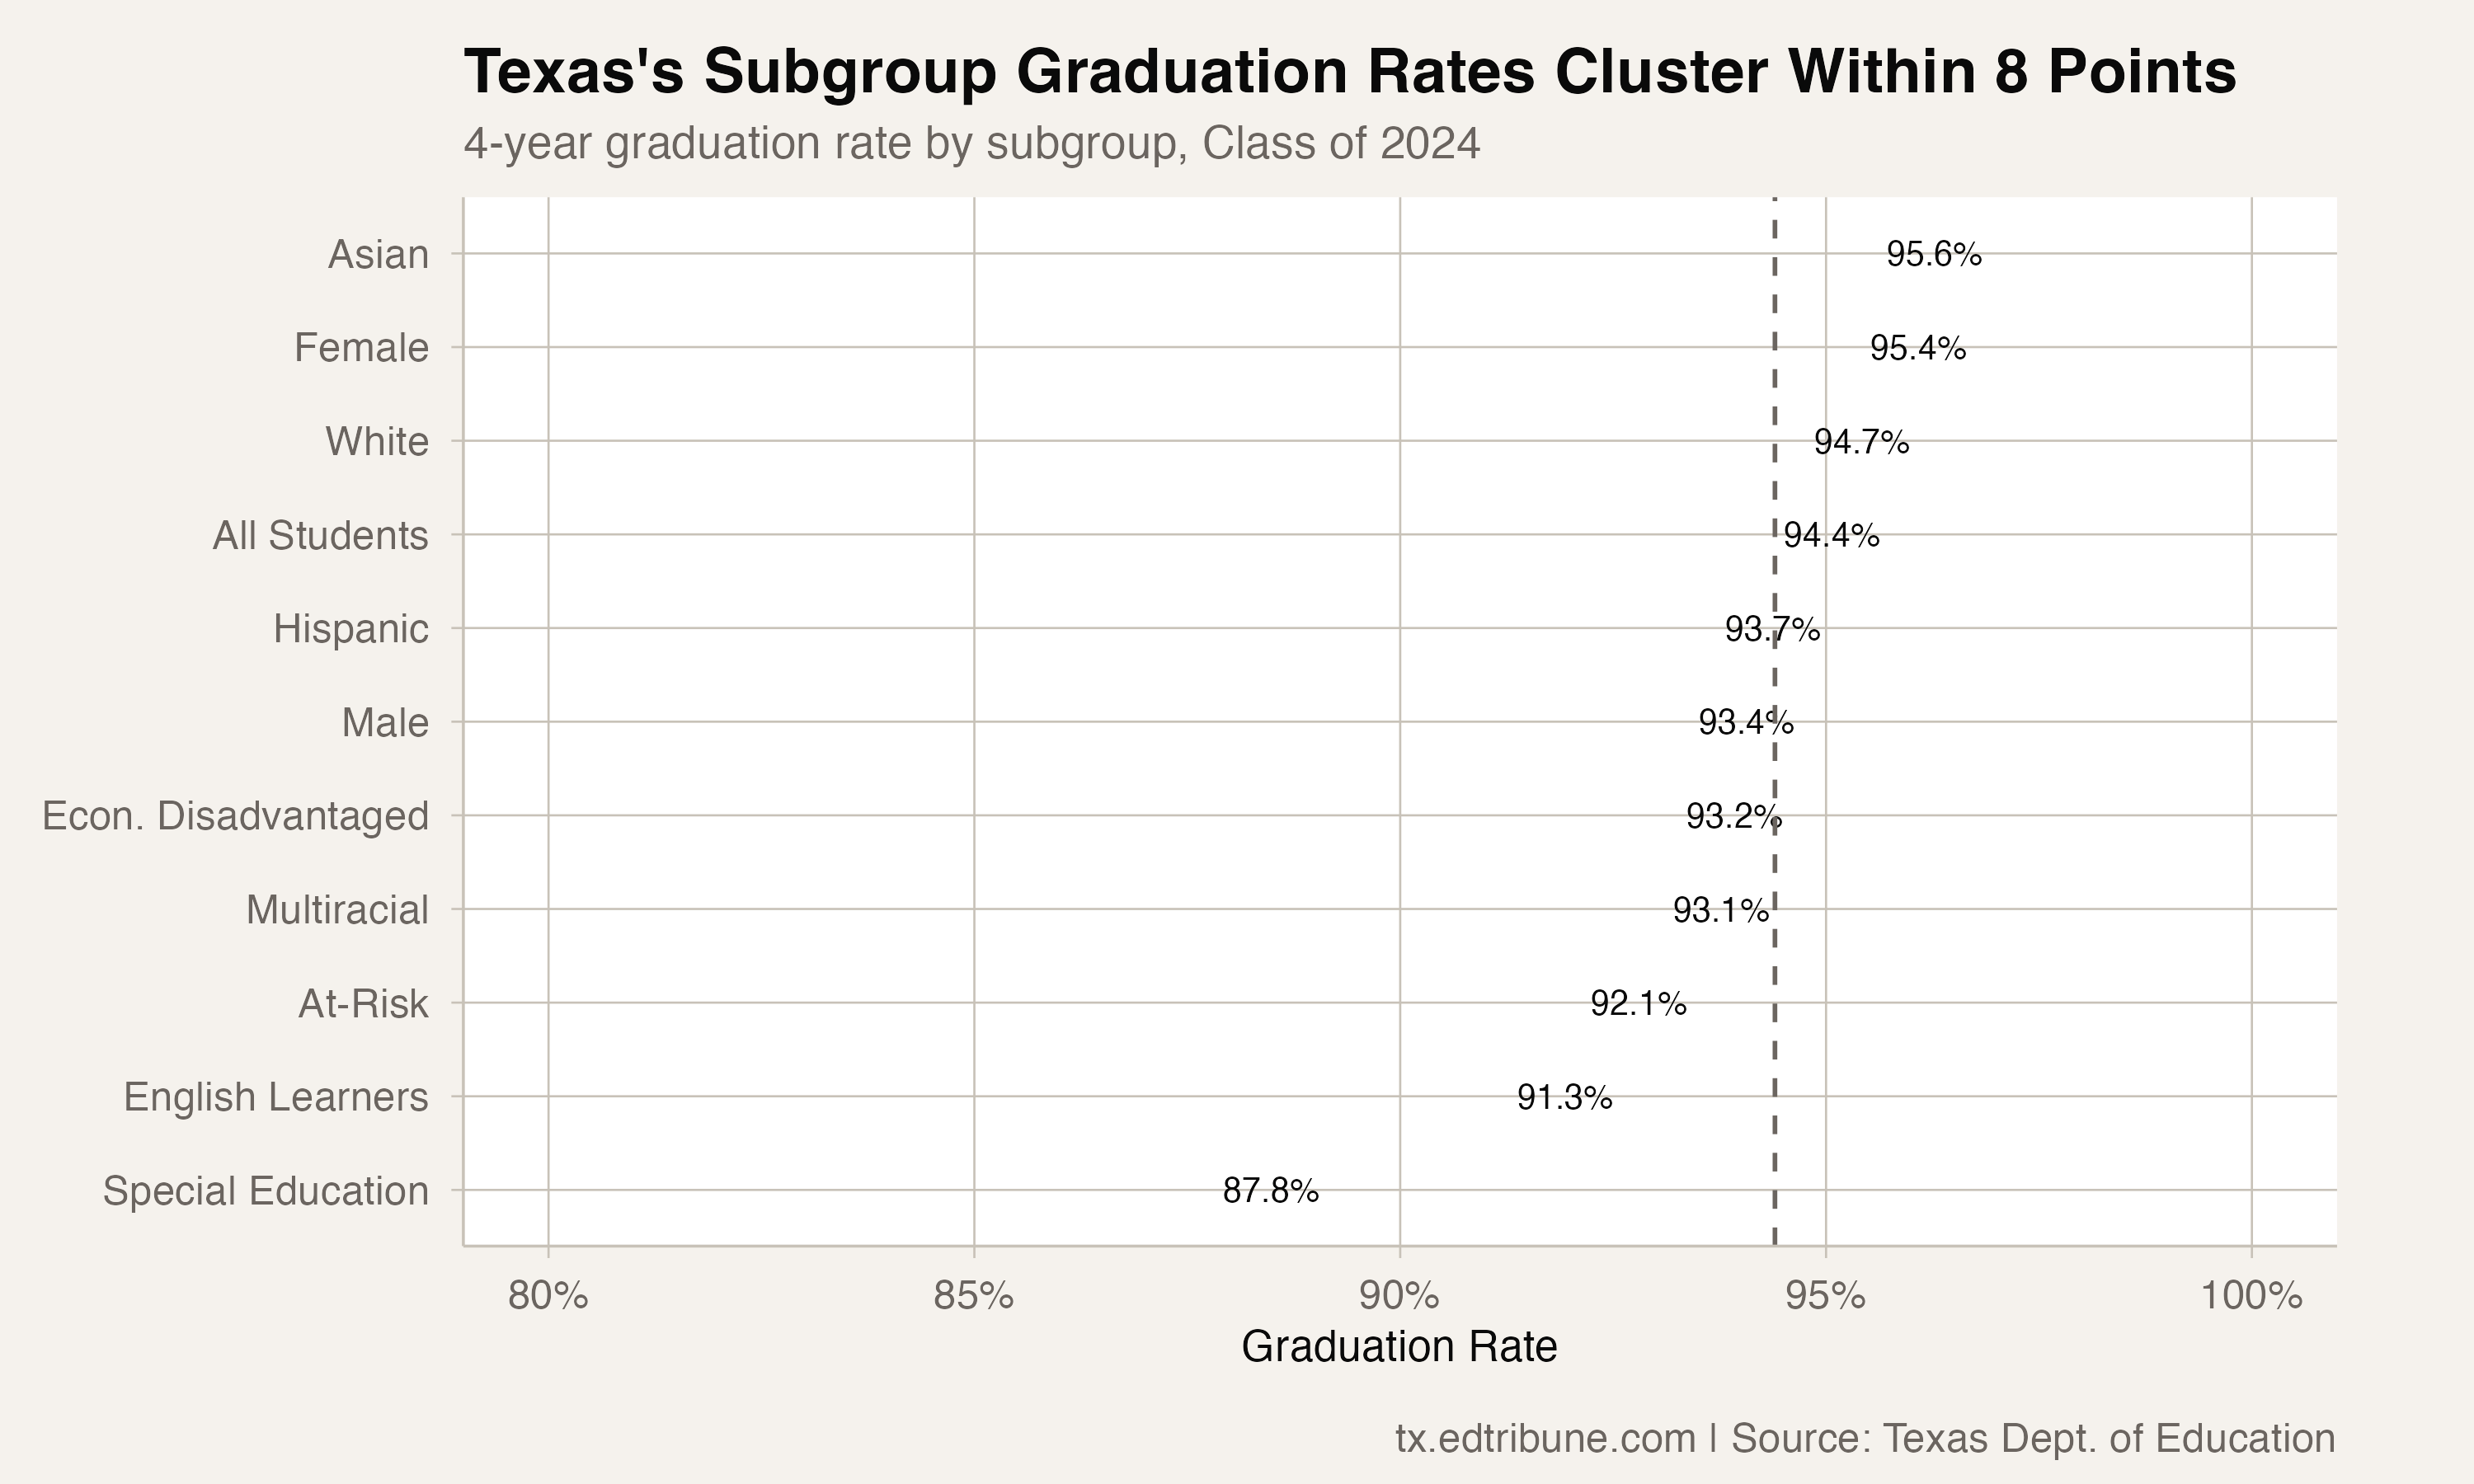
The 14 subgroups with available 2024 data span 16.3 percentage points, from Asian students at 97.1% to special education students at 80.9%.
At-risk students graduated at 86.9%, English learners at 85.7%, and economically disadvantaged students at 88.2%.
Reported racial gaps
The state reports Class of 2024 rates for Black and Native American students. Black students graduated at 86.9%, compared with 94.4% for white students, a 7.5-point gap. Native American students graduated at 88.8%, 5.6 points below the white rate.
The Texas Education Agency's graduation records provide the four-year cohort measures used here.
Detailed code that reproduces the analysis and figures in this article is available exclusively to EdTribune subscribers.
Discussion
Sign in to join the discussion.
Loading comments...