Retraction, July 24, 2026. An earlier version of this article, first published on April 28, 2026, under the headline "The Invisible Students: Texas Reports No Graduation Data for Black and Native American Students," was wrong in its central claim. We reported that the Texas Education Agency publishes no graduation rates for Black and Native American students. That is false. Texas publishes those rates, and has for every year in the data we examined. We retract the article and apologize for the error.
What went wrong
The blank values that the earlier article treated as an absence in the state's data were produced by an error in our own data processing. The step that reads TEA's graduation files looked for the wrong column names for two groups, so it pulled back empty fields where the state had in fact reported complete rates. We mistook a defect in our tooling for a gap in the state's reporting, and built an entire article on it. Every graduation figure in the earlier version came through that same flawed step and should not be relied on.
What the data actually shows
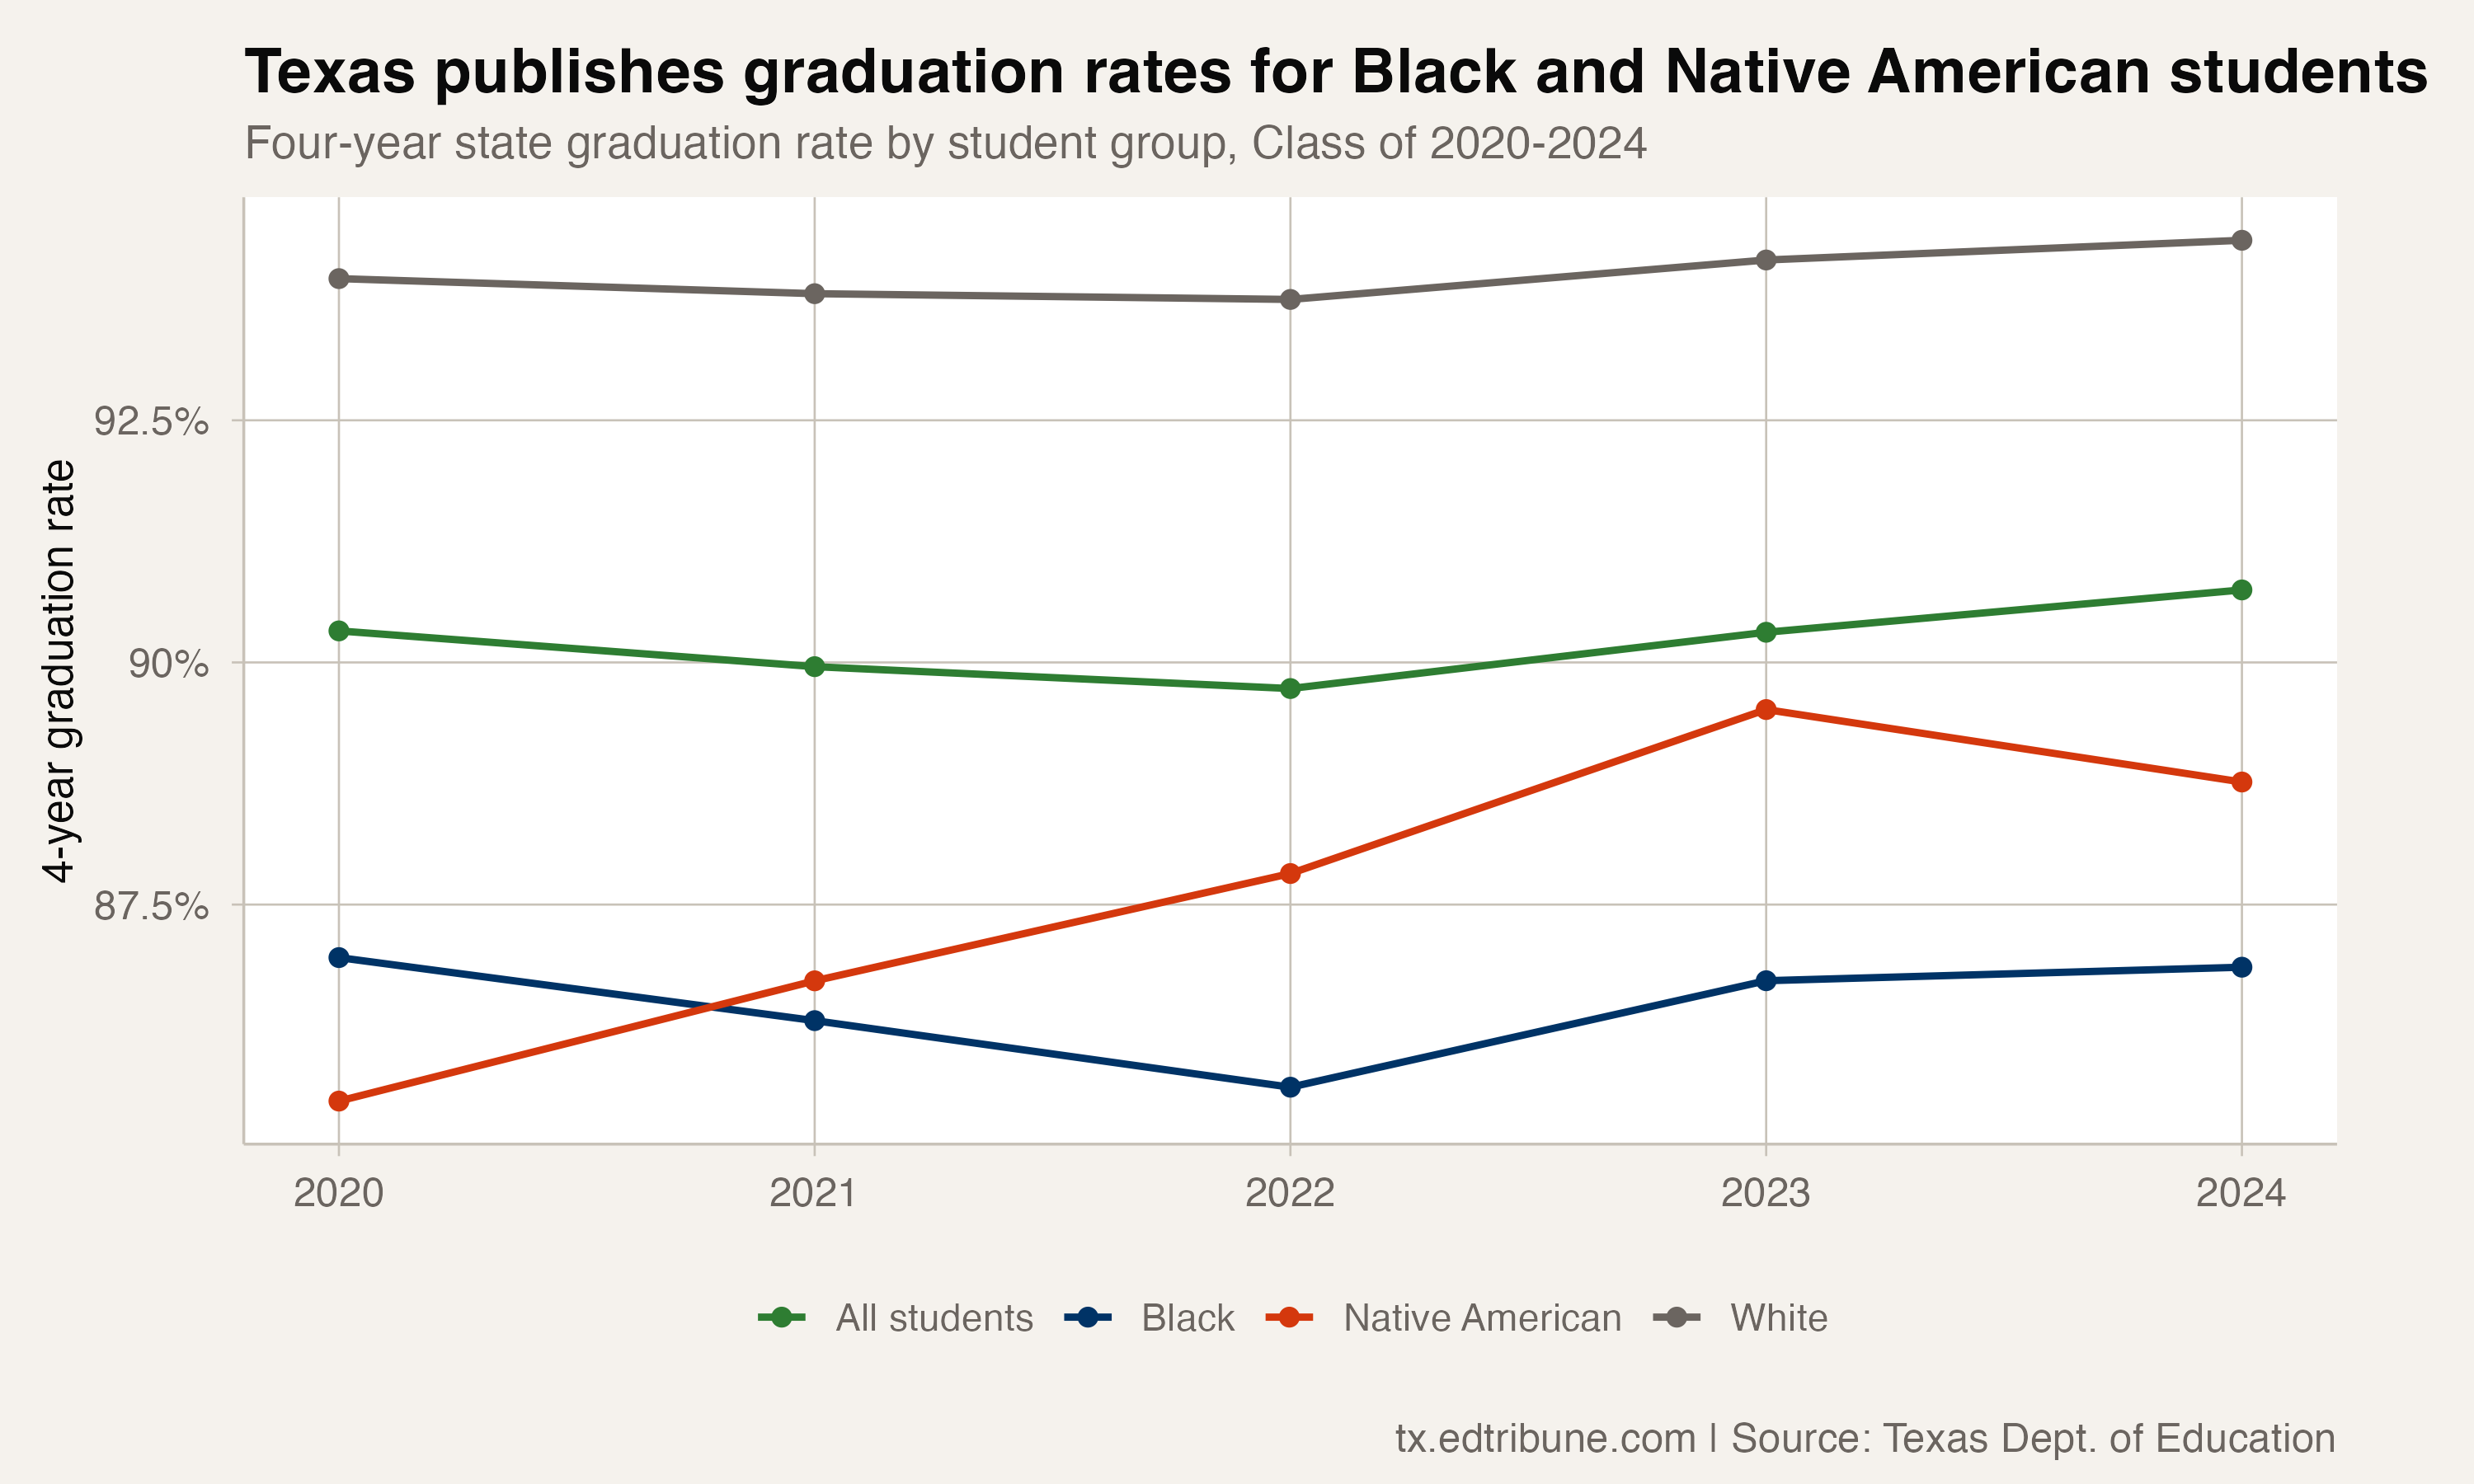
Corrected against the Texas Education Agency's published graduation files, Black and Native American students have reported four-year graduation rates in every year from the Class of 2020 through the Class of 2024:
- Black students graduated at 86.9% in the Class of 2024 (87.0% in 2020, 86.3% in 2021, 85.6% in 2022, 86.7% in 2023).
- Native American students graduated at 88.8% in the Class of 2024, up from 85.5% in 2020.
Against a statewide rate of 90.7% and a white-student rate of 94.4% in the Class of 2024, that leaves a Black-white graduation gap of about 7.5 points and a Native American-white gap of about 5.6 points. Those gaps are real, and they are exactly the kind of measure our earlier article wrongly said could not be computed from the state's data. It can, and we should have.
How this happened, and what we changed
The error reached publication because our fact-check verified the article's numbers against the same flawed processing that produced them, so the blank fields "checked out" against themselves. That is a failure of our verification, not of the state's data. We have corrected the underlying data-processing error and rewritten this article's fact-check to test against the state's actual published rates.
We are treating the accurate version of this story -- what Texas's graduation gaps for Black and Native American students actually are, and how they have moved -- as new reporting, and will publish it separately rather than under this corrected headline.
Detailed code that reproduces the analysis and figures in this article is available exclusively to EdTribune subscribers.
Discussion
Sign in to join the discussion.
Loading comments...