Correction (July 24, 2026): An earlier version of this article reported Texas's statewide graduation rate as 94.4%, a figure produced by averaging district rates without weighting for enrollment. Texas's actual federal four-year graduation rate, which weights by cohort size, was 90.7% for the Class of 2024. The statewide numbers, the national-average comparison, and the five-year panel high/low counts have been corrected. The district-level distribution figures were unaffected.
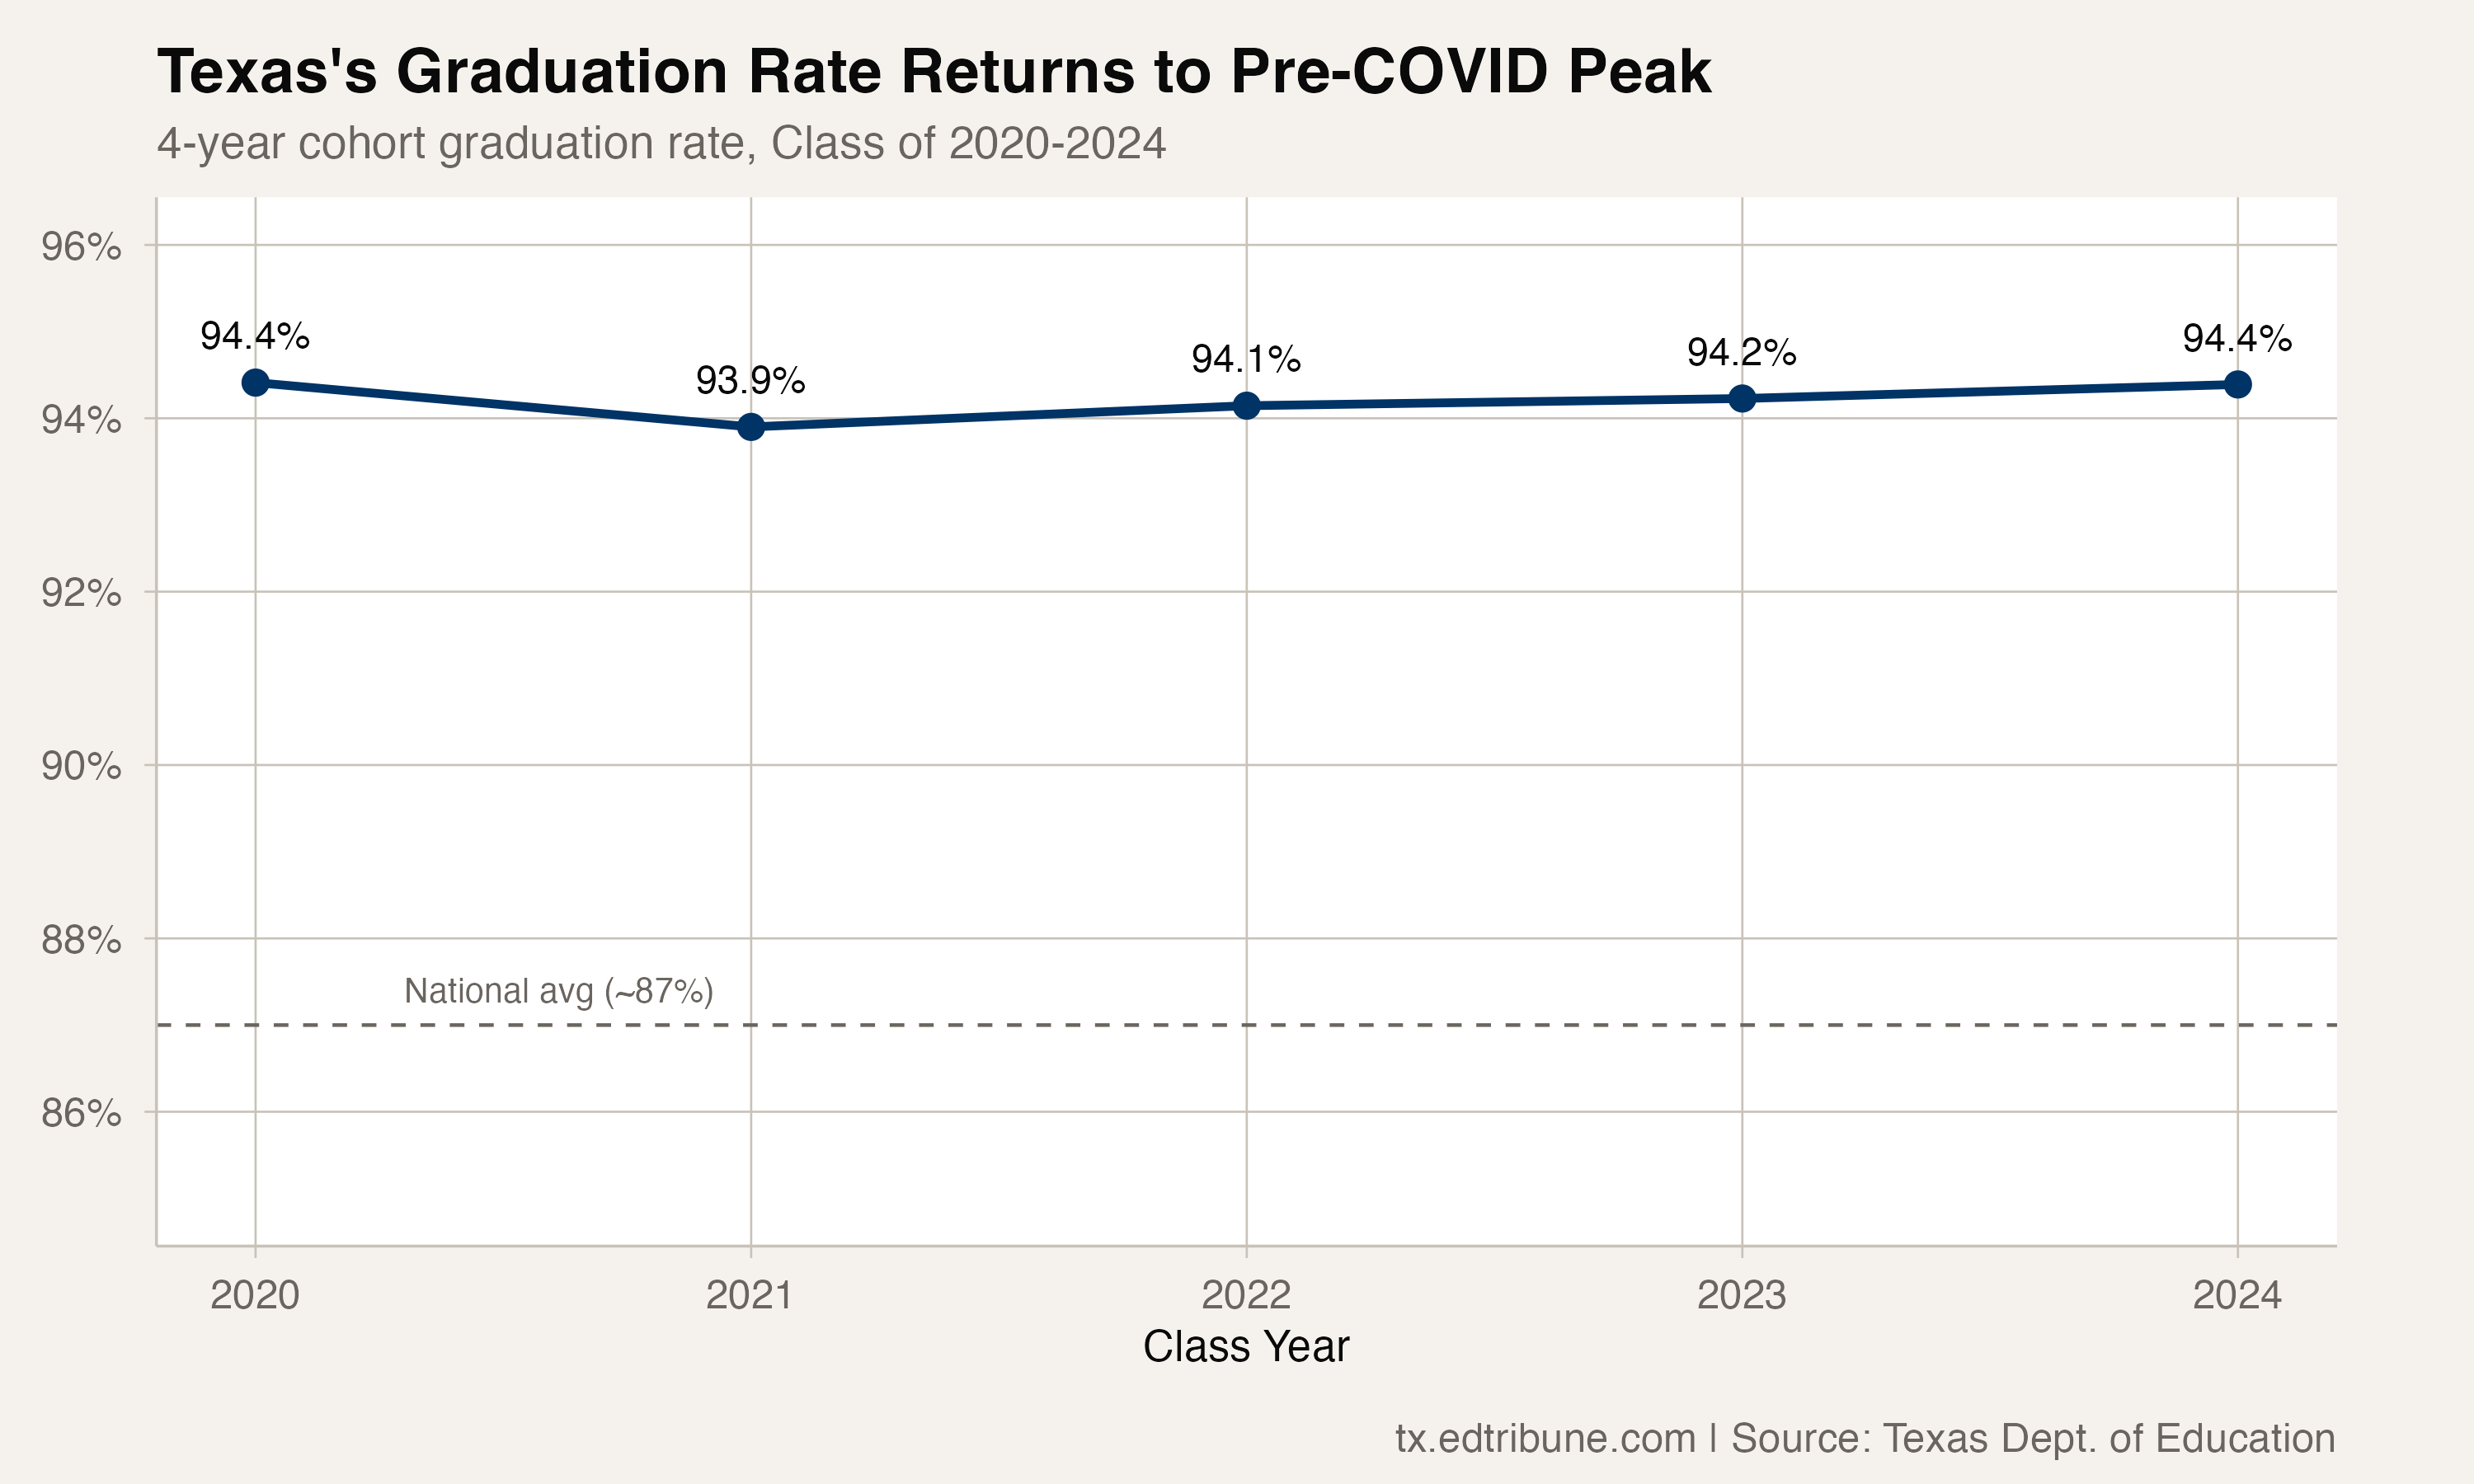
Texas's statewide four-year graduation rate reached 90.7% for the Class of 2024, edging past its pre-COVID level after recovering from a shallow pandemic dip and sitting about 3.7 percentage points above the national average of roughly 87%. The recovery from the 2022 low of 89.7% is now complete.
But the number that matters to the 26 districts graduating fewer than 70% of their students is not the one on the state summary.
A remarkably narrow band
What stands out about Texas's statewide graduation rate is not just how high it is, but how stable. Over five years, the total range of movement spans a single percentage point: from 89.7% (Class of 2022) to 90.7% (Class of 2024). The COVID dip, which in some states produced five- or ten-point swings depending on whether requirements were waived, barely registered in Texas. The state did not relax graduation requirements during the pandemic, which makes its numbers more reliable than in many states.
The trajectory since the 2022 trough has been steady: 90.3% in 2023, 90.7% in 2024. Each year added roughly half a point. Whether 90.7% represents a ceiling or a waypoint depends on the district-level picture.
The top is very crowded
Of the 1,069 districts reporting graduation data for the Class of 2024, 699 graduated 95% or more of their students. That is 65.4% of all districts. Among those, 276 posted a perfect 100% graduation rate.
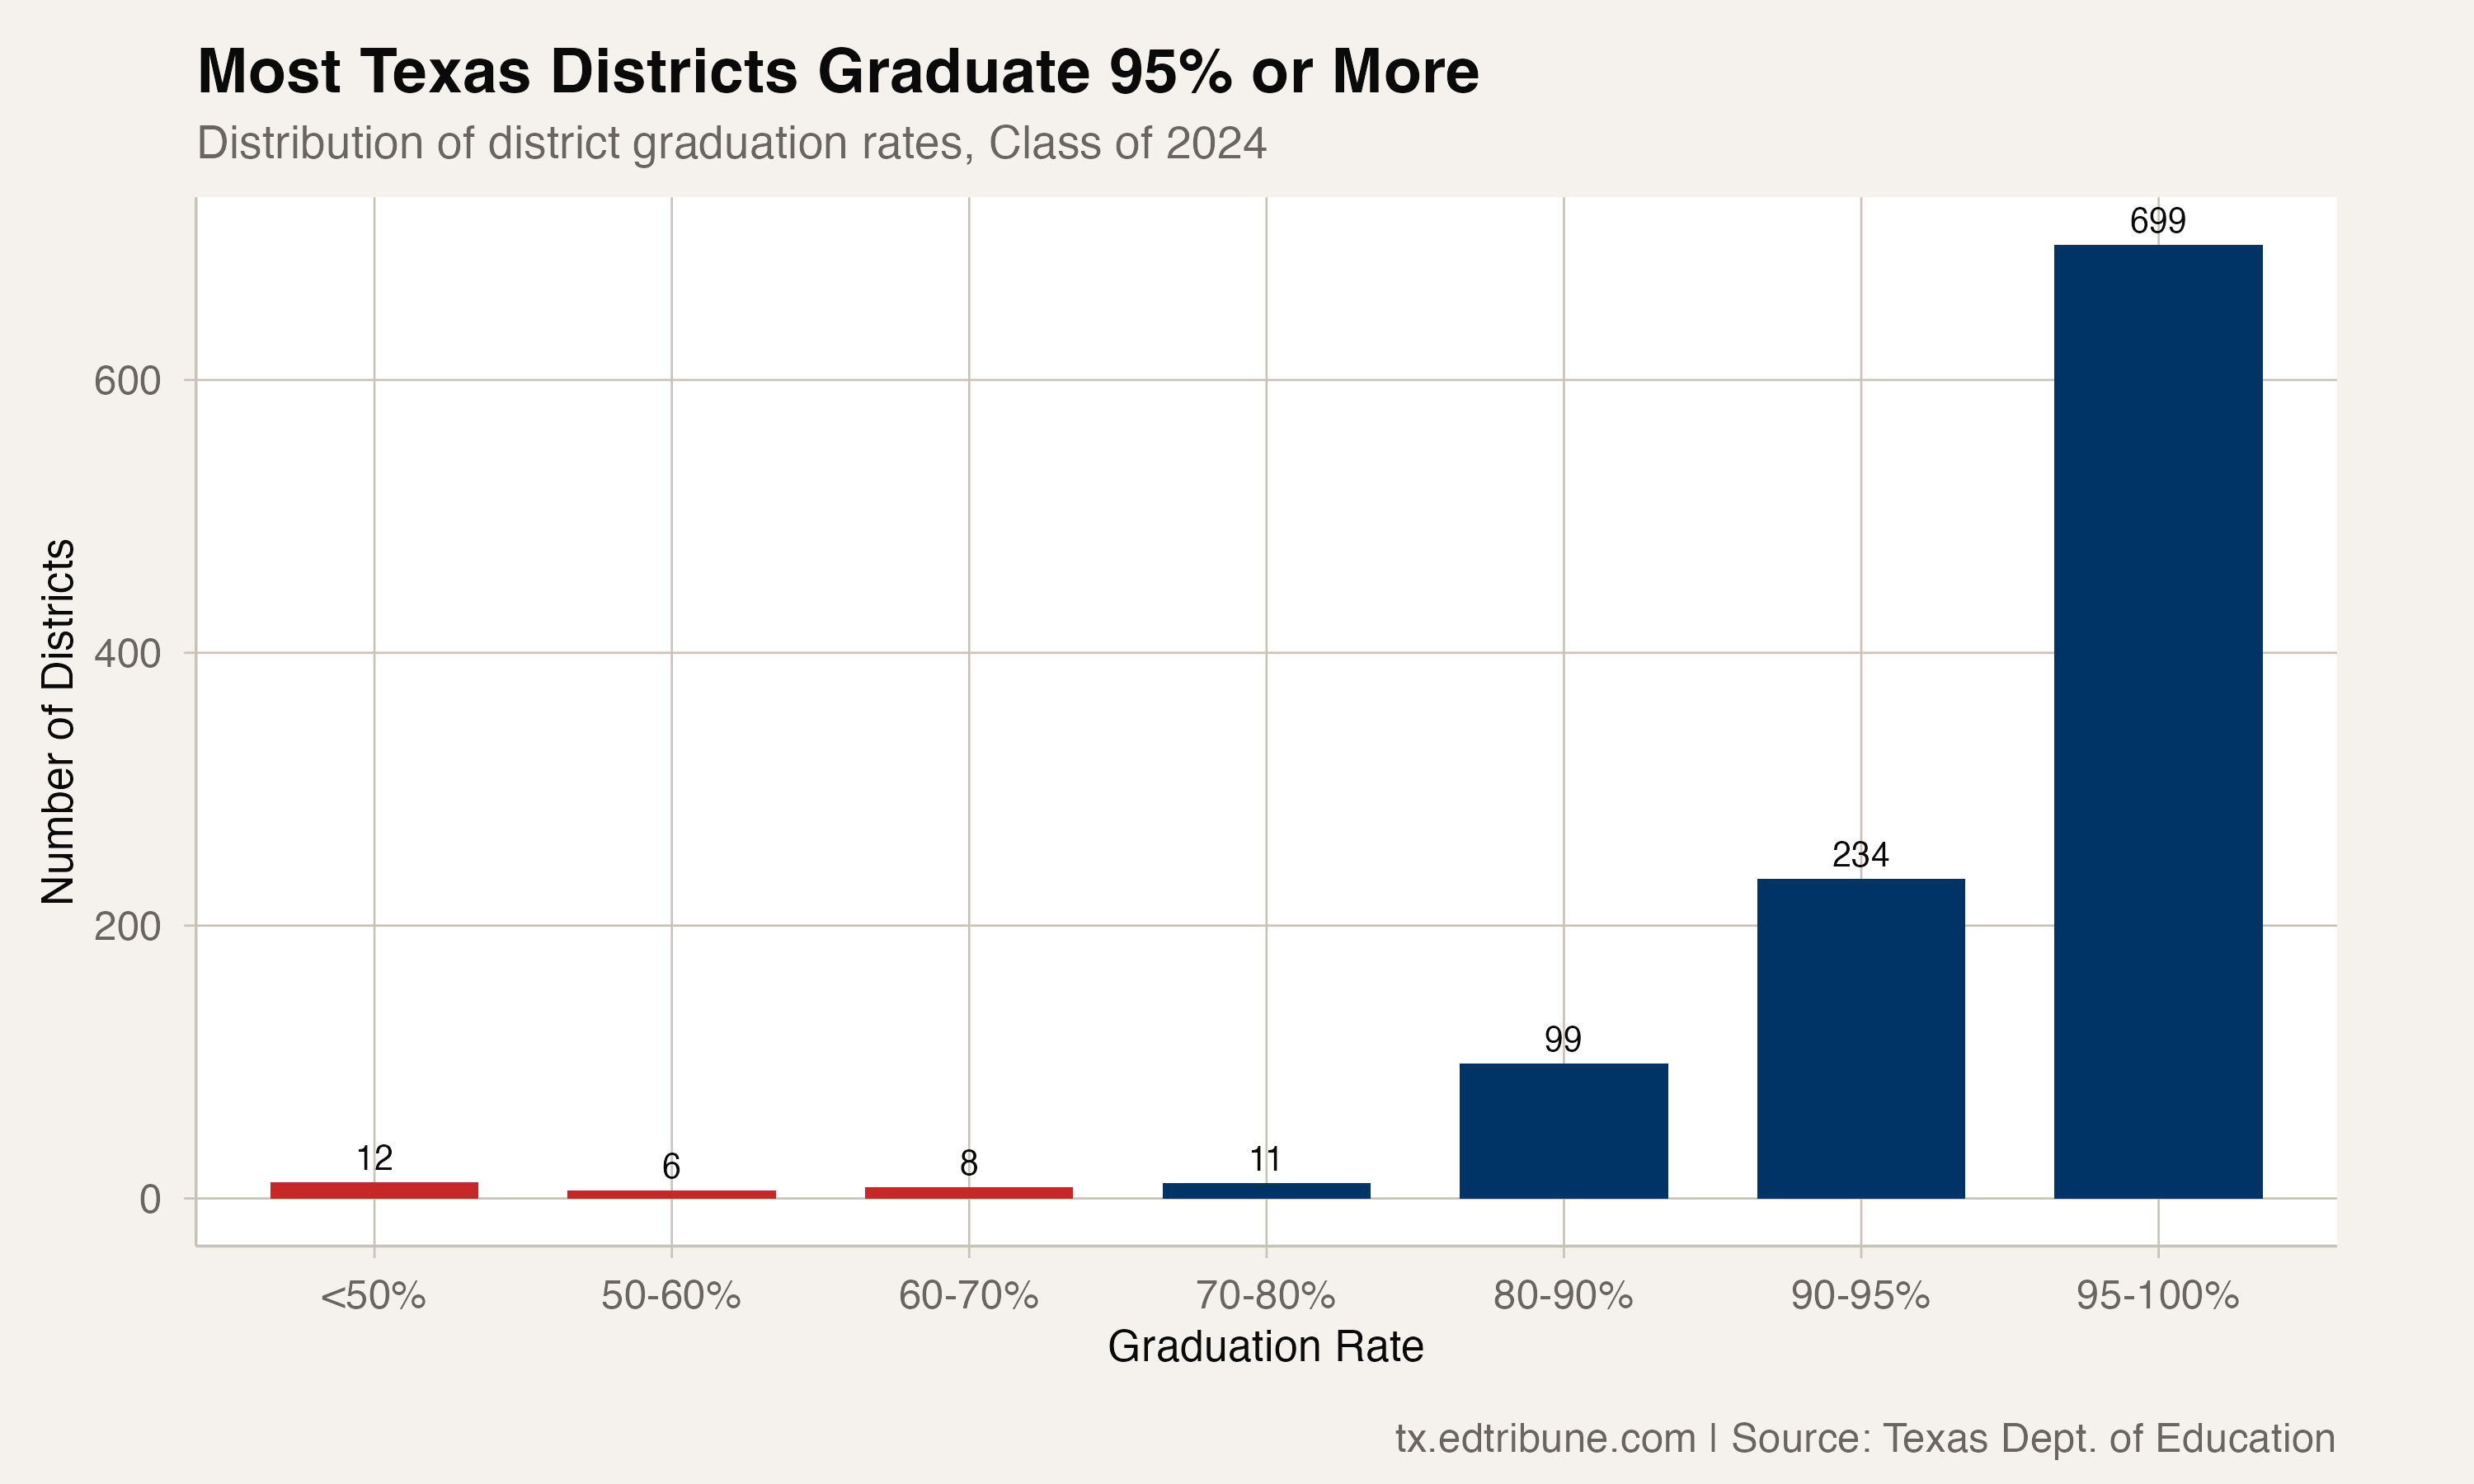
The median district graduation rate of 96.8% exceeds the enrollment-weighted state rate of 90.7%, which is pulled down by the handful of large, lower-performing districts and the tail of charter and alternative schools at the bottom. The distribution is extremely top-heavy: nearly two-thirds of Texas districts are at or above 95%.
The floor is further away than it looks
Twenty-six districts graduated fewer than 70% of their students, a threshold that the Texas Education Agency considers an accountability concern. Of those 26, only four are traditional independent school districts: Karnes City ISD↗ET at 41.4%, Fort Stockton ISD↗ET at 67.6%, Hallsville ISD↗ET at 67.9%, and Edgewood ISD↗ET at 69.9%.
The other 22 are charter or alternative schools, many of which serve dropout recovery populations. Academy for Academic Excellence and Excel Academy both reported 0% graduation rates. Texans Can Academies, one of the state's largest dropout recovery networks, graduated 18.5% of its students.
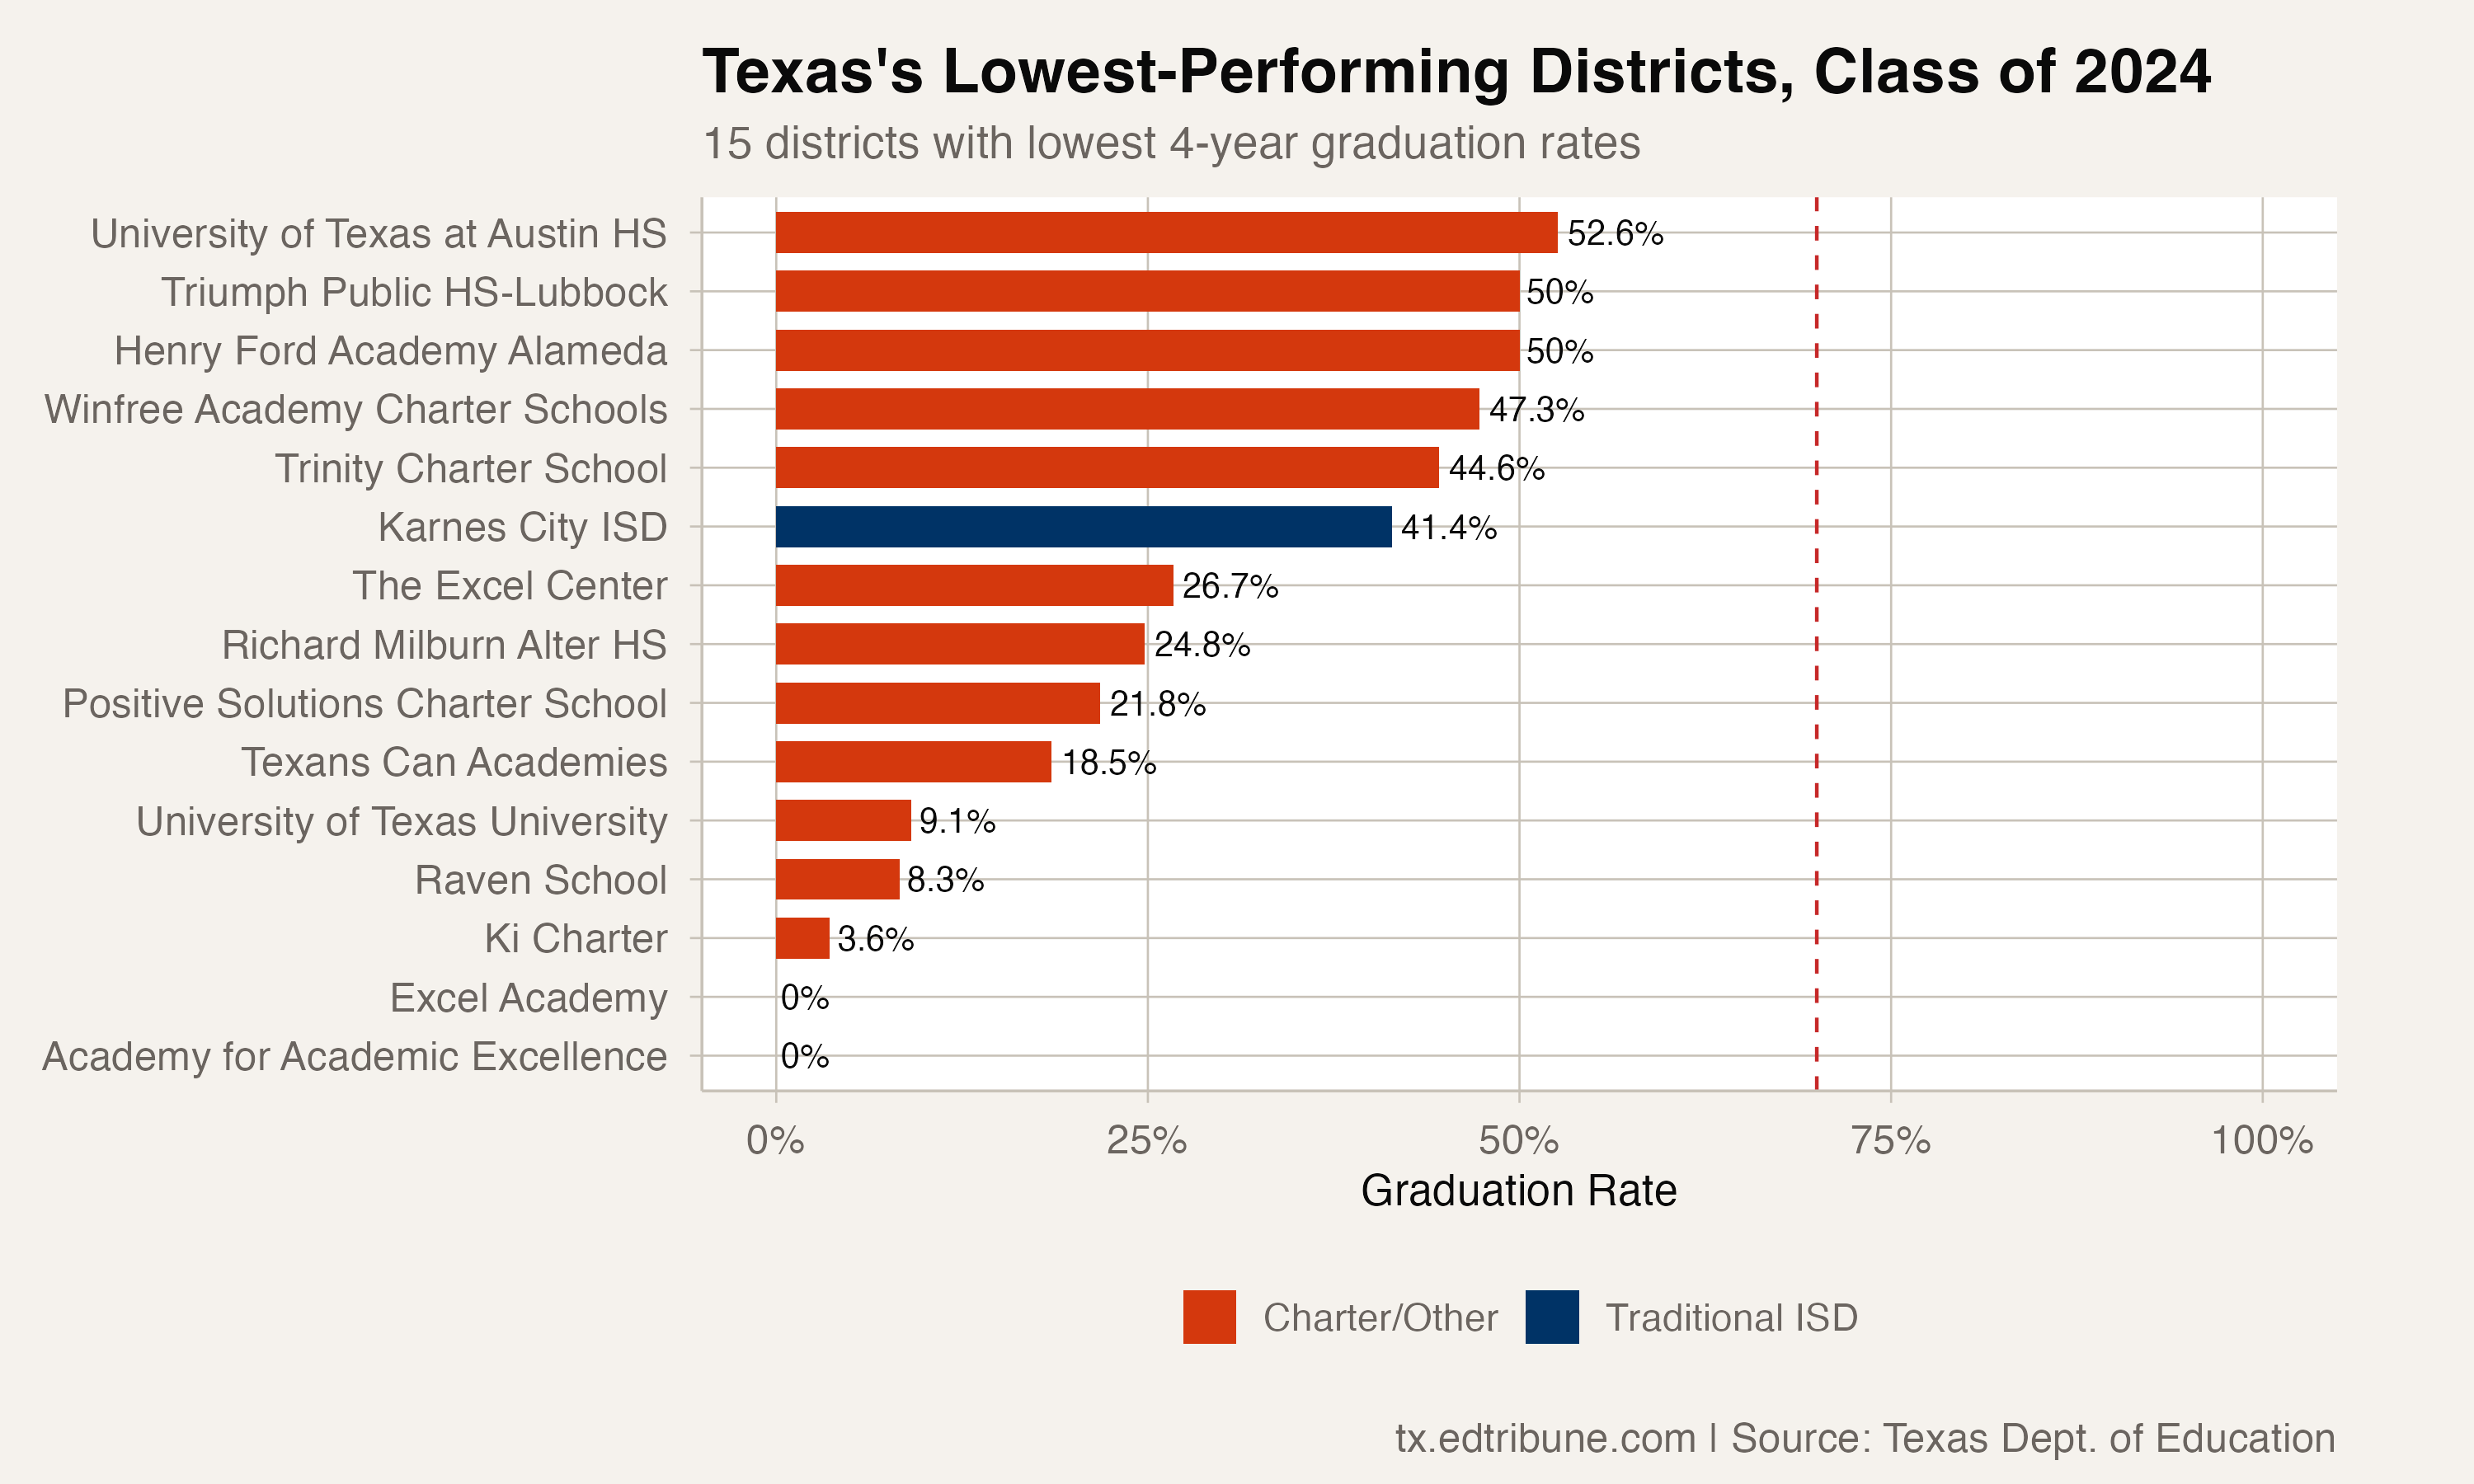
This raises a measurement problem that runs through Texas graduation data. A dropout recovery charter that enrolls students who already left traditional schools is structurally different from a comprehensive ISD. Measuring both with the same four-year cohort rate produces numbers that look damning for alternative schools but may not reflect what those schools actually do. The state's accountability system has made some adjustments for this, but the headline rate does not distinguish between the two.
The bifurcation underneath the headline
The statewide number obscures a growing split. Among the 1,038 districts present in all five years, 423 posted their highest graduation rate of the panel in 2024, while 248 hit their lowest. The top is still climbing while the bottom is still falling. That 699 districts can be above 95% at the same time that 26 are below 70% reflects a graduation landscape where the vast majority of students are succeeding, but the systems serving the most vulnerable populations are not keeping pace.
Whether 90.7% is a ceiling or a plateau will depend on what happens at the bottom of the distribution, where the rate is 50 or more points lower than the headline suggests.
Detailed code that reproduces the analysis and figures in this article is available exclusively to EdTribune subscribers.
Discussion
Sign in to join the discussion.
Loading comments...