In this series: Texas 2025-26 Enrollment.
Texas's 2024-25 performance reports counted 386,543 students in twelfth grade and 359,286 in kindergarten. The difference was 27,257 students. For every hundred twelfth-graders, the state reported 92.9 kindergartners.
The gap is real, but it measures two grade-level snapshots in the same school year. It does not count how many students graduated or entered public school, and it does not follow the same children over time. The comparison cannot, by itself, predict a future enrollment loss.
The historical series covers 2004-05 through 2024-25. The newer enrollment reports provide a separate pair of years and are not appended to that series to establish historical crossings or records.
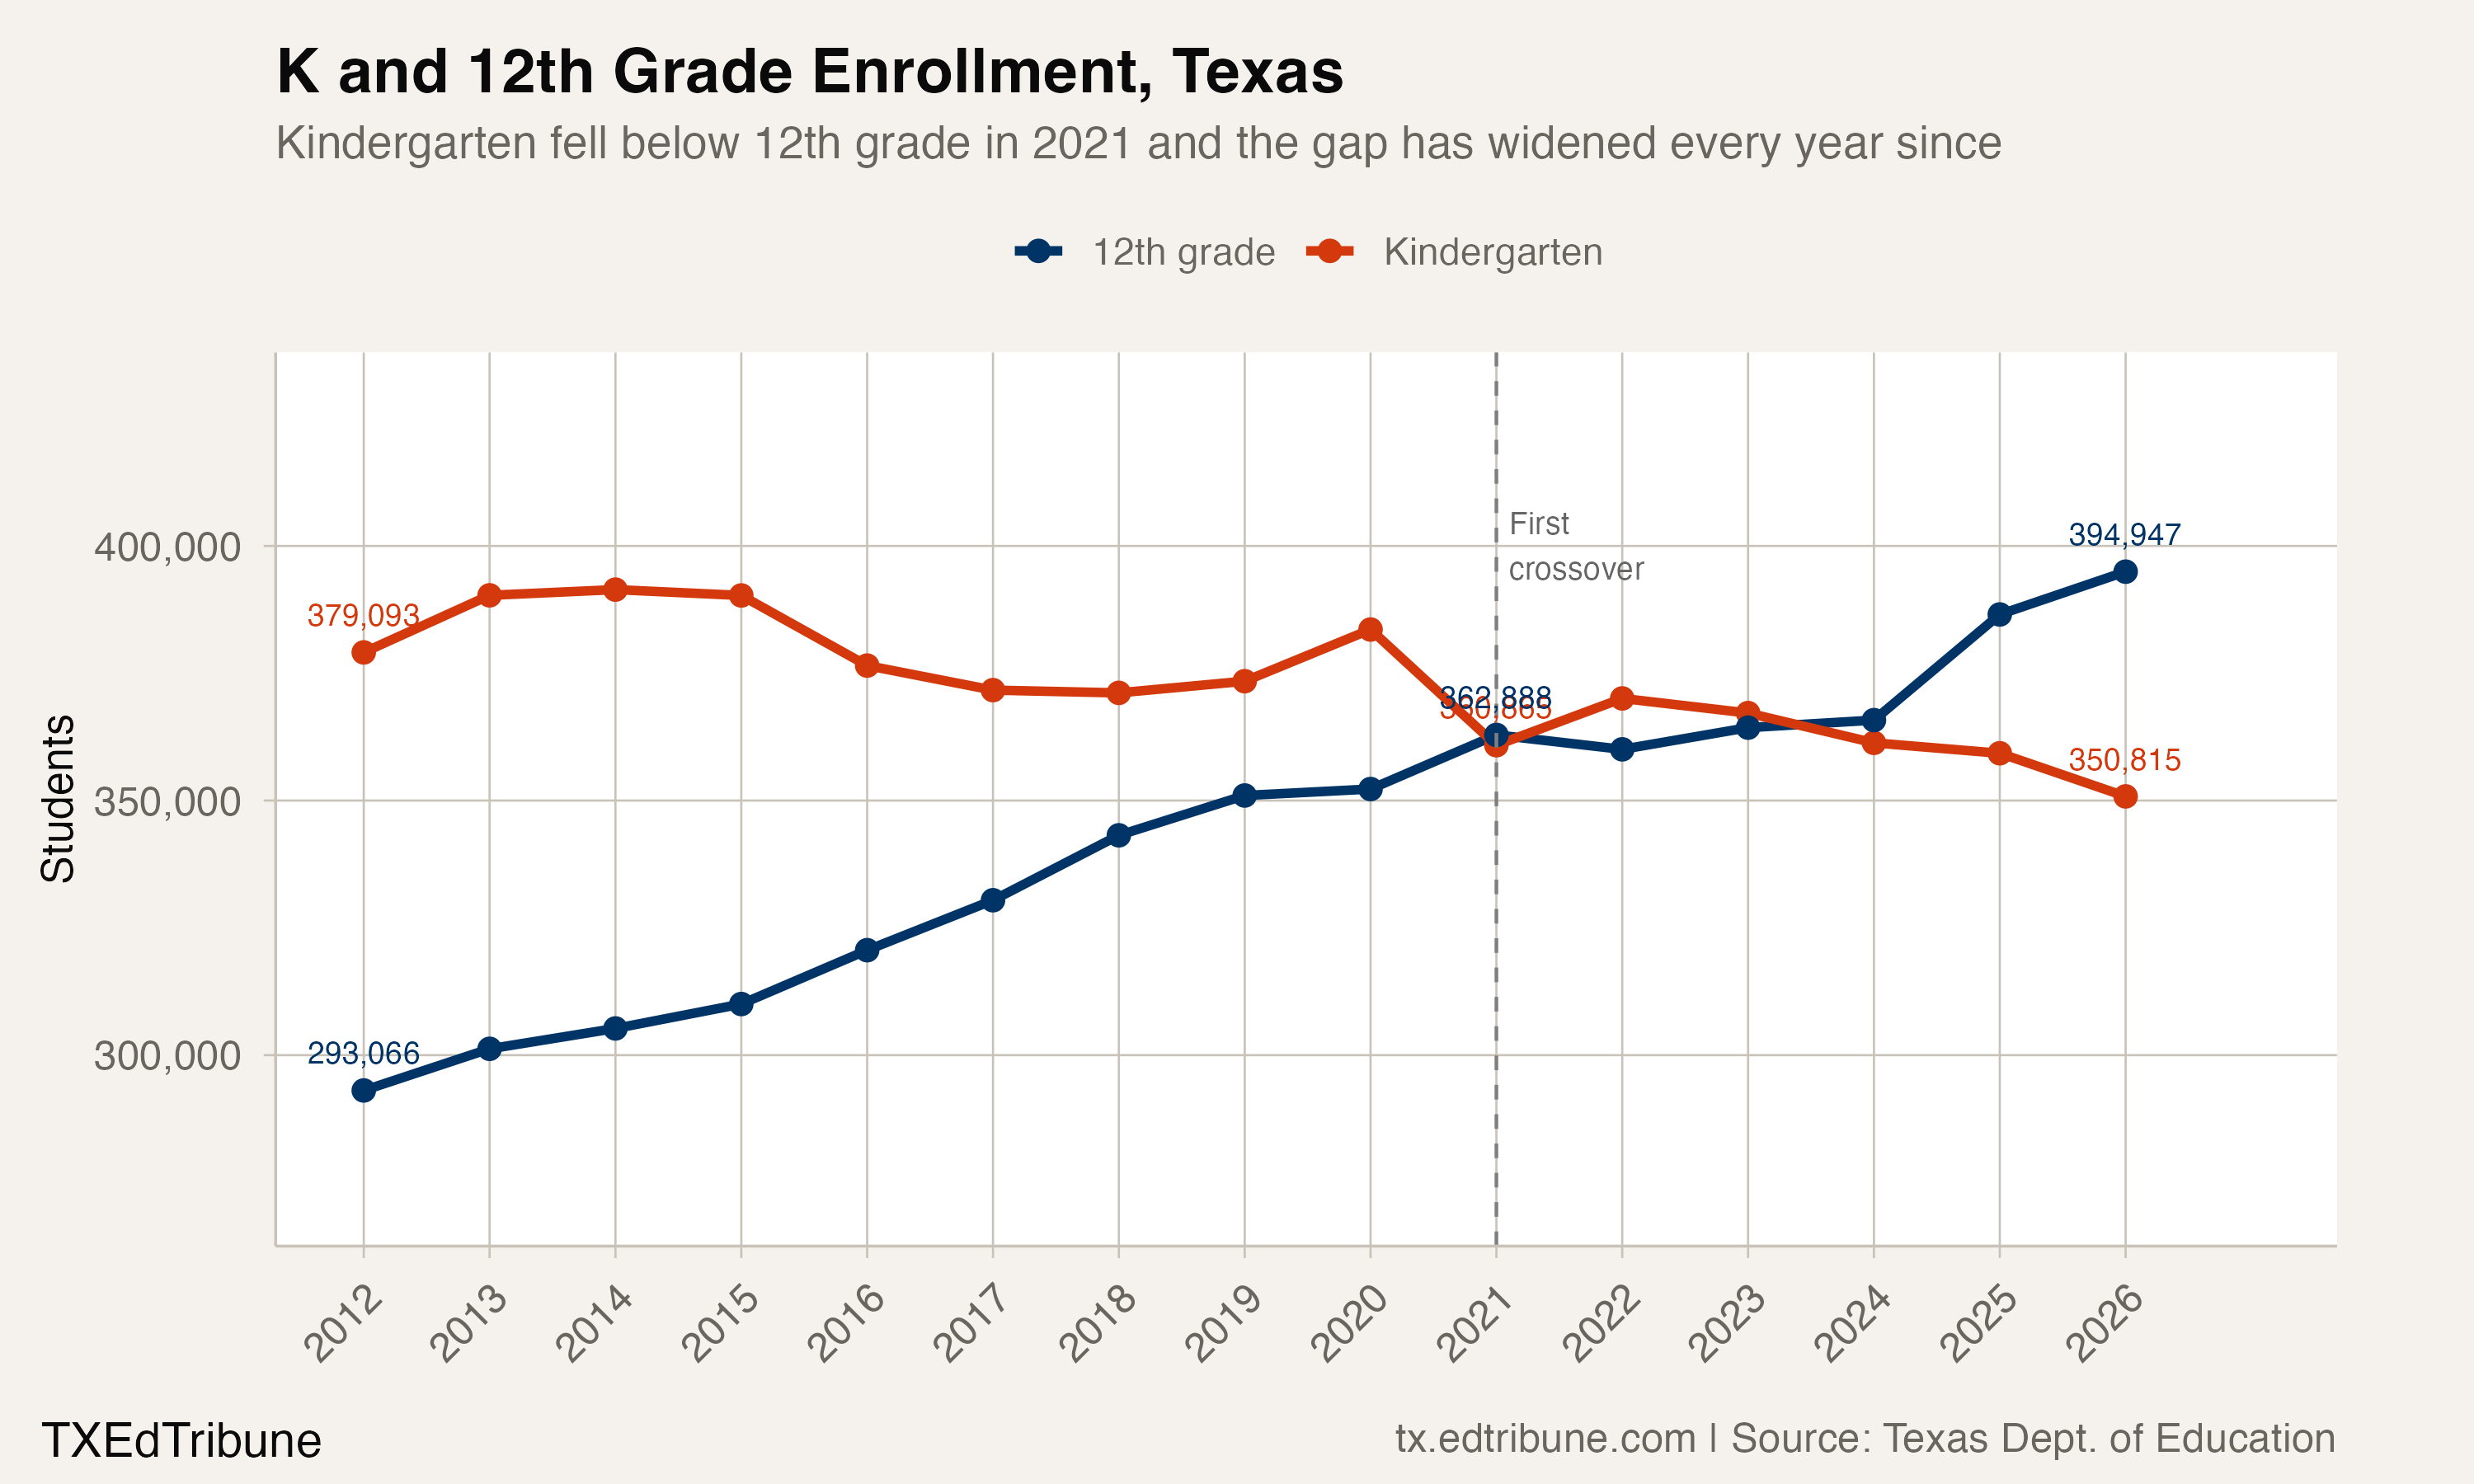
The first observed crossing was temporary
Within the complete available historical window, twelfth-grade enrollment first exceeded kindergarten in 2020-21. The difference was 2,023 students. Kindergarten then returned above twelfth grade in both 2021-22 and 2022-23. That history rules out a continuously widening gap after the first crossing.
Twelfth grade moved ahead again in 2023-24, with a gap of 4,459 students. That widened to 27,257 in 2024-25. This is a renewed crossing followed by a larger gap, rather than an uninterrupted sequence since the first crossing.
An earlier comparison shows how much the balance changed. In 2011-12, kindergarten had 379,093 students and twelfth grade had 293,066. The ratio was 129.4 kindergartners per hundred twelfth-graders. The latest historical ratio was below parity, with fewer kindergartners than students in the older grade.
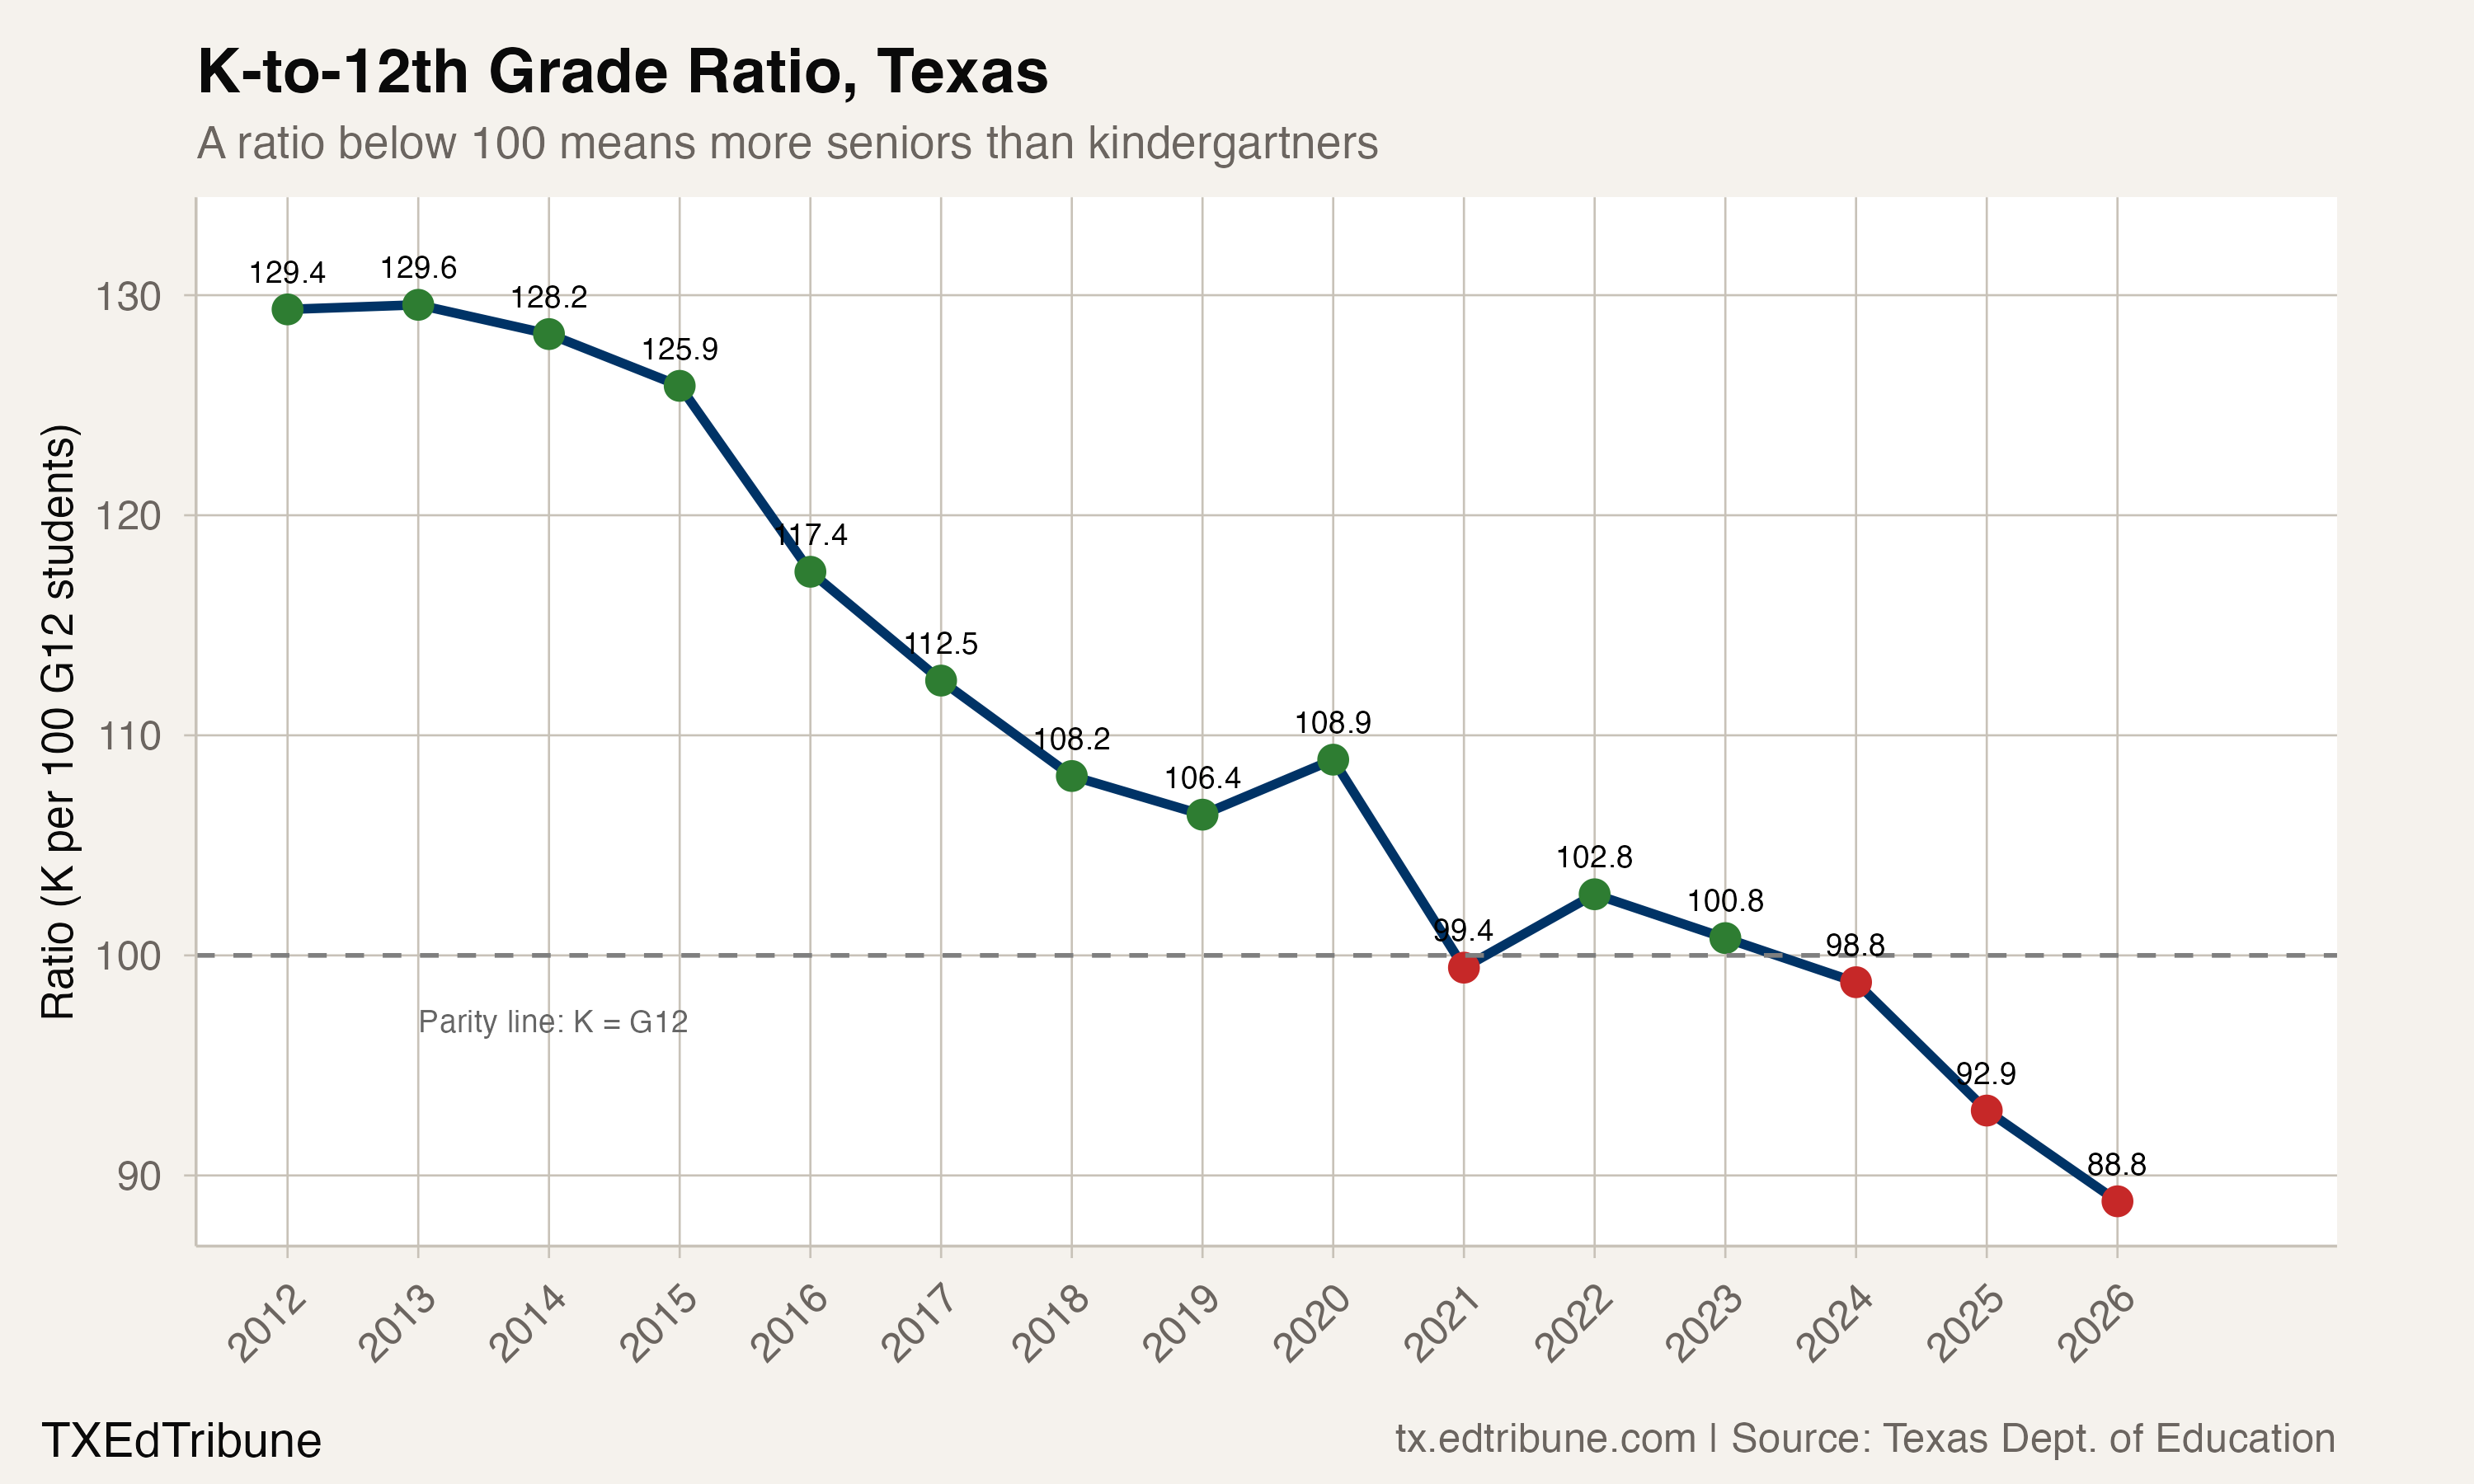
The newer report pair points in the same direction
Last school year's 2025-26 Student Enrollment Reports counted 350,226 kindergartners and 394,642 twelfth-graders. The difference was 44,416 students, equivalent to 88.7 kindergartners per hundred twelfth-graders.
Within that same report series, kindergarten declined by 9,645 students, or 2.7%, from the previous school year. Twelfth grade increased by 5,765. Both changes widened the gap in that particular comparison.
The overlapping-year grade totals differ from those in the performance reports. Their comparability has not been established here, so the newer observations remain a separate comparison. Joining them to the older historical line would change both the kindergarten decline and the twelfth-grade increase.
Lower grades did not all move together
Between 2011-12 and 2024-25 in the native historical reports, kindergarten lost 19,807 students, a decline of 5.2%. First grade lost 14,117, or 3.6%. Second grade increased by 6,642. Second grade therefore moved in the opposite direction from kindergarten and first grade.
Twelfth grade added 93,477 students, an increase of 31.9%. Those endpoints show substantially different grade-level trajectories. They do not establish which children stayed in the system, which children arrived from elsewhere, or why a particular grade grew.
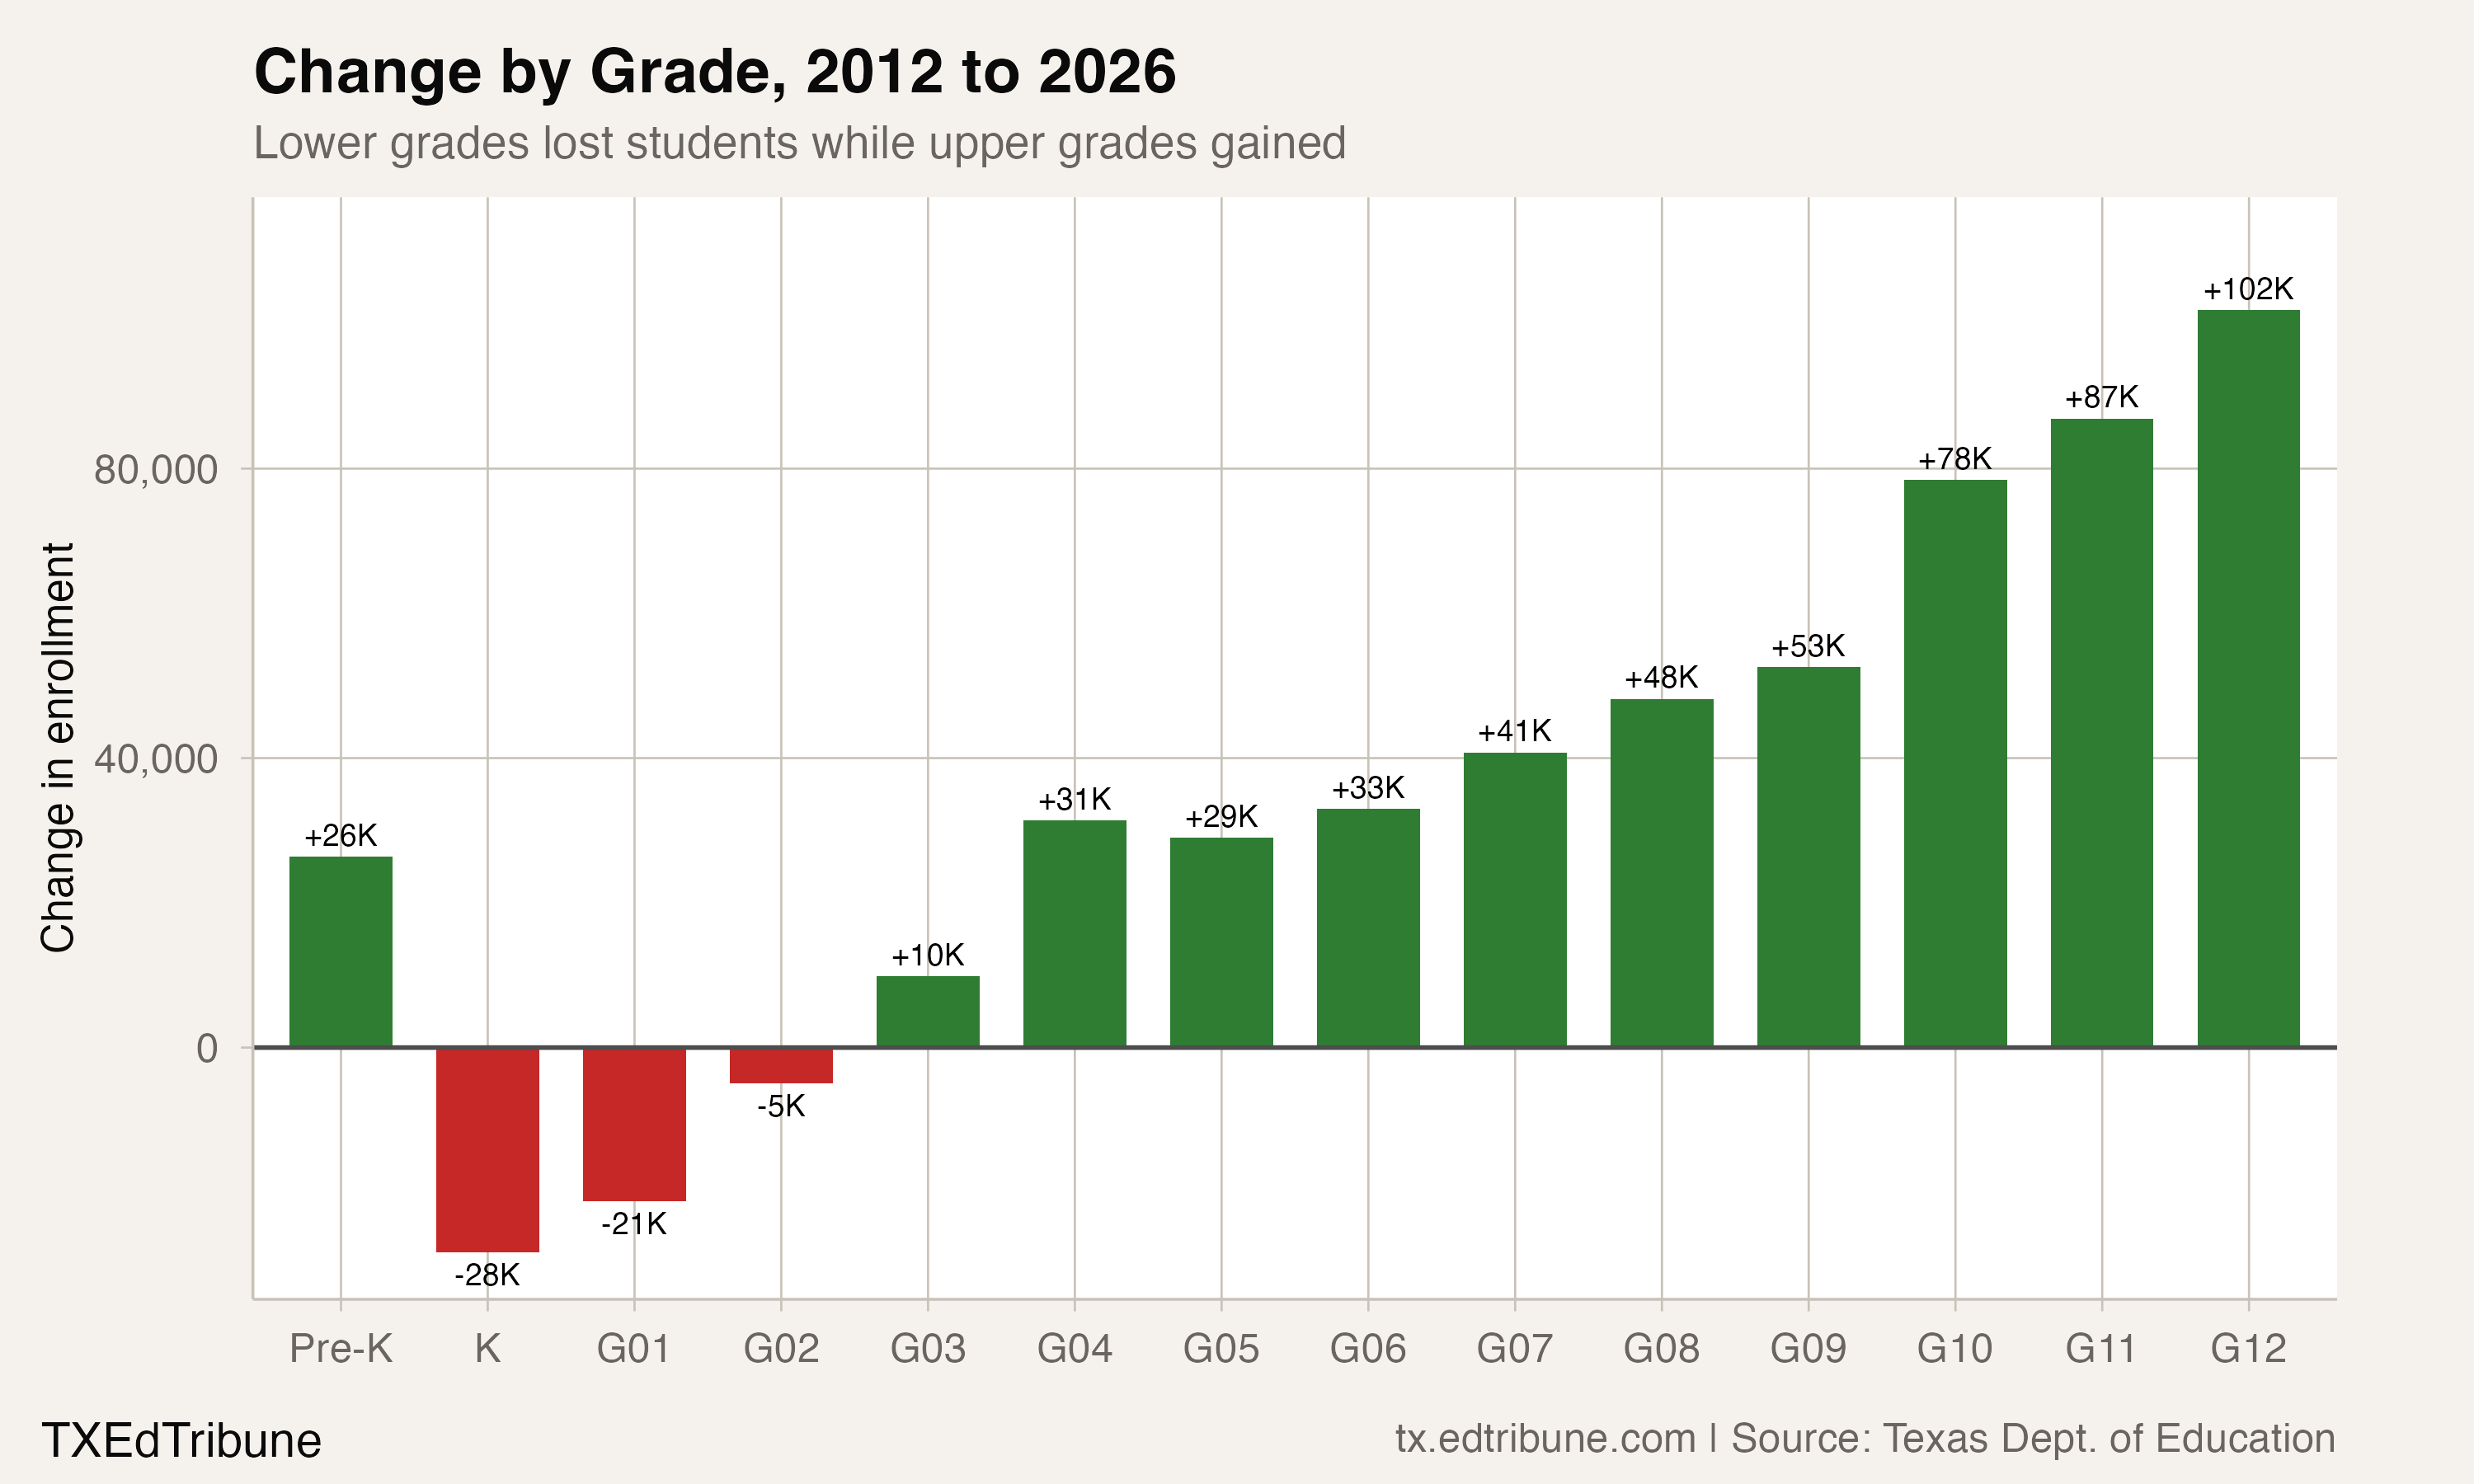
Compared with 2019-20, six of the fifteen reported grade categories remained below their earlier counts in 2024-25. The categories include early education, prekindergarten, kindergarten and each numbered grade. The chart uses complete, finite published counts for each comparison; missing categories are not treated as zero.
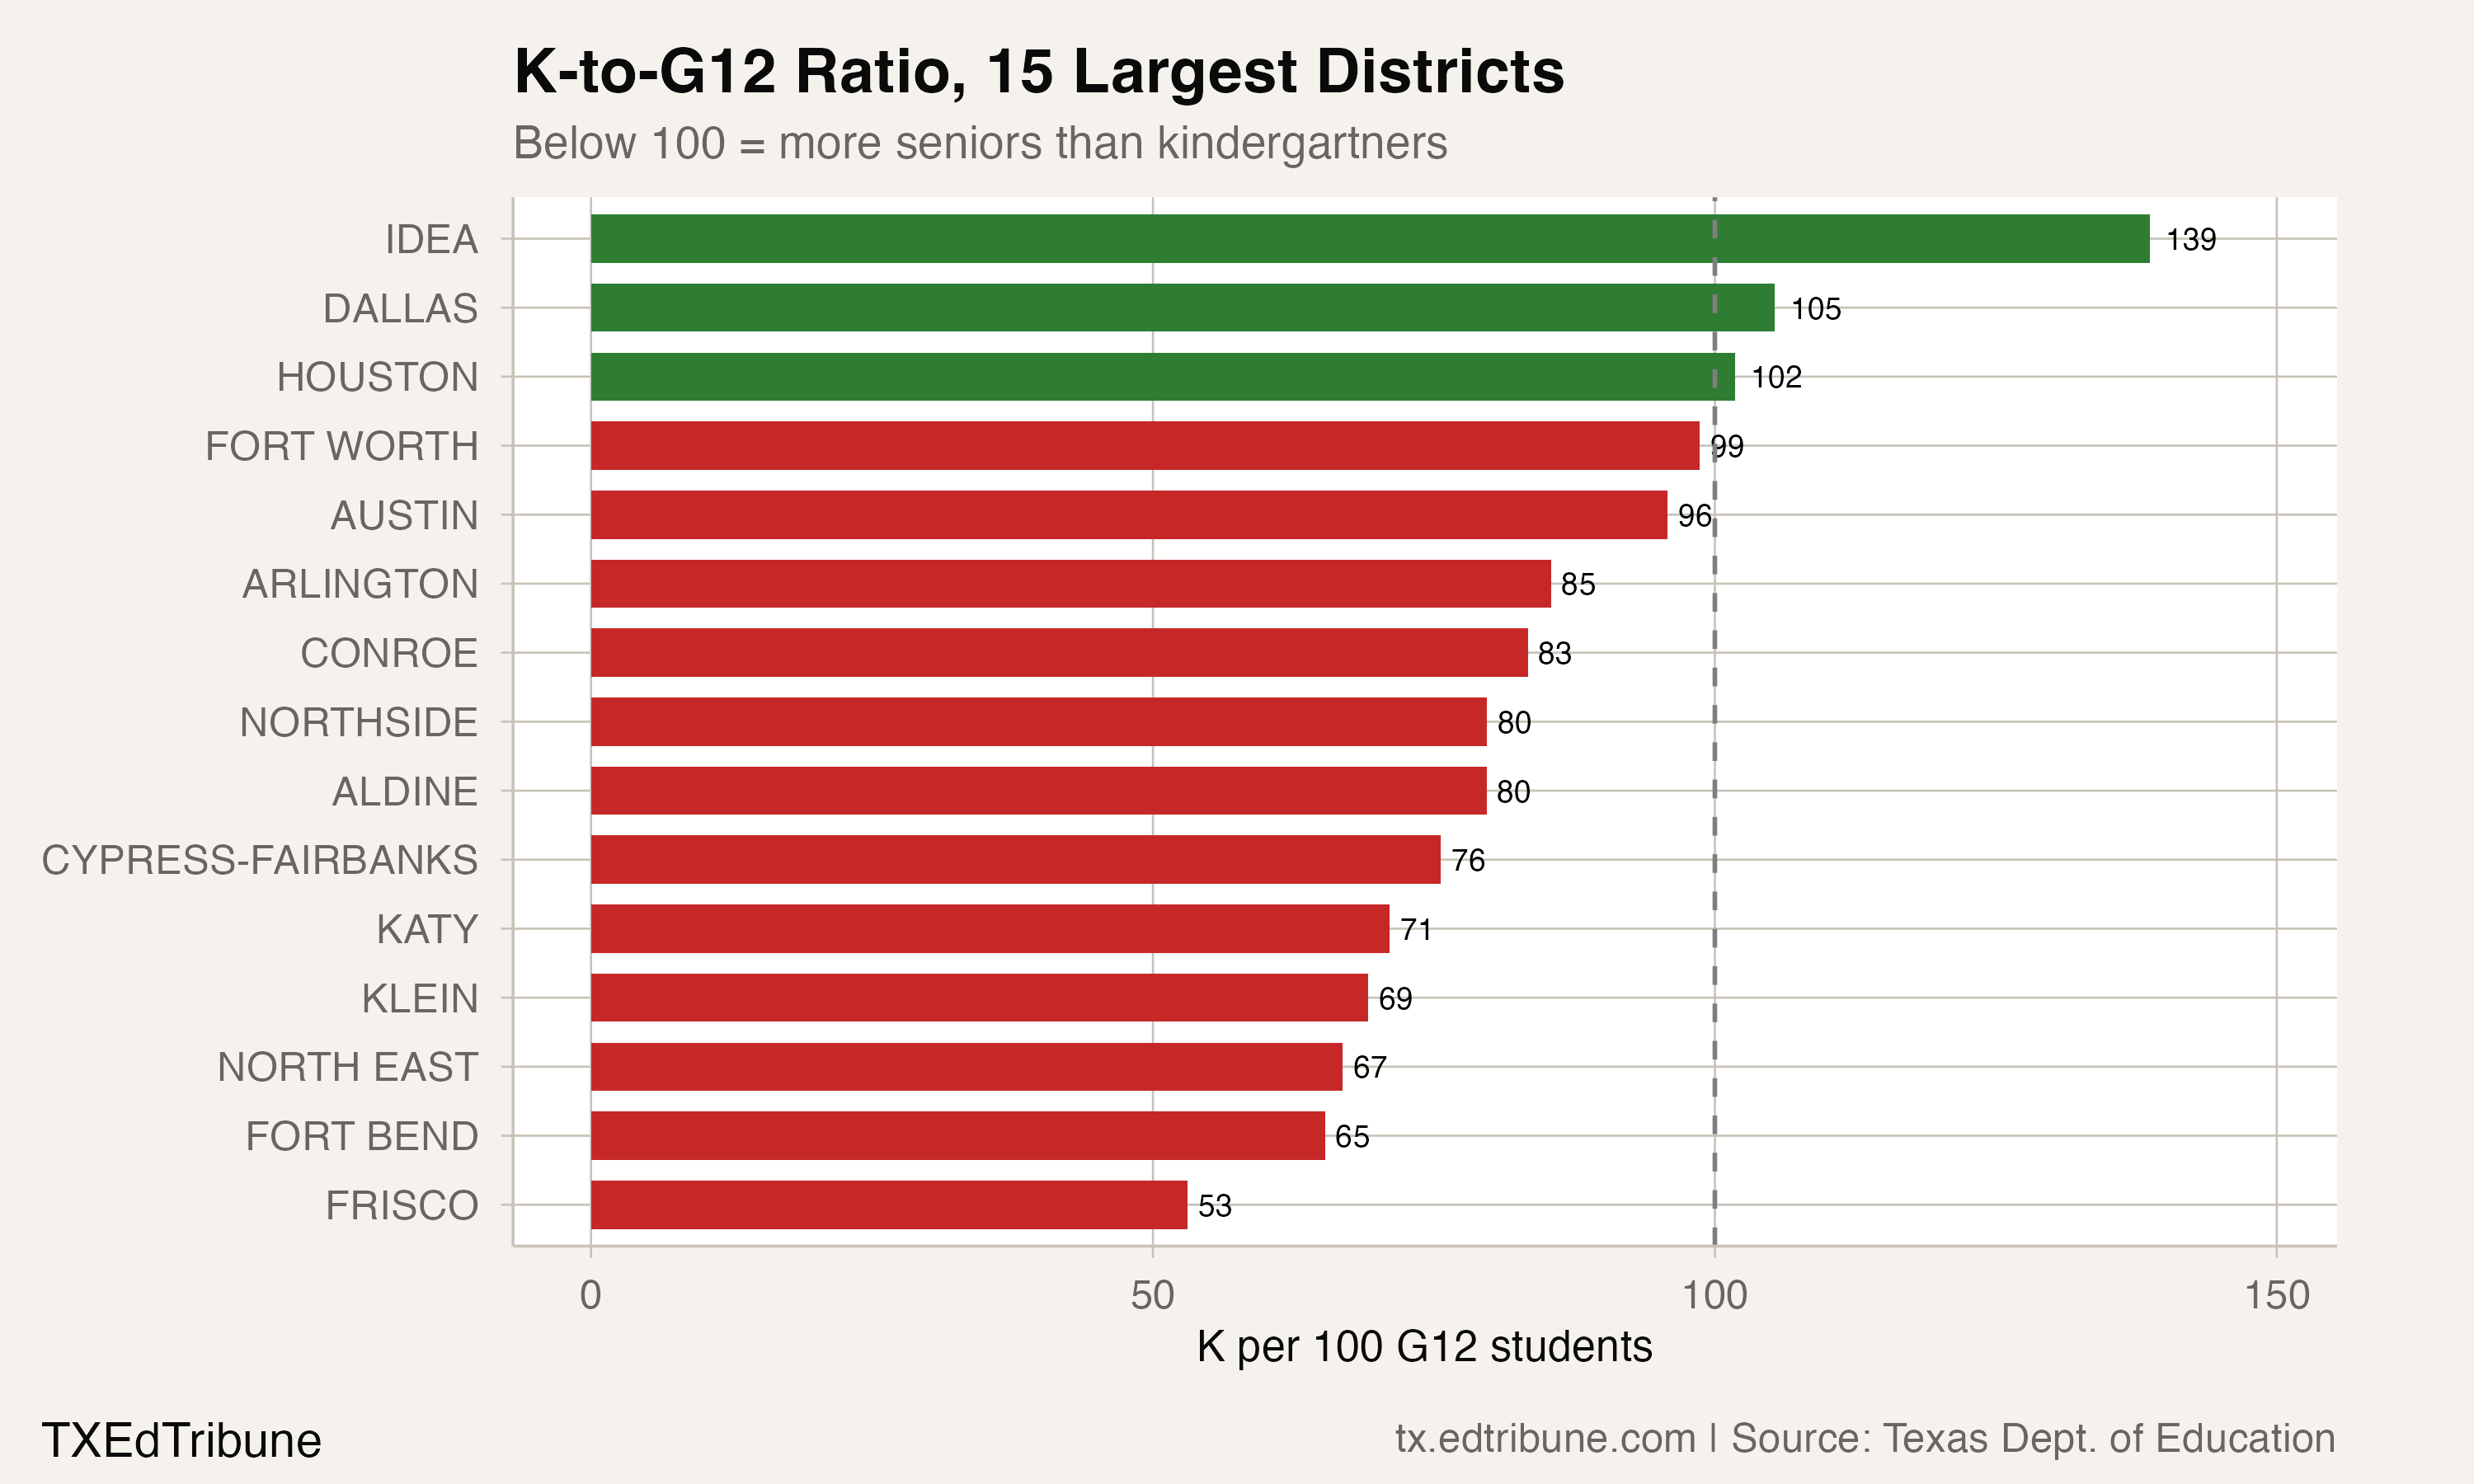
Large districts show different balances
Among the fifteen largest districts ranked by their published 2024-25 enrollment totals, eleven had more twelfth-graders than kindergartners. Four did not. Districts are selected by their published total before the grade counts are compared, so missing grade data cannot silently replace a large district with a smaller one.
Frisco's ratio was 59.1 kindergartners per hundred twelfth-graders. Its kindergarten count was 3,375, compared with 5,713 in twelfth grade. In 2011-12, the district reported 3,446 kindergartners and 1,986 twelfth-graders, a ratio of 173.5. The present grade balance differs sharply from the earlier snapshot, even though it cannot trace the intervening paths of individual students.
Katy's latest historical ratio was 76.9. Fort Bend's was 73.9, and Cypress-Fairbanks's was 79.0. Dallas was on the other side of parity at 109.3; Houston was at 106.2. Those ratios describe observed grade counts, not district recruitment effectiveness or household movement.
In a written response supplied for this article, Dallas ISD Superintendent Stephanie Elizalde said, “what I’ve learned as superintendent is that implementation is the new innovation.” Her response was forwarded by Jason Stanford, special assistant to the superintendent.
She also said, “Pipelines that are not continually improved and upgraded spring a leak.” That wording incorporates the correction requested by her representative after the original response. Her comments offer a leadership perspective; the enrollment reports do not independently measure the effect of the district's programs.
The statewide district share needs a clear denominator
The district comparison is restricted to reports with a published total of at least a thousand students, a finite nonnegative kindergarten count and a finite positive twelfth-grade count. Each grade count must also be no greater than that district's published total. The threshold defines this comparison group; it is not a definition of all Texas districts.
In 2011-12, 85 of 529 eligible districts had more twelfth-graders than kindergartners, or 16.1%. In 2024-25, 330 of 570 eligible districts did, or 57.9%. The latest report contained 1,208 district totals, and 638 were excluded by the comparison rules. Some are smaller than the threshold; others lack eligible grade counts. No excluded count is replaced with zero.
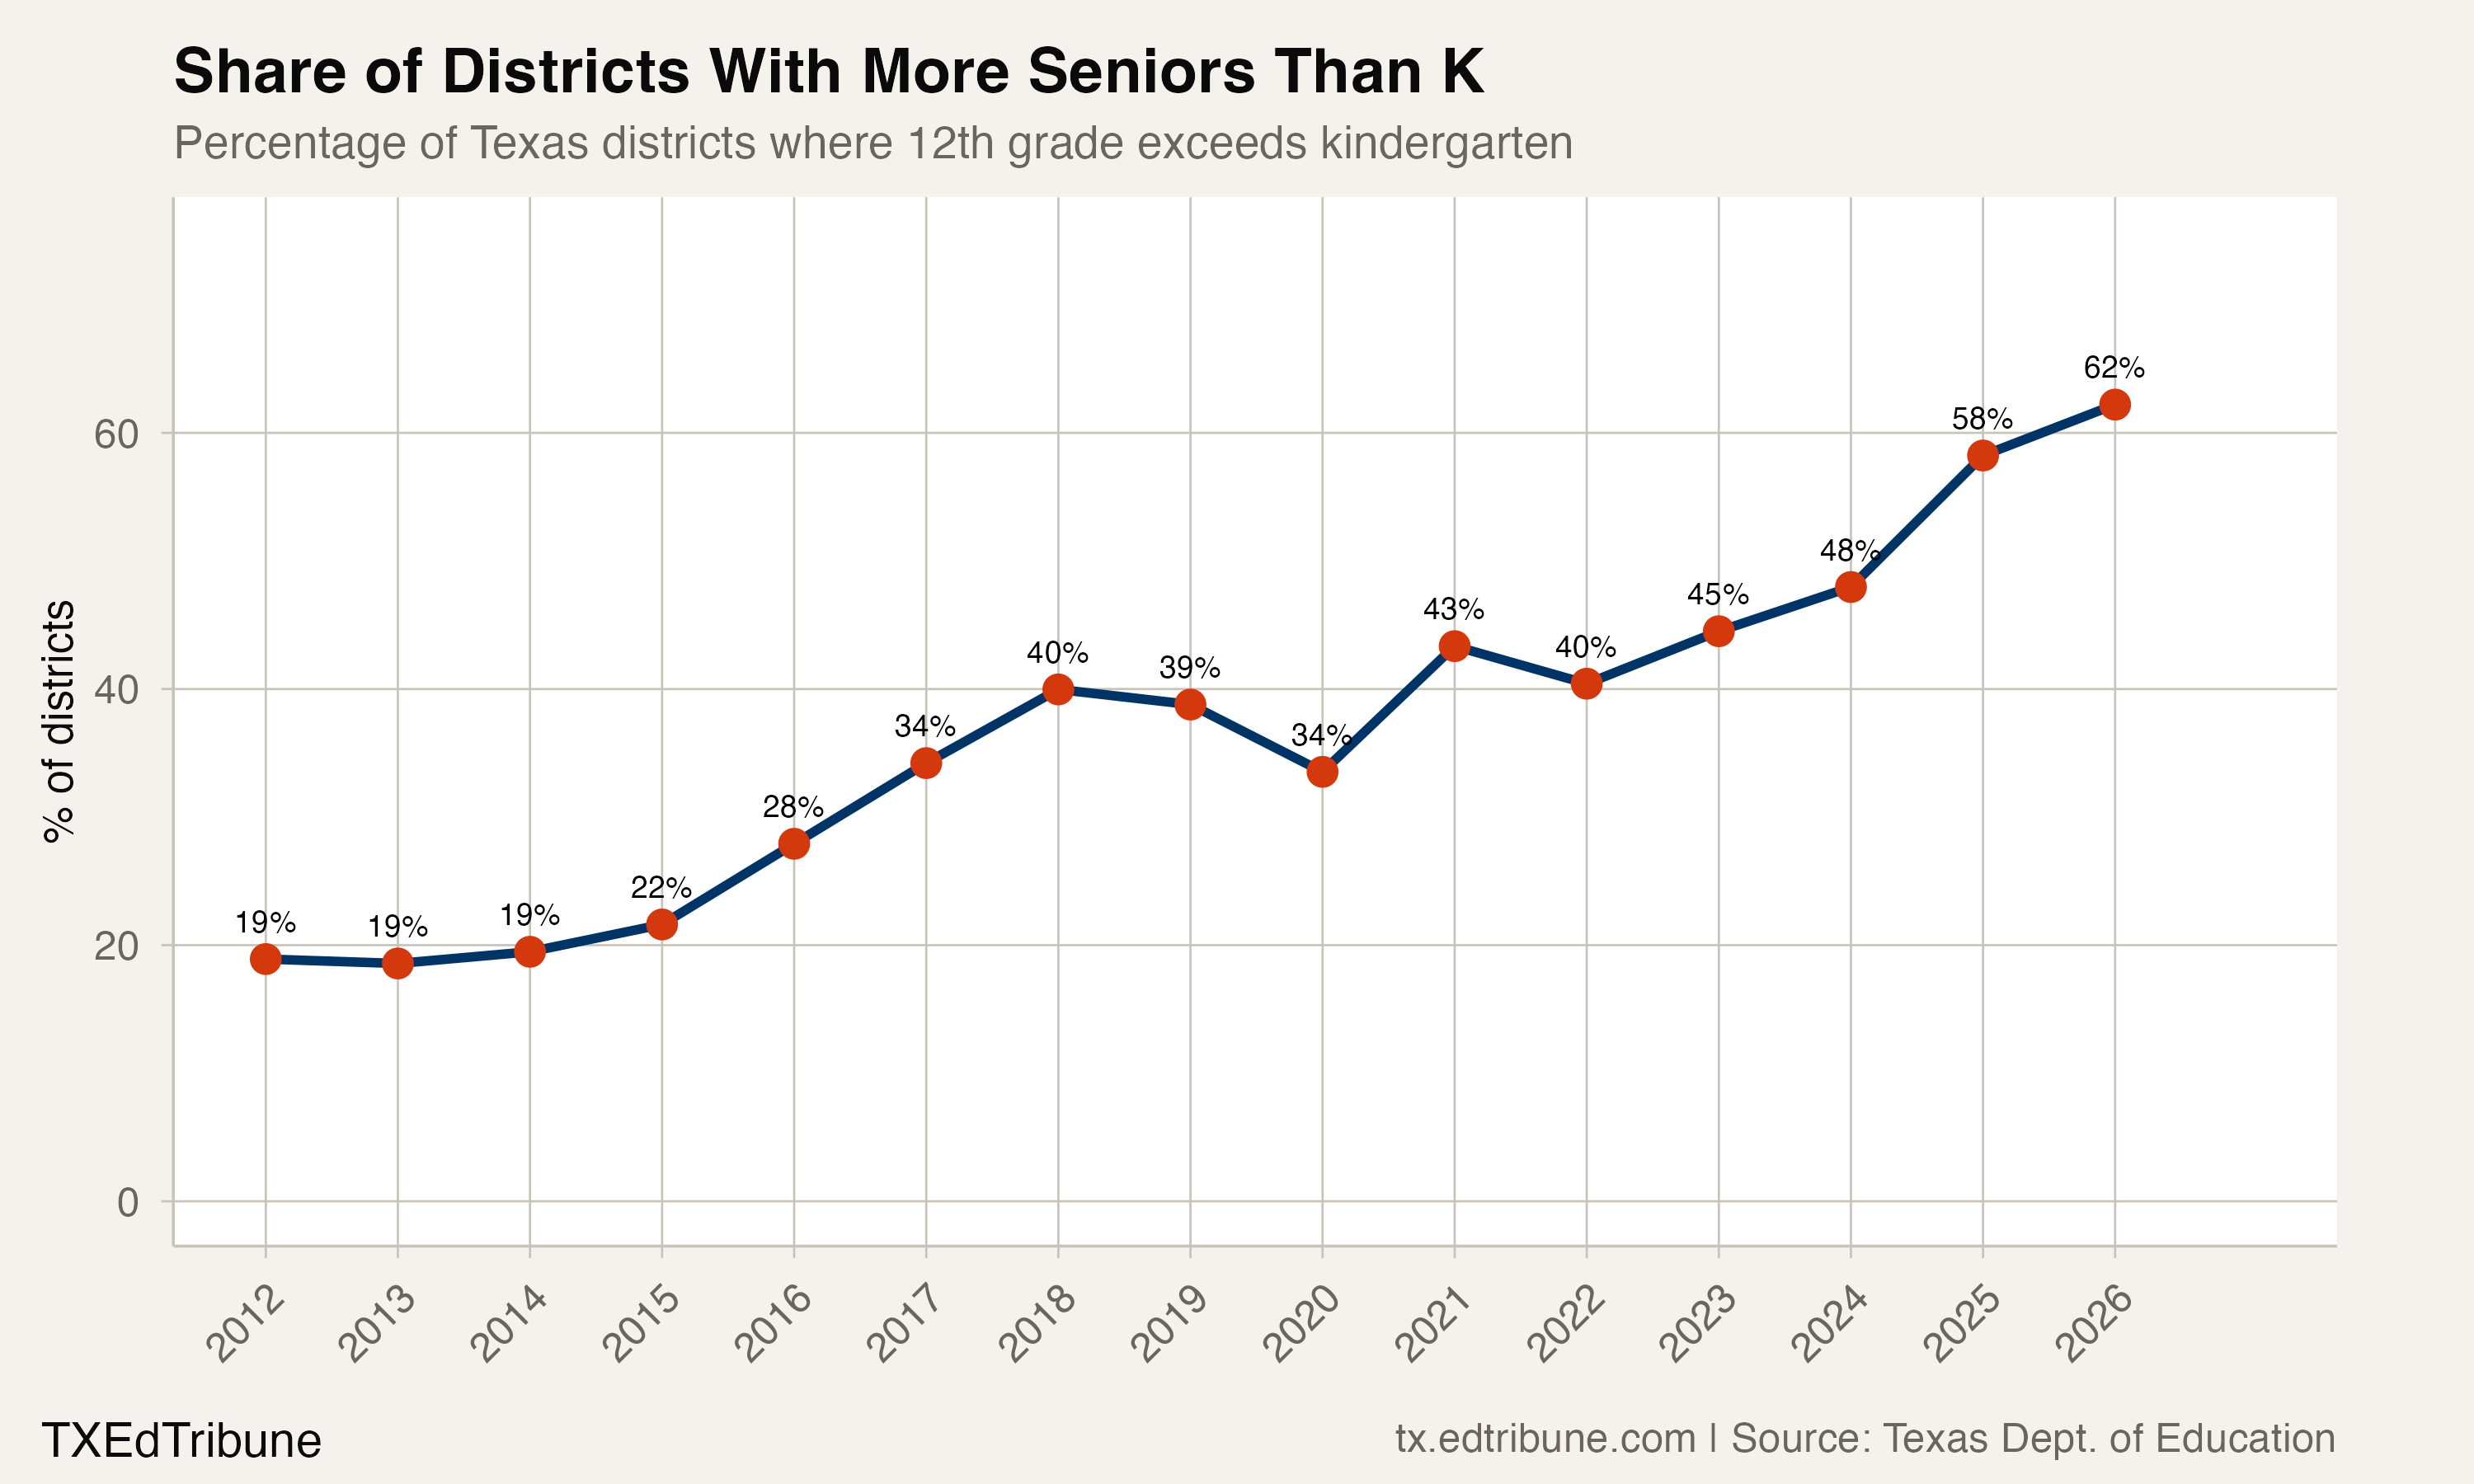
The annual groups change as districts become eligible or ineligible. Their percentages are a series of year-specific comparisons, not a study of exactly the same districts followed throughout the window. That distinction matters when interpreting the increase.
A narrower conclusion than a forecast
The published historical counts establish a shift in the balance between kindergarten and twelfth grade, with a temporary early crossing and a later renewed gap. The newer enrollment reports show a further gap within their own reporting series. Selected districts differ markedly in the same-year relationship between the two grades.
Those findings do not establish retention rates or a one-for-one exchange between graduates and new entrants. Neither grade count measures the full set of students joining or leaving a district. Births, migration, school choices, program changes and reporting practices require their own evidence before they can explain these totals.
Source: Texas Education Agency annual performance reports and Student Enrollment Reports. The superintendent excerpts were checked against the written response and subsequent requested correction.
Detailed code that reproduces the analysis and figures in this article is available exclusively to EdTribune subscribers.
Discussion
Sign in to join the discussion.
Loading comments...