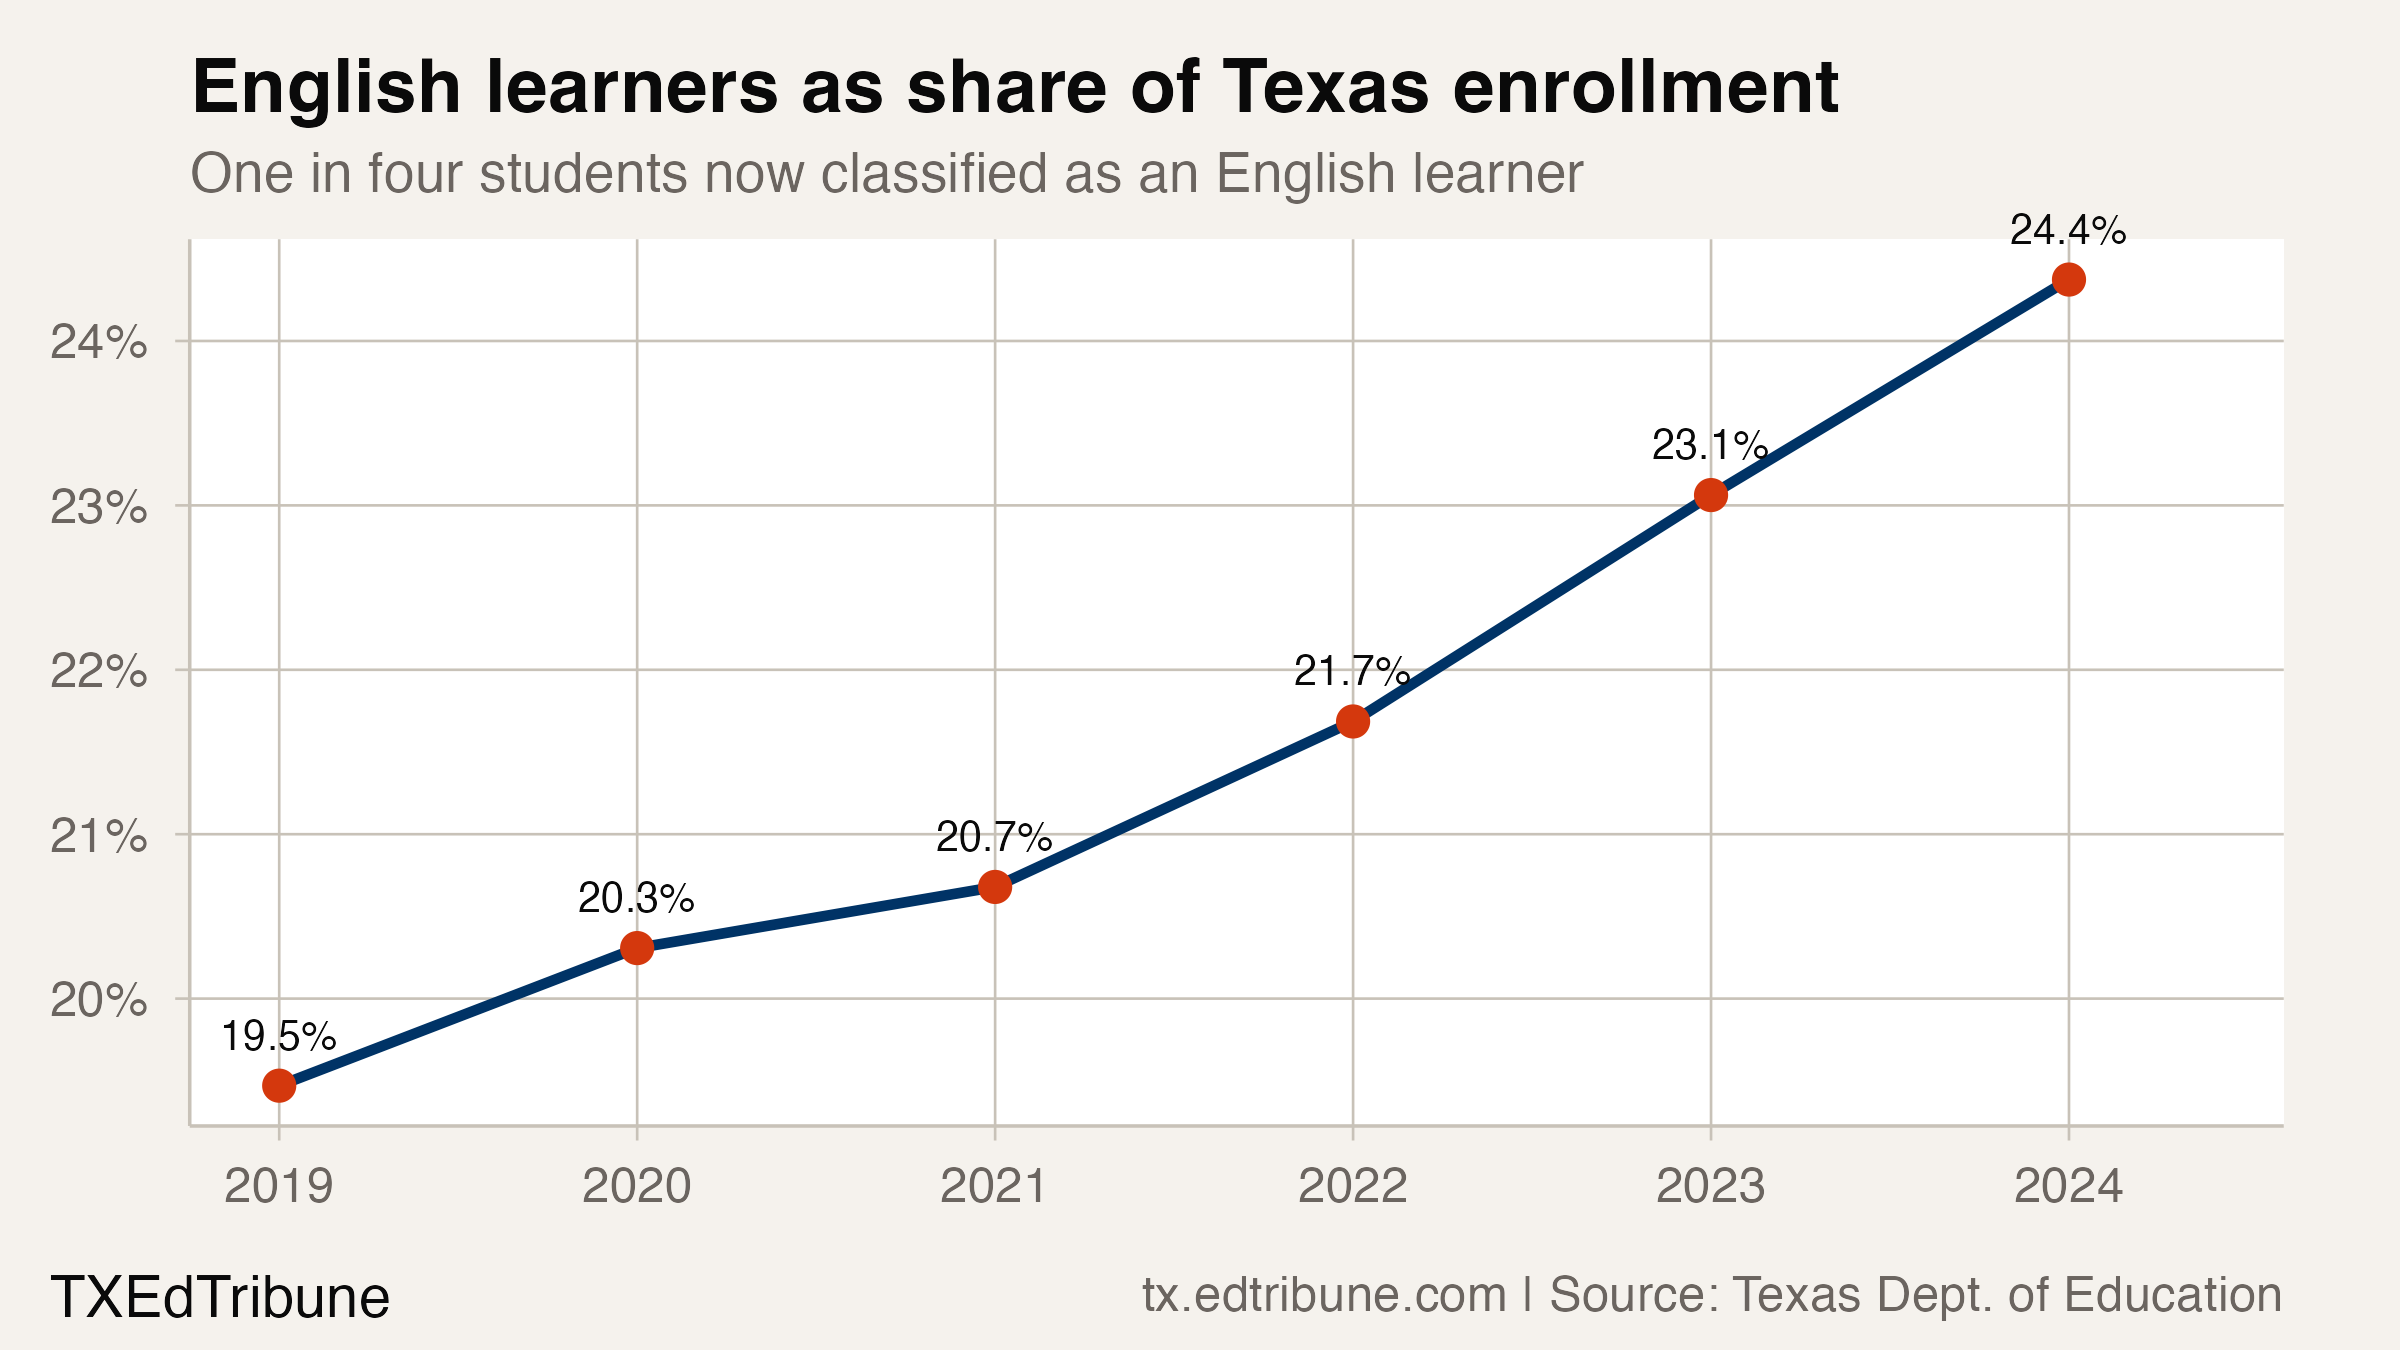
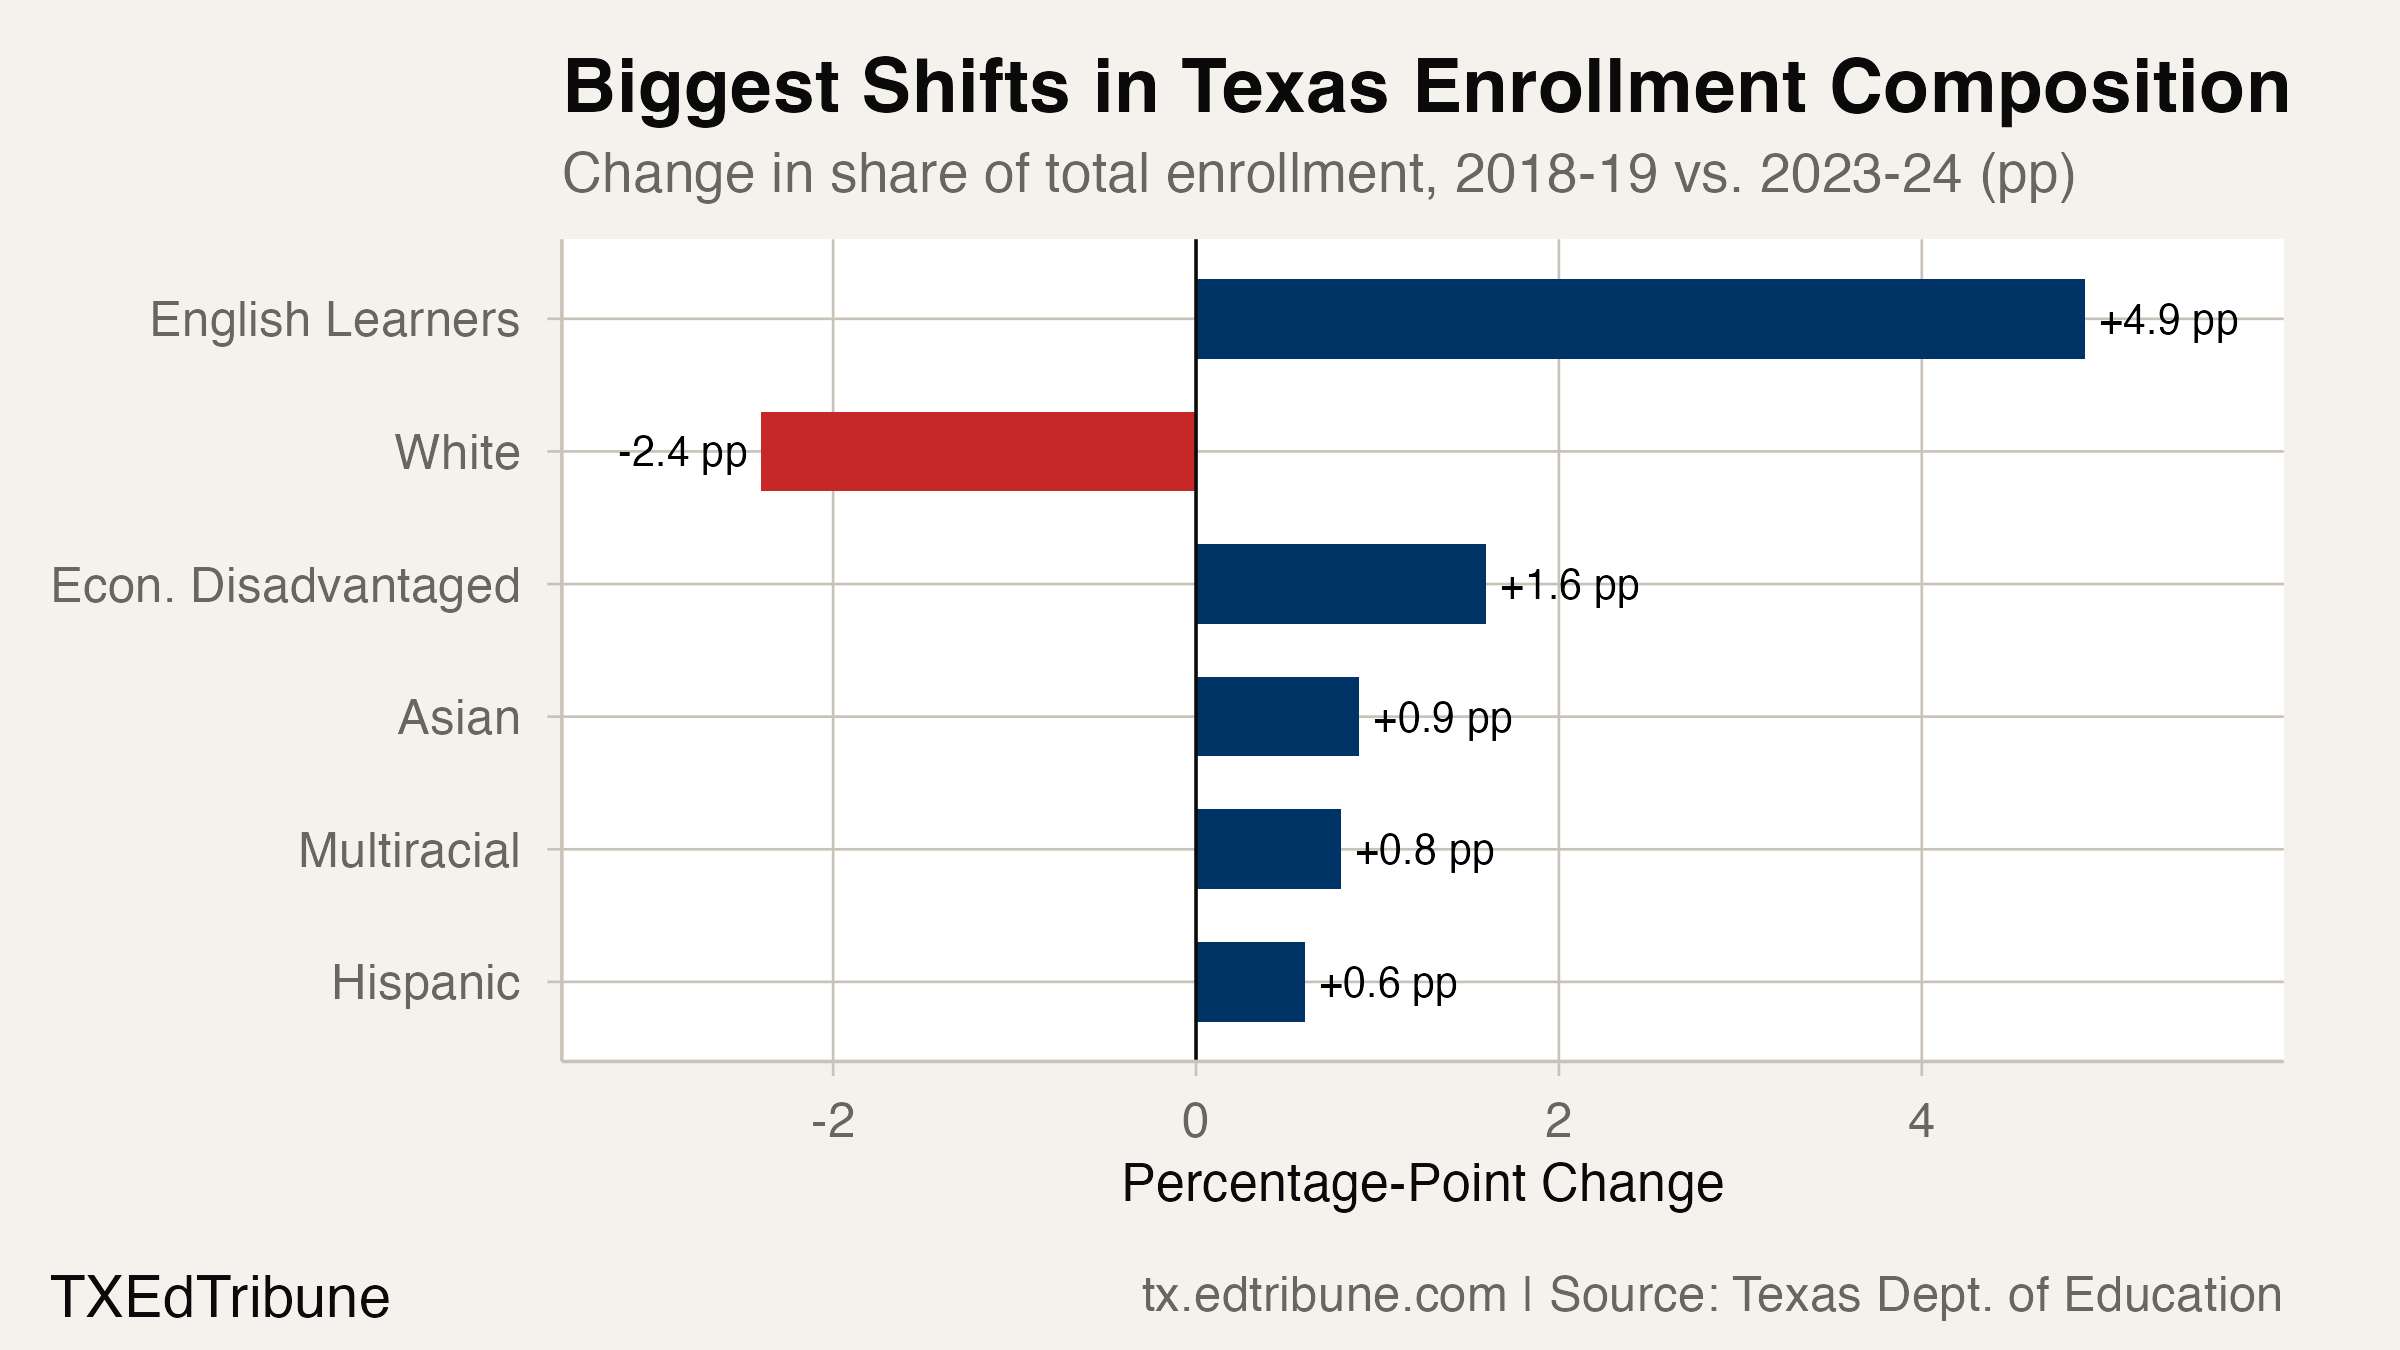
Nearly one in four Texas public school students is now classified as an English learner — up from roughly one in five just five years ago. Between 2018-19 and 2023-24, the state added 290,208 English learners, a 27.5% increase that was nearly three times the state's total net enrollment gain of 101,064 students over the same period. The English learner share of enrollment rose from 19.5% to 24.4%, a 4.9 percentage-point shift — the largest composition change of any student group in Texas.
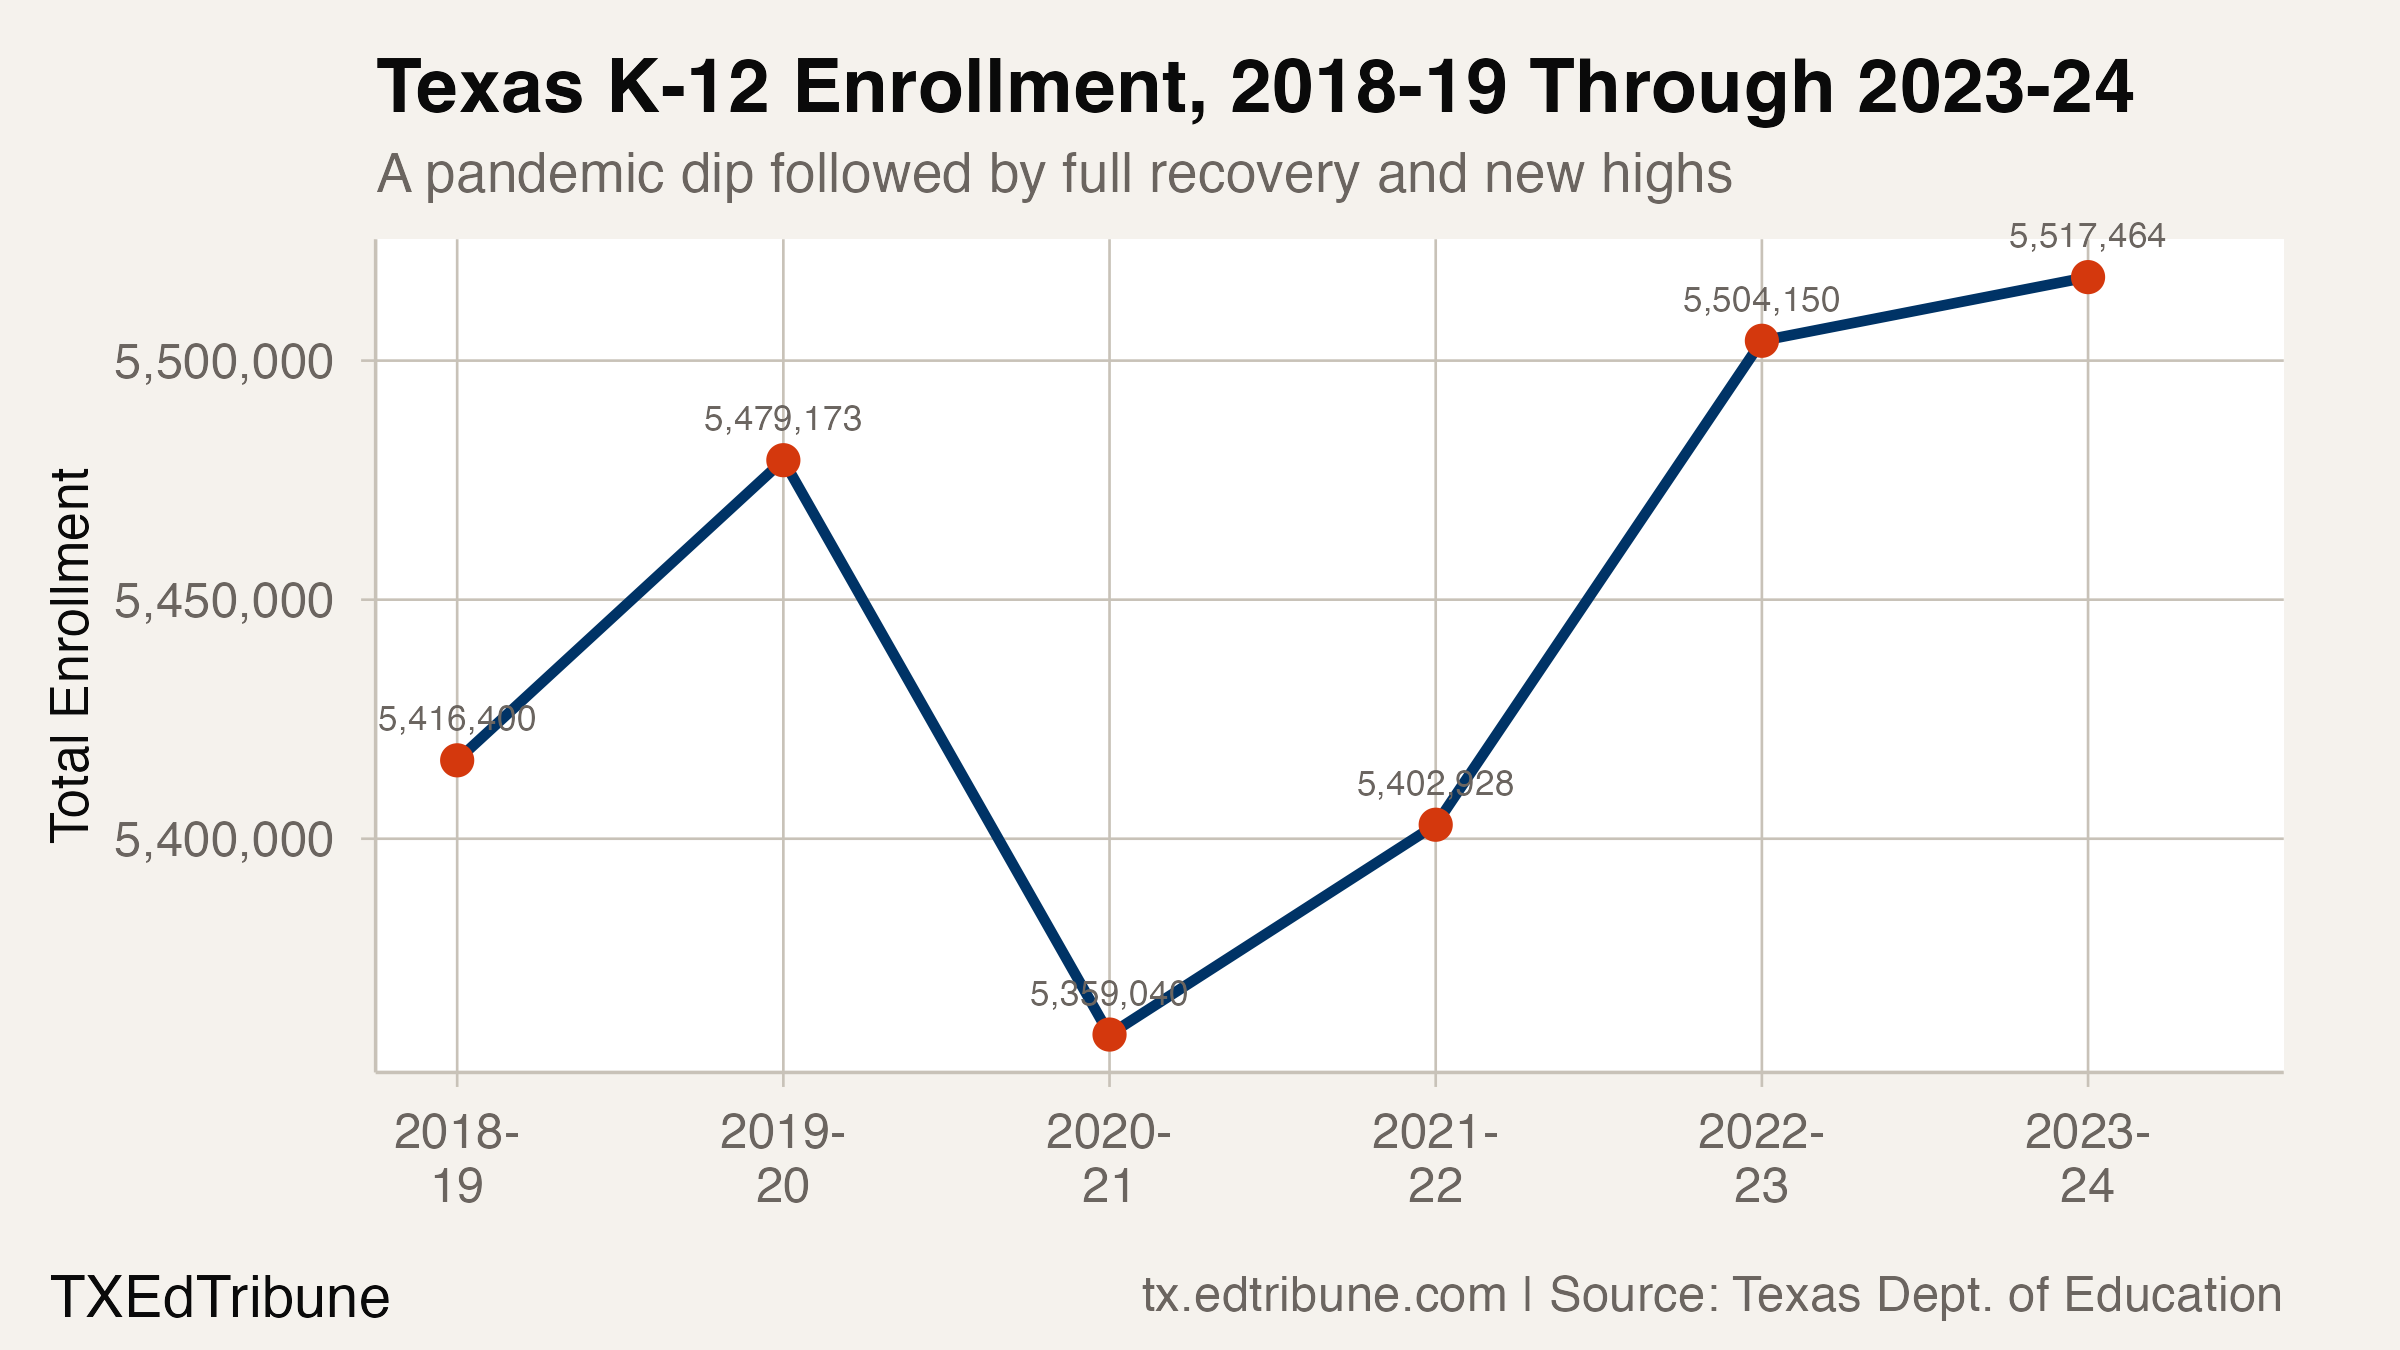
Texas total enrollment grew by just 1.9% over those five years. The English learner surge is not a reflection of overall growth. It is a transformation in who Texas schools serve.
The pattern
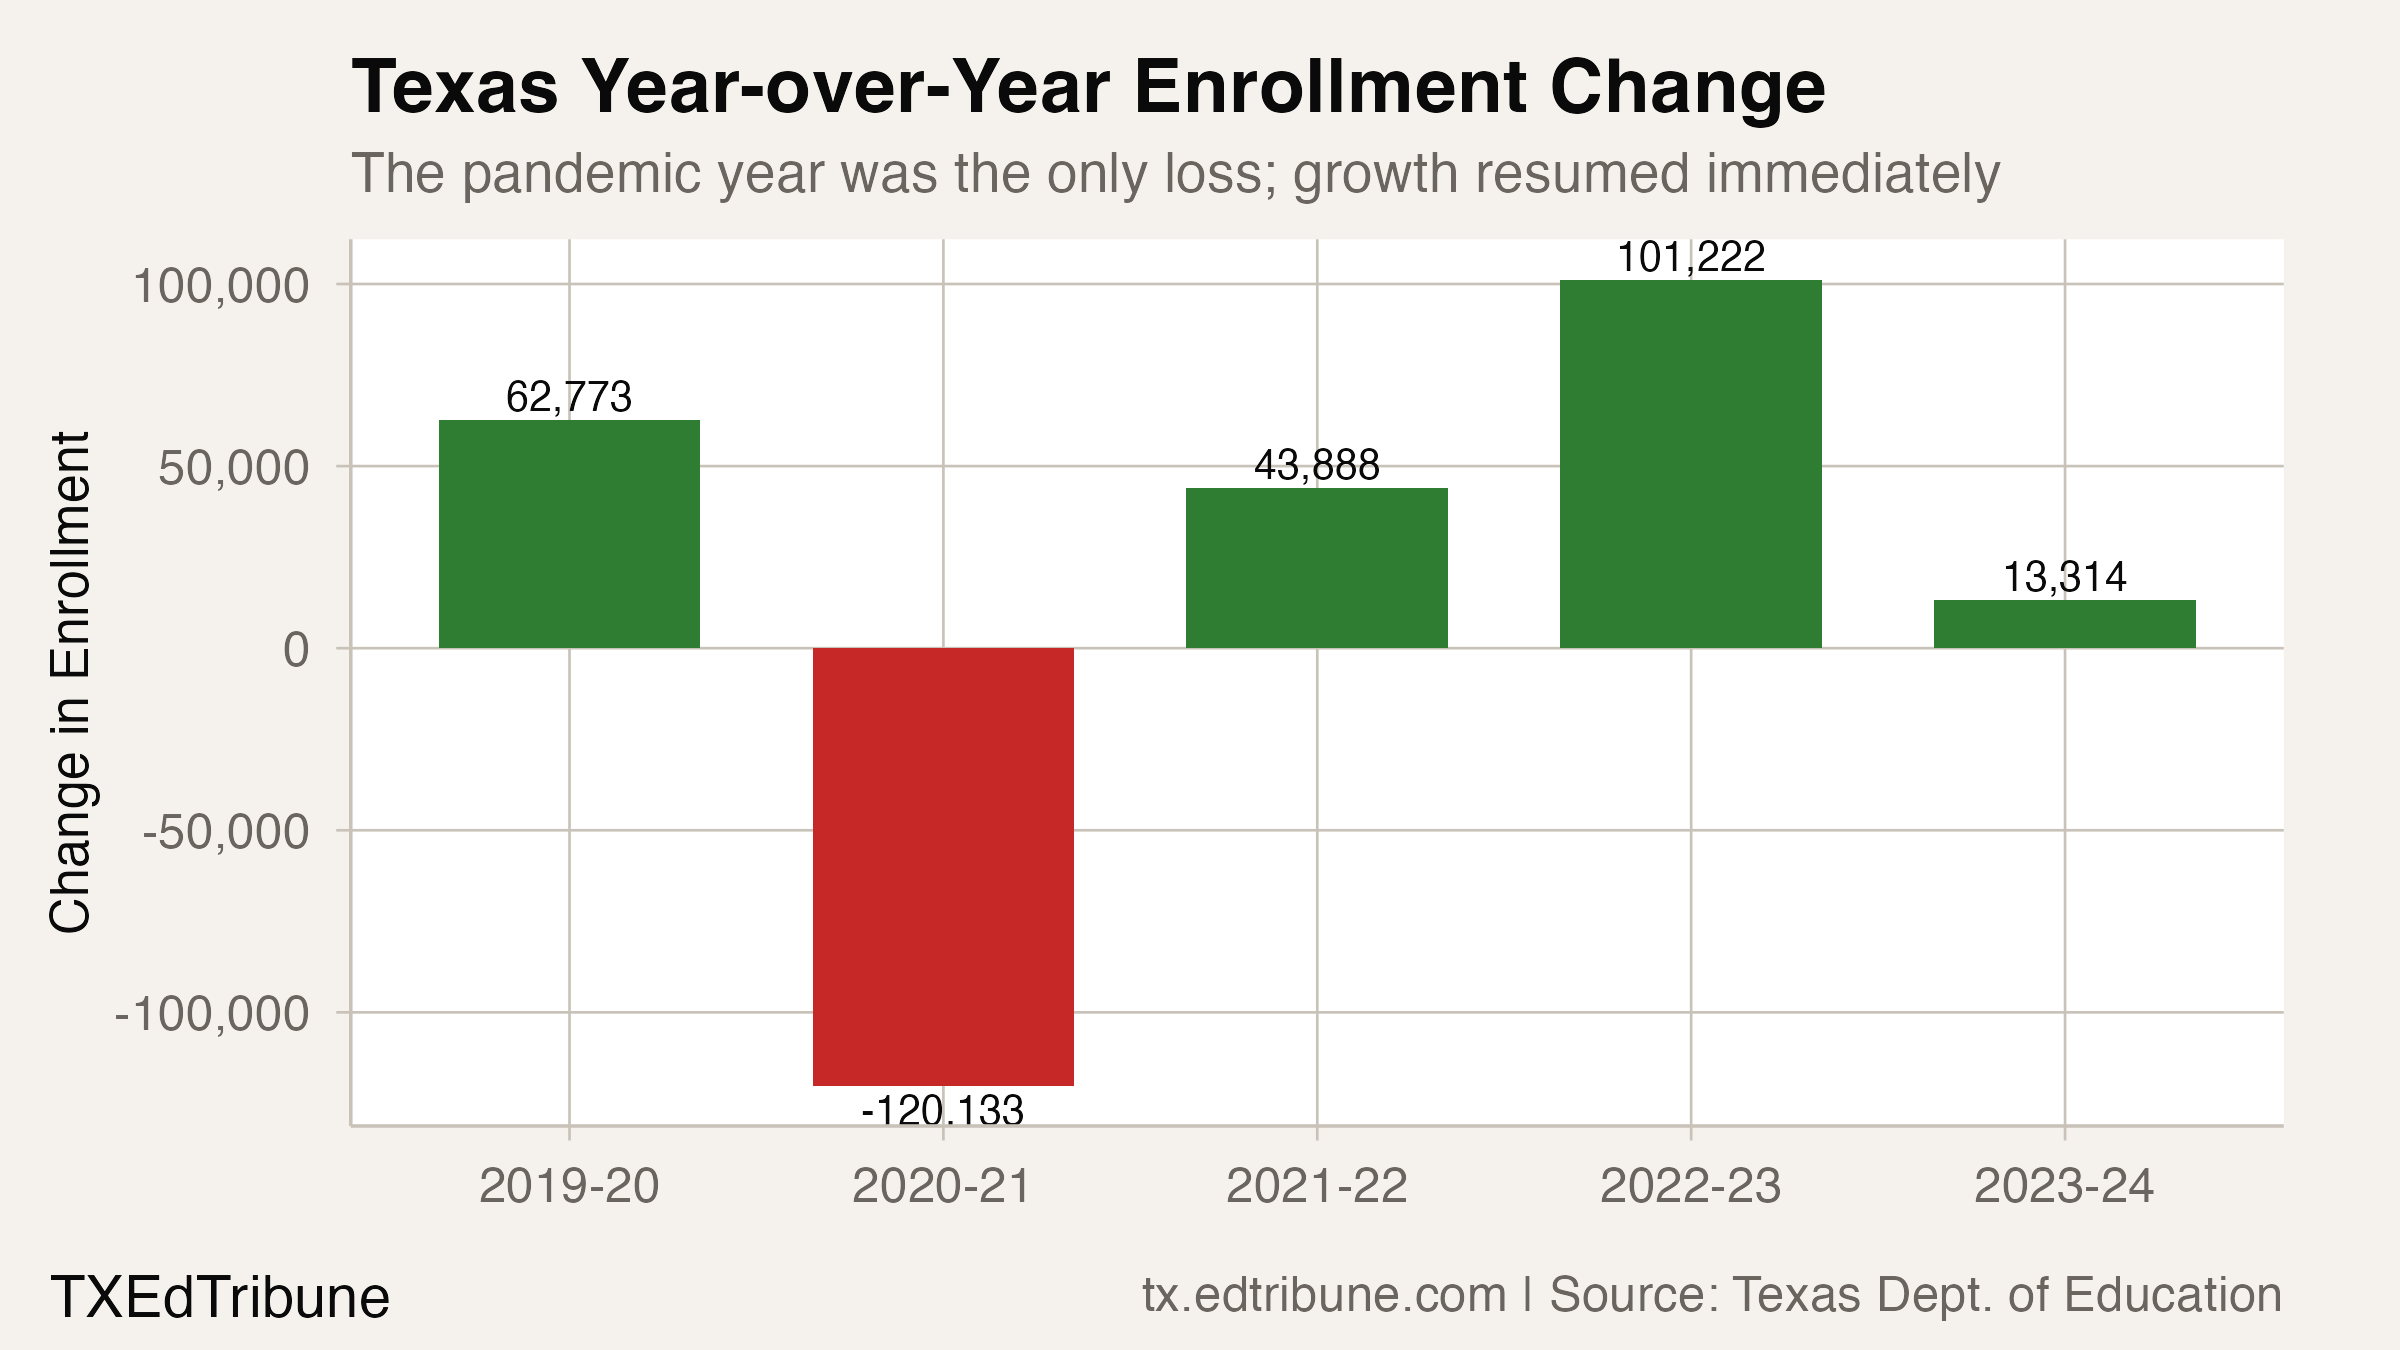
English learner enrollment barely dipped during the pandemic — falling by 4,467 students in 2020-21 while overall enrollment dropped by 120,133. The rebound was immediate. Texas added 63,454 English learners in 2021-22, then 97,747 in 2022-23 — the single largest one-year increase in the six-year series. Growth continued at 75,396 in 2023-24, a deceleration but still enormous by any historical standard.
| Year | EL Enrollment | EL Share | Year-over-Year Change |
|---|---|---|---|
| 2018-19 | 1,054,596 | 19.5% | — |
| 2019-20 | 1,112,674 | 20.3% | +58,078 |
| 2020-21 | 1,108,207 | 20.7% | -4,467 |
| 2021-22 | 1,171,661 | 21.7% | +63,454 |
| 2022-23 | 1,269,408 | 23.1% | +97,747 |
| 2023-24 | 1,344,804 | 24.4% | +75,396 |
The EL share climbed even in 2020-21, the one year their raw count fell, because overall enrollment fell faster. Meanwhile, white enrollment contracted every year, dropping from 1,484,069 (27.4%) to 1,379,090 (25.0%) — a loss of 104,979 students, or 7.1%.
| Subgroup | 2018-19 | 2023-24 | Change | Pct Change |
|---|---|---|---|---|
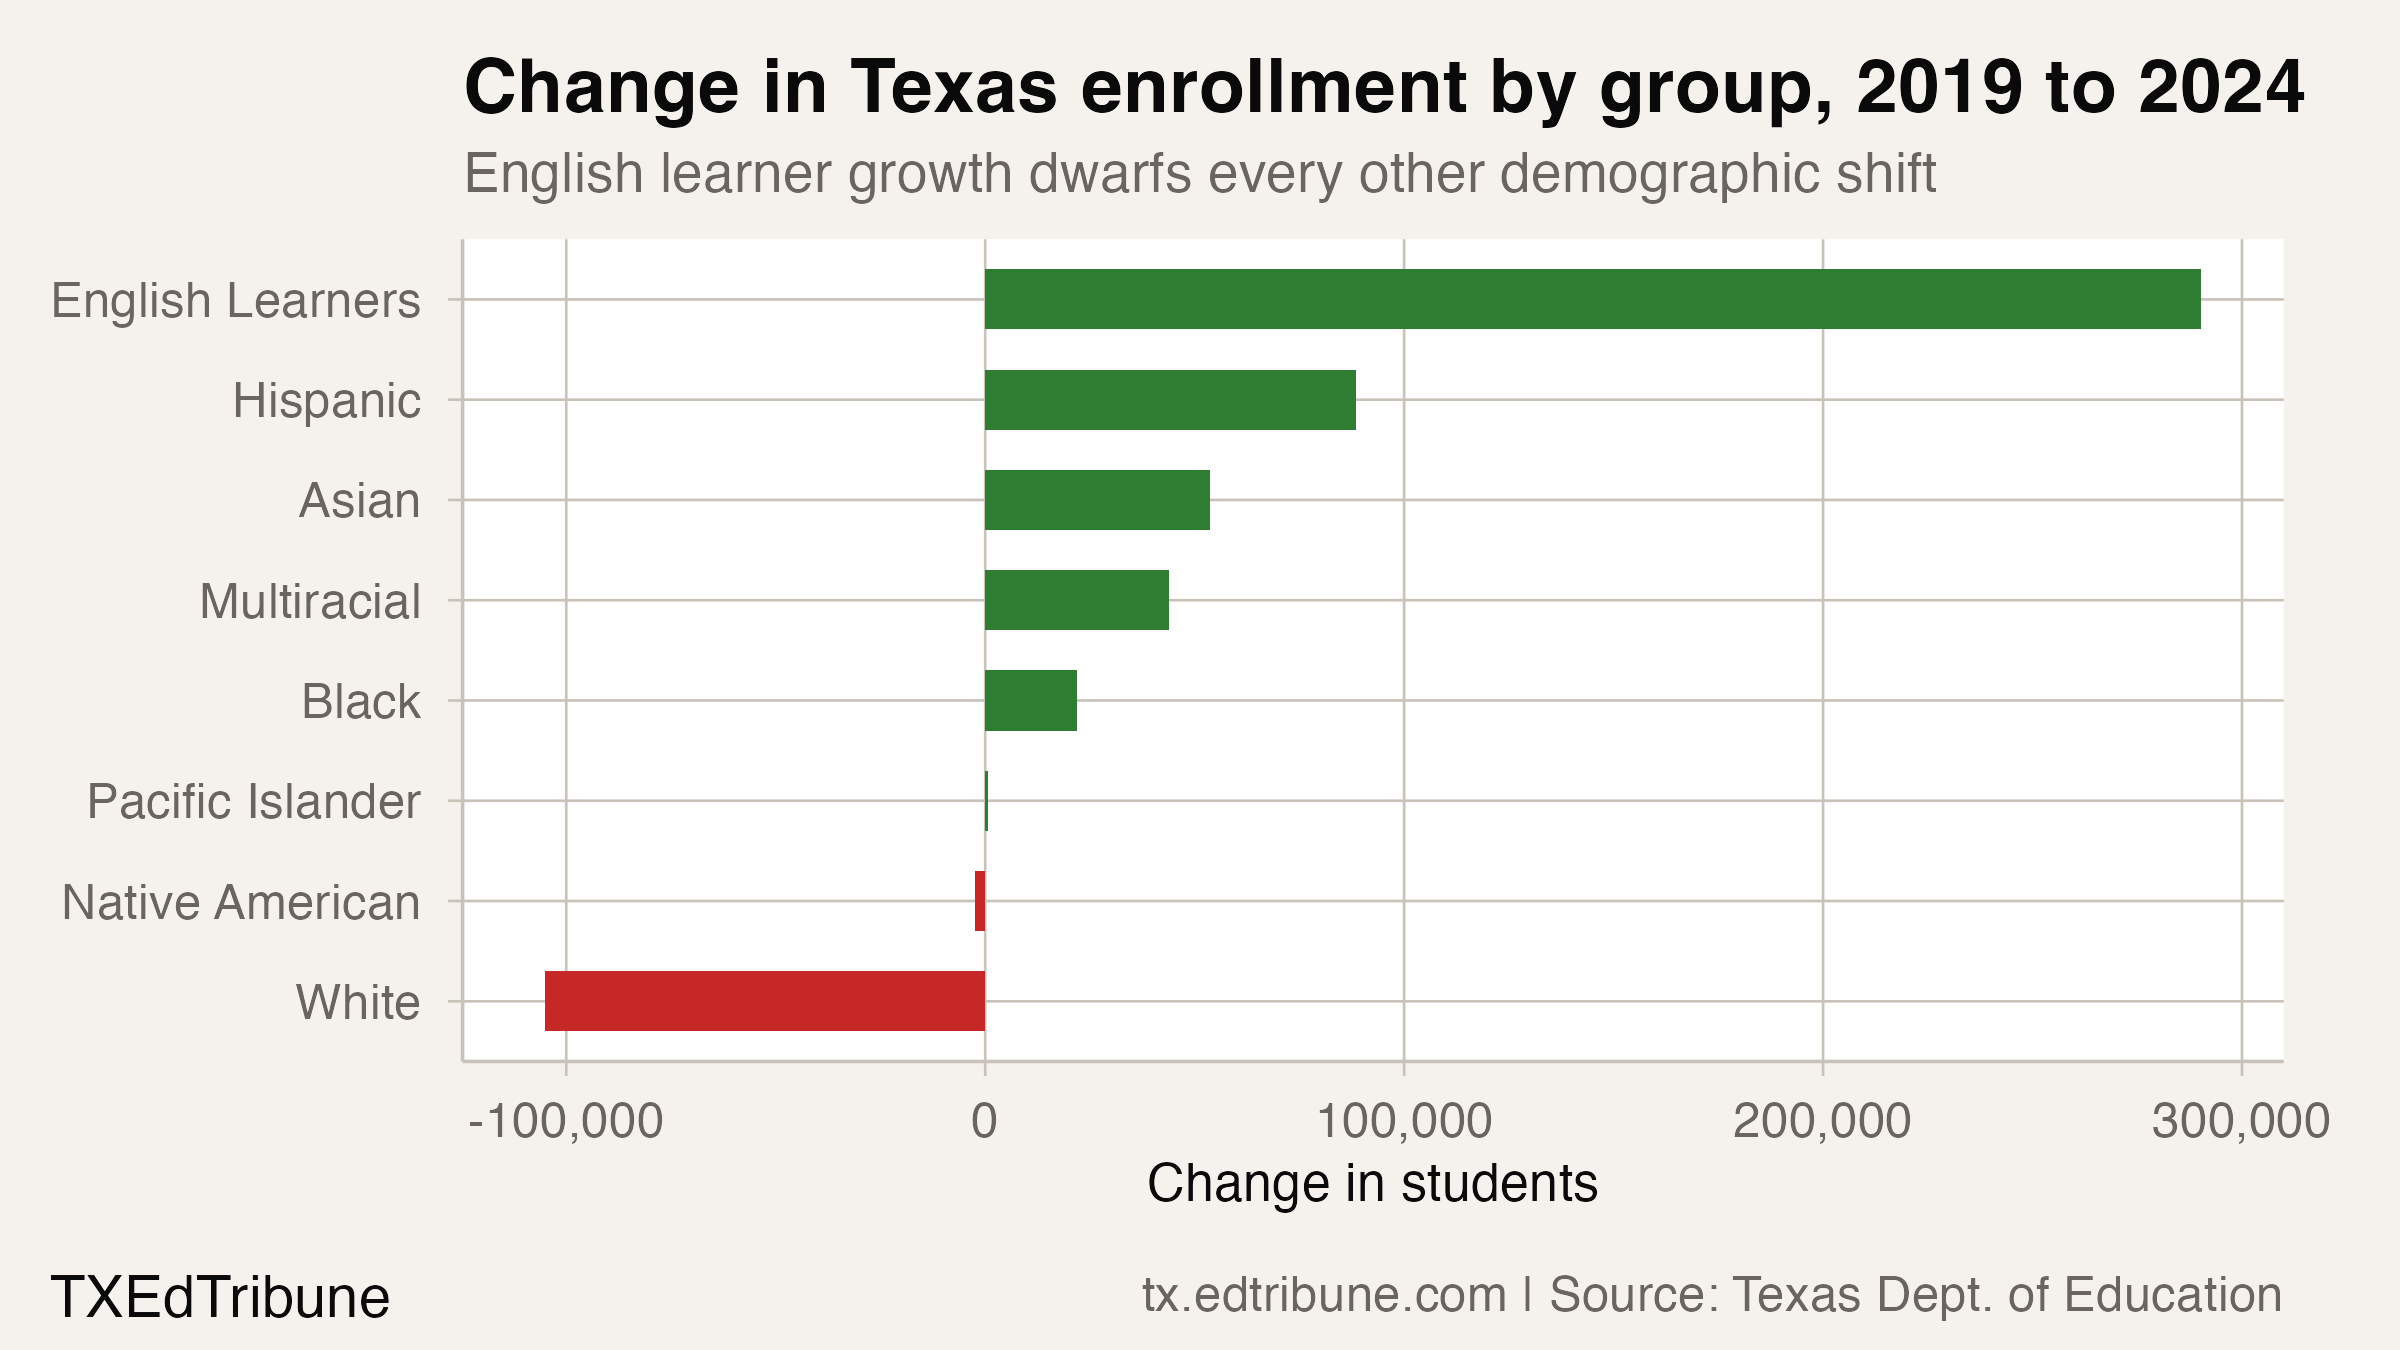
| English Learners | 1,054,596 | 1,344,804 | +290,208 | +27.5% |
| Econ. Disadvantaged | 3,283,812 | 3,434,955 | +151,143 | +4.6% |
| White | 1,484,069 | 1,379,090 | -104,979 | -7.1% |
| Hispanic | 2,847,629 | 2,936,051 | +88,422 | +3.1% |
| Asian | 242,247 | 295,946 | +53,699 | +22.2% |
| Multiracial | 129,490 | 173,425 | +43,935 | +33.9% |
| Black | 684,349 | 706,235 | +21,886 | +3.2% |
Why this may be happening
Two mechanisms likely drive the EL surge, and the data cannot cleanly separate them.
The first is new arrivals. The Office of Refugee Resettlement released 16,394 unaccompanied minors to sponsors in Texas during fiscal year 2023 alone, and the Center for Immigration Studies found that the share of Texas K-12 students from immigrant households nearly doubled from 17% in 1990 to 31% in 2021. Texas's position on the southern border and its large existing immigrant communities make it a primary destination for families with school-age children — suggestive context, though TEA does not track enrollment by immigration status, so the direct connection to EL counts is inferred rather than measured.
The second is expanded identification. In August 2023, TEA adopted revisions to 19 Texas Administrative Code Chapter 89, Subchapter BB, changing the criteria Language Proficiency Assessment Committees use when reclassifying emergent bilingual students. Changes to identification and reclassification criteria can shift who counts as an English learner without any change in the actual student population — a student who would have been reclassified as proficient under old rules might remain classified as EL under new ones. This is direct evidence of a policy mechanism, though its precise contribution to the 290,000-student increase is unknown.
A competing explanation for part of the growth is post-pandemic re-identification: students who left school rolls during 2020-21 and returned in subsequent years may have been newly assessed and classified.
What reporting suggests
The bilingual teacher shortage predates the current surge but has intensified alongside it. The Texas Association of School Boards reported that bilingual educators have been a designated shortage field in Texas every year since 1990, driven partly by certification requirements:
"Educators wanting to become certified for a bilingual teaching position must take two additional tests — the Bilingual Target Language Proficiency Test (BTLPT) and the Bilingual Education Supplemental test, which are considered by many to be more difficult and expensive." — Texas Association of School Boards
The shortage is not confined to Texas. A National Center for Education Statistics survey found that 69% of public schools nationally reported difficulty filling ESL or bilingual education positions for the 2024-25 academic year, underscoring a structural mismatch between the growth in English learners and the supply of teachers trained to serve them.
Federal funding has not kept pace. Education Week reported in February 2026 that Title III allocations have remained effectively flat for 15 years, hovering between $700 million and $890 million nationally even as English learner enrollment has risen in nearly every state:
"Multilingual learners are the fastest-growing student group in U.S. schools, with enrollment rising in nearly every state, yet shortages of ESL-certified teachers mean many students are being taught by educators without specialized training." — Education Week, Feb. 2026
What we don't know
The single biggest gap is the inability to distinguish newly arrived students from newly identified ones. TEA does not publish enrollment by immigration status, which means the 290,208-student increase could reflect actual new students entering Texas schools, existing students being reclassified into the EL category under changed criteria, or — most likely — some combination of both. Without that breakdown, any claim about the relative contribution of immigration versus identification policy is speculative.
It is also unclear whether the 2023 reclassification criteria changes had a measurable effect on EL counts for 2023-24 specifically, since the revised rules took effect in August 2023 and required LPACs to make reclassification decisions for the 2022-23 cohort within the first 45 days of the new school year. The timing suggests some students who might have exited EL status under prior criteria may have remained classified as EL, but TEA has not published an analysis quantifying this effect.
Budget pressure
A system serving 1.34 million English learners — up from 1.05 million five years ago — operates under different fiscal math than the one it replaced. Every district in Texas is required to offer bilingual education or ESL programs to identified students, and the instructional programs these students receive carry higher per-pupil costs than general education. The state's Bilingual Education Allotment provides supplemental funding, but districts report that it does not fully cover the cost of certified bilingual teachers, dual-language program materials, and the additional assessment infrastructure that a 24.4% EL population demands.
Title III grants, allocated partly by EL headcount, give Texas a growing claim on the federal funding pool. But with national Title III appropriations flat at $890 million and the state's EL population growing by 27.5%, the per-student federal contribution is shrinking in real terms. Districts that were already recruiting bilingual teachers from Puerto Rico and Spain to fill vacancies now face the same shortage with 290,000 additional students to serve.
Data source
All figures derived from the Texas Education Agency enrollment files via the txschooldata R package. Full analysis code:
2026-03-05-tx-enrollment-overview-analysis.R